Introduction
Glioblastoma is the most common and most devastating
type of primary brain tumor. At present, the treatment of
glioblastoma involves surgery, radiotherapy and chemotherapy, all
of which are acknowledged as palliative measures, meaning that they
do not provide a cure, and the median survival time for patients
with glioblastoma multiforme is only ~14.6 months (1,2). On
this basis, it is necessary to find new methods to improve the
treatment of glioblastoma.
There is compelling evidence that cancer stem cells
play a key role in cancer drug resistance, occurrence and
development; CD133+ cells are regarded as having
self-renewal and infinite proliferation abilities (3). Based on the concept of cancer stem
cells, a new mode of tumor resistance has been identified. The
natural resistance mechanism of cancer stem cells, including the
adoption of a resting state, the ability to repair DNA, the
expression of ABC transporters and resistance to apoptosis, all
lead to stem cells remaining following chemotherapy (4). It has been found that only 100
CD133+ stem cells are required to successfully establish
a new glioma when serially transplanted (5). The biological characteristics of
cancer stem cells may led to the failure of long-term chemotherapy;
the overexpression of multidrug resistance proteins (MRPs) has been
observed in cancer stem cells isolated from certain solid tumors.
MRPs provide tumor progenitor cells with resistance to the killing
effect of cytotoxic drugs and alter the differentiation of cells
(6). Therefore, the study of
glioma stem cells may be a key step to solving the problem of tumor
chemotherapy failure and tumor recurrence.
The present study investigated the expression of
livin in glioma cells, including glioma stem cells. Temozolomide
(TMZ) intervention in a cell model with lentivirus transfection was
used to investigate the changes in the expression of livin and the
associated caspase-3 in U251 glioma cells and U251 stem cells. The
effects on the cell cycle of the changes in livin expression and
TMZ intervention were also examined.
Materials and methods
Chemicals and reagents
Dulbecco’s modified Eagle’s medium/Nutrient Mixture
F-12 Ham’s (DMEM/F12) and fetal bovine serum (FBS) were purchased
from HyClone (Logan, UT, USA). B-27 (50X) Serum-Free Supplement was
from Gibco (Grand Island, NY, USA). Epidermal growth factor (EGF)
and basic fibroblast growth factor (bFGF) were obtained from
Peprotech (Rocky Hill, NJ, USA). Leukemia inhibitory factor (LIF)
was obtained from ProSpec-Tany TechnoGene Ltd. (Rehovot, Israel).
The CD133 cell isolation kit [magnetic cell sorting (MACS) method]
was purchased from Miltenyi Biotec GmbH (Bergisch Gladbach,
Germany). Antibodies to nestin, glial fibrillary acidic protein
(GFAP) and tubulin-β were obtained from Santa Cruz Biotechnology,
Inc. (Santa Cruz, CA, USA). Cell Counting kit-8 (CCK-8) was
obtained from Dojindo Molecular Technologies, Inc. (Kumamoto,
Japan). Cell Cycle and Apoptosis Analysis kits and trypsin were
obtained from Beyotime Institute of Biotechnology (Shanghai,
China). Lentivirus was purchased from Shanghai GeneChem Co., Ltd.
(Shanghai, China).
Glioma cell line culture
The U251 glioblastoma cell line was provided by
China Center for Typical Culture Collection (CCTCC, Wuhan, China).
The cell line was cultured in a medium containing DMEM/F12, 10%
FBS, 100 U/ml benzylpenicillin and 100 μg/ml streptomycin, under
conditions of 37°C, 5% CO2 and saturated humidity.
Isolation and identification of
CD133+ glioma stem cells
The U251 cells were collected and inoculated at low
density into a serum-free medium [neural stem cell (NSC) medium]
that contained DMEM/F12, 20 ng/ml EGF, 20 ng/ml bFGF, 10 ng/ml LIF
and B-27 (1X). The cells were placed in an incubator under
conditions of 37°C, 5% CO2 and saturated humidity. Once
every 3–4 days, half of the medium was replaced. After the
neurospheres had grown in large quantities, the spheres were
collected and CD133+ cells were separated by a MACS
technique. The sorting process was conducted according to the
instructions of the CD133 cell isolation kit.
The well-grown cell spheres were selected for
growing on polylysine-coated slides. After drying at 37°C, the
slides were washed with phosphate-buffered saline (PBS) three times
in order to clear away the medium. At room temperature, the cells
were fixed with paraformaldehyde for 30 min, and then washed with
PBS again three times. After blocking with 5% goat serum at 37°C
for 30 min, rabbit anti-human nestin (1:200; primary antibody) was
added and the cells were placed in a wet box overnight. The day
following PBS washing, goat anti-rabbit IgG-FITC antibody
(secondary antibody) was added for incubation for 30 min at 37°C.
In addition, a negative control assay in which PBS was used instead
of the primary antibody was performed. The slides were observed
with an Olympus IX71 fluorescence microscope (Olympus, Tokyo,
Japan). The immunofluorescence assay procedures for the detection
of GFAP and β-tubulin on differentiated glioma stem cells were as
described for nestin, with the exception that respective primary
antibodies were used.
Cell morphology observation
After the TMZ (0, 25, 50, 100, 200 or 400 μmol/l)
had been added to the cells for 48 h, the cell morphology was
observed with an inverted microscope (Olympus CKX41; magnification,
×10).
Transfection with lentivirus
Cells (1×10⁵) were inoculated into 6-well
plates. According to the instructions of the lentivirus
transfection reagent, and with multiplicities of infection (MOI)
determined in a preliminary experiment (U251 cells, MOI=5; U251
stem cells, MOI=10), lentivirus encoding livin or small hairpin RNA
(shRNA) against livin was directly mixed with the enhanced
infection solution (slow virus diluent), and then mixed with 500 μl
culture medium under conditions of 37°C, 5% CO2 and
saturated humidity. After 20 h of contact with the cells, the
lentivirus medium was replaced with ordinary medium. Three days
later, lentiviral transfection was observed under a fluorescence
microscope. The transfection procedures were conducted using
biological safety equipment.
CCK-8 assay for cell survival
analysis
Following treatment with the various concentrations
of TMZ for 48 h, the cell survival rate was determined using the
CCK-8 solution according to the manufacturer’s instructions. Cells
in 96-well plate were treated with 10 μl CCK-8 solution, and
incubated for 2 h at 37°C. The absorbance (A) of each well was
quantified at 450 nm using an automated ELISA reader (Bio-Tek
Instruments Inc., Winooski, VT, USA). The cell survival rate (%)
was calculated as follows: [A(experimental well) − A(blank
well)]/[A(control well) − A(blank well)] × 100.
Cell cycle assay by flow cytometry
Following treatment with the various concentrations
of TMZ for 48h, the cell cycles of the U251 cells and U251 stem
cells were determined by flow cytometry. Briefly, the culture
medium was collected, and the treated cells were digested with
0.05% trypsin for 3–5 min. The digested cells were washed with
phosphate-buffered saline, and then fixed in 70% ethyl alcohol
overnight. Then, ~1×10⁶ cells were incubated with the
cell cycle detection kit according to the manufacturer’s
instructions prior to analysis by flow cytometry (BD™
LSR II; BD Biosciences, Franklin Lanes, NJ, USA). Control cells
(transfected with an empty vector) were similarly processed.
Quantitative PCR (qPCR)
Following treatment of the U251 and U251 stem cells
with the various concentrations of TMZ for 48 h, or with 400 μmol/l
TMZ for various times (0, 24, 48 and 72h), qPCR was performed as
described in a previous study by the authors (7). The cell samples (1×10⁶)
were collected and combined with 1 ml TRIzol reagent (Invitrogen
Life Technologies, Carlsbad, CA, USA) according to manufacturer’s
instructions, in order to obtain the total RNA from the U251 cells
and U251 stem cells. The RNA solution was stored at −80°C until
used. All reactions were performed in duplicate with a negative
control (no template) and the mean threshold cycle value (the start
of exponential amplification) of each sample was normalized with
the threshold cycle value of glyceraldehyde-3-phosphate
dehydrogenase (GAPDH), to provide the ΔCt value. qPCR was performed
using a 7900HT Sequence Detection system (Applied Biosystems,
Foster City, CA, USA). Reverse transcription was performed with
M-MLV Reverse Transcriptase (Takara Bio, Inc., Shiga, Japan). The
reverse transcriptional reaction system including 5.5 μl
H2O, 1.0 μl oligo(dT)18 (50 μg/ml) and 6.0 μl
total RNA was heated to 70°C for 5 min and then chilled with ice to
unfold the mRNA secondary structure; and the subsequent step
included 0.5 μl RNasin (40 U/μl), 4.0 μl 5X buffer, 2.0 μl dNTP (10
mM) and 1.0 μl RTase (200 U/μl), with heating to 42°C for 60 min,
95°C for 5 min and chilling to 4°C. The qPCR reaction was performed
with SYBR-Green I fluorochrome. A standard curve was obtained and
the cycle threshold (Ct) value was calculated.
Each 50 μl PCR system contained 1/50 of the original
cDNA, 7 μl (25 mM) MgCl2, 0.8 μl (20 pmol/μl) each
primer, 1 μl (10 mM) dNTP, 1 μl SYBR-Green I, 0.5 μl (5 U/μl) Taq
DNA polymerase (Promega Corporation, Madison, WI, USA) and 5 μl 10X
buffer. Fifty cycles of amplification were performed: 94°C for 30
sec, 57°C for 30 sec, then 72°C for 30 sec. The fluorescence signal
was detected at the end of each cycle. Melting curve analysis was
used to confirm the specificity of the products. The
2−ΔΔCT method was used to analyze the results (8). The primers were as follows:
homo-livin, forward: 5′-GCTGTCAGTTCCTGCTCCGGTC-3′ and reverse:
5′-CAGGGGCTGCGTCTTCCGGTTC-3′; homo-caspase-3, forward:
5′-GAAGCGAATCAATGGACTCTGG-3′ and reverse:
5′-GTTTGCTGCATCGACATCTGTAC-3′.
Statistical analysis
Each test was performed in triplicate. The results
are presented as mean ± standard deviation. Comparisons of the data
were performed with Student’s t-test and one-way analysis of
variance. P<0.05 was considered to indicate a statistically
significant difference. The statistical analysis was performed with
SPSS software, version 13.0 (SPSS, Inc., Chicago, IL, USA).
Results
Cell morphology
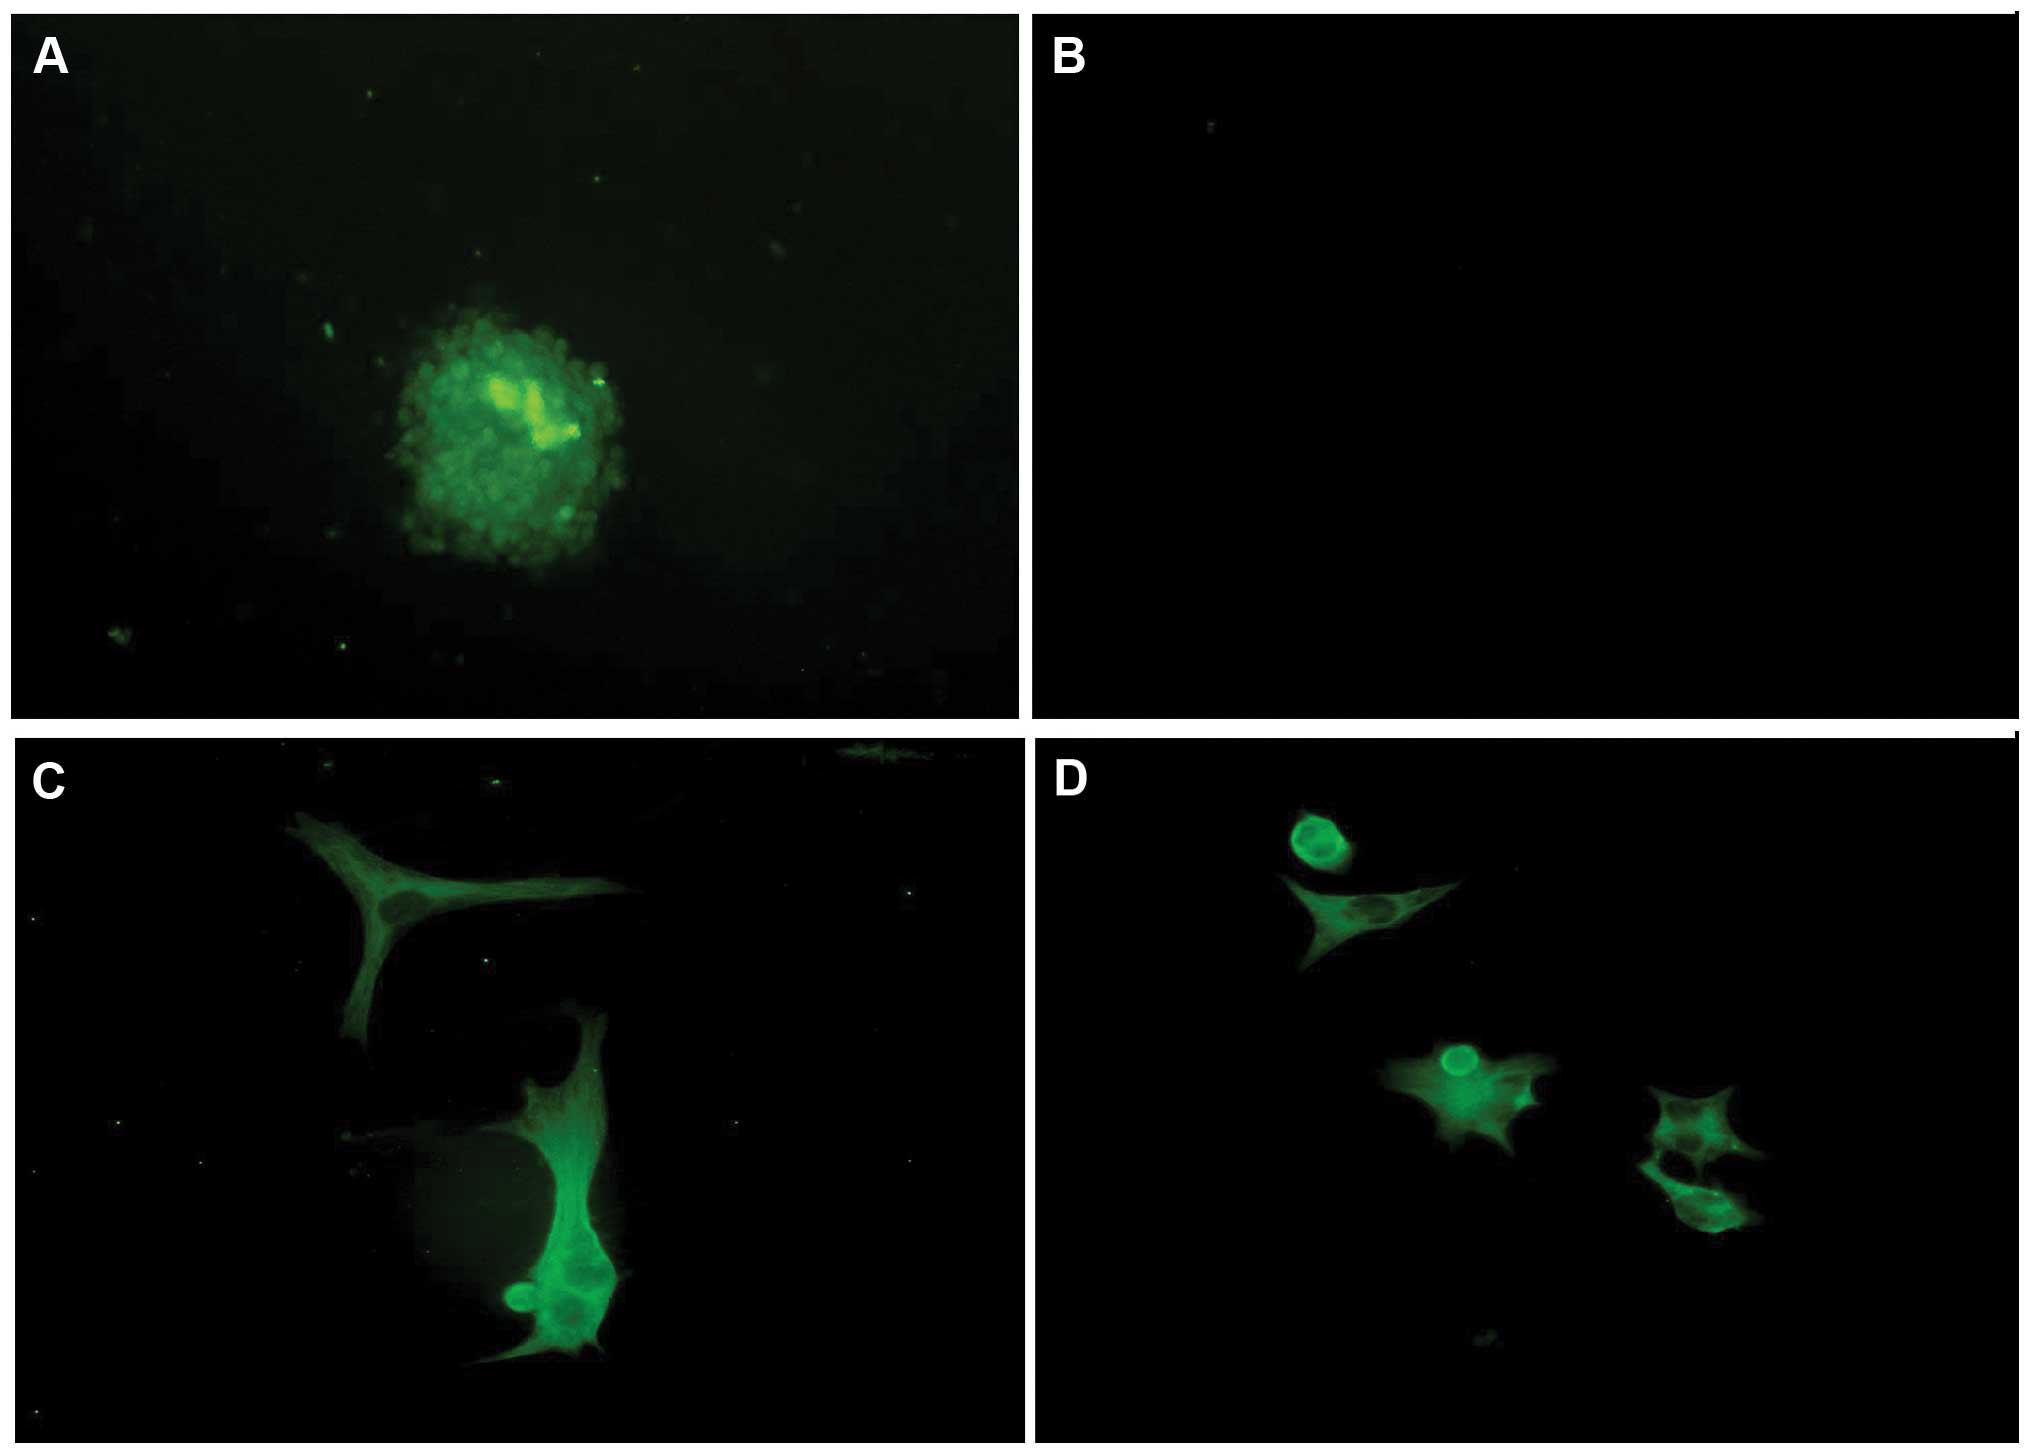
CD133+ cells were successfully separated
from U251 glioma cells by an immunomagnetic bead technique. The
stem cells began to grow together and form cell spheres after 3
days in the NCS medium. The cells tested positive for nestin. The
stem cell spheres were induced to break up after 7 days in serum
medium, and diverse cell morphology was observed: the cells were
attached, triangular, rounded or irregular in form, with elongated
cell bodies, and stained positive for GFAP and β-tubulin. These
observations confirmed that the stem cells had been induced to
differentiate into neural cells (Fig.
1).
Under an inverted microscope, following 48 h of TMZ
intervention, U251 cell and U251 stem cell proliferation was
inhibited. For the U251 cells, cell death was observed; the cell
density was significantly lower than that of the control group and
cell shrinkage, cell nucleus disintegration and the presence of
cell fragments floating on the medium surface were observed. For
the U251 stem cells, the morphology of the stem cell spheres
changed, the cells became gray and breakdown of the nucleus was
observed, but no cell fragments were present.
Cell survival
A CCK-8 kit was used to detect the cell activity of
the U251 cells and stem cells following TMZ intervention for 48 h.
The degree of proliferation of the U251 cells and U251 stem cells
at the same concentration and intervention time was as follows:
livin-overexpressing group > control group > livin-shRNA
group. It was observed that the adherent U251 cells proliferated
faster than the U251 tumor stem cells in the presence of the same
TMZ concentration for the same treatment time. TMZ inhibited the
cell proliferation of livin-overexpressing U251 cells and U251 stem
cells (P<0.05; Fig. 2).
qPCR results
qPCR demonstrated that there were higher expression
levels of livin and caspase-3 in the U251 glioma stem cells than in
the U251 glioma cells. TMZ effectively inhibited the expression of
livin in the U251 cells and U251 stem cells in all cell models
(P<0.05). The expression levels of livin were reduced as the
concentration of TMZ increased (Table
I). The levels of caspase-3 tended to increase as the
concentration of TMZ increased (Table
II). When the same concentration of TMZ was used, the
expression levels of livin and caspase-3 were reduced and
increased, respectively, as the treatment time was prolonged
(Table III). The overexpression
of livin and low expression of caspase-3 may enhance the
proliferation of cells, including that of stem cells. TMZ increased
the expression of caspase-3 and downregulated the expression of
livin both in U251 cells and stem cells.
 | Table ImRNA expression levels of livin prior
to and following treatment with various concentrations of TMZ for
48 h (mean ± SD). |
Table I
mRNA expression levels of livin prior
to and following treatment with various concentrations of TMZ for
48 h (mean ± SD).
| | TMZ concentration
(μmol/l) |
|---|
| |
|
|---|
| Livin status | Cells | 0 | 25 | 50 | 100 | 200 | 400 |
|---|
| OE
(10−3) | ACC | 0.441±0.025c | 0.425±0.027 | 0.294±0.021b | 0.264±0.017b | 0.202±0.022b | 0.105±0.016b |
| CSC | 8.364±0.56c,d | 6.506±0.419a,d | 6.439±0.437b,d | 6.193±0.354b,d | 4.744±0.283b,d | 4.386±0.416b,d |
| CON
(10−5) | ACC | 2.137±0.345 | 0.055±0.012b | 0.027±0.002b | 0.021±0.006b | 0.016±0.002b | 0.013±0.002b |
| CSC | 50.025±3.182d | 27.230±3.294b,d | 22.403±2.686b,d | 11.581±2.740b,d | 10.865±2.917b,d | 9.428±2.503b,d |
| shRNA
(10−7) | ACC | 2.236±0.196c | 1.208±0.165b | 1.203±0.168b | 1.016±0.015b | 0.084±0.013b | 0.059±0.019b |
| CSC | 7.399±0.760c,d | 5.747±0.625a,d | 4.480±0.484b,d | 3.550±0.487b,d | 2.455±0.421b,d | 1.700±0.342b,d |
| Table IImRNA expression levels of caspase-3
prior to and following treatment with various concentrations of TMZ
for 48 h (mean ± SD). |
Table II
mRNA expression levels of caspase-3
prior to and following treatment with various concentrations of TMZ
for 48 h (mean ± SD).
| | TMZ concentration
(μmol/l) |
|---|
| |
|
|---|
| Livin status | Cells | 0 | 25 | 50 | 100 | 200 | 400 |
|---|
| OE
(10−5) | ACC | 0.479±0.054c | 0.647±0.050a | 0.997±0.199a | 1.203±0.281a | 1.646±0.388b | 1.772±0.394b |
| CSC | 1.111±0.270c,e | 1.794±0.417f | 4.760±0.513b,f | 6.274±0.501b,f | 6.349±0.464b,f | 9.677±0.689b,f |
| CON
(10−5) | ACC | 1.145±0.316 | 1.454±0.478 | 2.133±0.547 | 2.841±0.680a | 3.918±0.604b | 5.632±0.607b |
| CSC | 2.083±0.392e | 3.473±0.466a,f | 4.636±0.587b,f | 4.740±0.503b,e | 5.179±0.518b | 8.052±0.745b,e |
| shRNA
(10−5) | ACC | 3.276±0.504d | 3.188±0.500 | 3.559±0.451 | 4.461±0.501a | 6.471±0.452b | 6.807±0.518b |
| CSC |
16.525±1.825d,f |
22.421±2.151a,f |
27.521±2.371b,f |
37.191±3.160b,f |
53.518±4.055b,f |
69.564±5.538b,f |
| Table IIImRNA expression levels of livin and
caspase-3 following treatment with 400 μmol/l TMZ for various times
(data presented as mean ± SD). |
Table III
mRNA expression levels of livin and
caspase-3 following treatment with 400 μmol/l TMZ for various times
(data presented as mean ± SD).
| | Time |
|---|
| |
|
|---|
| mRNA | Cells | 0 h | 24 h | 48 h | 72 h |
|---|
| Livin
(x10−5) | ACC | 2.464±0.111 | 0.014±0.002a | 0.013±0.002a | 0.007±0.001a |
| CSC | 54.438±2.16b | 9.842±0.261a,d | 9.428±0.253a,d | 1.740±0.202a,d |
| Caspase-3
(x10−5) | ACC | 1.157±0.091 | 5.031±0.422a | 5.632±0.607a |
8.246±0.4811a |
| CSC | 2.132±0.127b | 5.357±0.466a | 8.052±0.747a,c |
11.081±1.450a,c |
Cell cycle
In the U251 cell group, compared with the respective
transfected control group, the livin-overexpressing group had an
increased proportion of cells in the G2-M phase, whereas the
livin-shRNA group had marked increases in the proportions of cells
in the S and G2-M phases (P<0.05). Following 48 h of exposure to
400 μmol/l TMZ, the control and livin-shRNA groups demonstrated
increases in the proportions of cells in the G2-M phase, whereas
the livin-overexpressing group had an increased proportion of cells
in the S phase (P<0.05). These results indicate that the effect
of TMZ on the cell cycle was different from that on the blank
control group following transfection with the two lentiviruses.
For U251 stem cells, compared with the respective
blank control group, the livin-overexpressing and shRNA groups
demonstrated slight increases in the proportion of cells in the S
phase of the cell cycle (P<0.05). Following intervention with
400 μmol/l TMZ for 48 h, the blank control group underwent an
increase in the S phase, the livin-overexpressing group had marked
increases in the proportion of cells in the G0 and G2-M phases and
the livin-shRNA group had increases in the S and G2-M phases
(P<0.05; Fig. 3).
Discussion
According to the theory of antiapoptotic gene
expression, the proliferation and apoptosis of tumors occurs due to
gene expression imbalance (9).
Gene expression is controlled by various factors in vitro
and in vivo; the expression of antiapoptotic genes causes a
reduction of cell apoptosis, eventually leading to malignant cell
proliferation. Therefore, the investigation of methods for the
effective induction of cell apoptosis in order to cure cancer have
become a focus for numerous studies. Livin (also known as KIAP or
ML-IAP) is a member of the apoptosis suppressor protein (inhibitor
of apoptosis protein; IAP) family. Among the eight members of the
IAP family, only livin has two subunits (α and β); thus, livin has
a stronger antiapoptotic effect compared with the other members
(10). It plays a key role in cell
apoptosis and proliferation, and the cell cycle (11). Members of the IAP family have a
repetitive BIR structural domain and/or a RING domain. A previous
study demonstrated that the antiapoptotic mechanisms of the IAP
family mainly involve the direct interaction of the BIR structural
domain with a combination of caspases 3 and 8, which blocks caspase
activation and prevents apoptosis (12). Since 2005, our group have observed
that the overexpression of livin in U251 glioma cells and the
associated stem cells blocks the antiapoptotic induction channel,
restricting the transduction of death signals, and has a close
relationship with chemotherapy resistance (7,13,14).
Results have indicated that livin and caspase are closely related,
as they play important roles in apoptotic and anti-apoptotic
processes, respectively. The expression of livin was inhibited more
strongly in the U251 cells than in the U251 stem cells, which
indicates that stem cells have a stronger resistance to TMZ than
U251 cells have under the same conditions.
Caspases are cysteine proteases that regulate
apoptosis. They are able to promote apoptosis through the protease
cascade reaction. Caspase proteins may be divided into three
categories: apoptosis initiators (caspase-9), apoptosis
executioners (caspase-3 and -7) and inflammation mediators
(15). Livin executes an
antiapoptotic effect mainly through controlling the cascading
activation reaction regulated by combined caspase proteins.
Nachmias found that livin combines with caspase-9, thereby exerting
an antiapoptotic effect in the initial phase of apoptosis (12). Caspase family proteases are the key
proteases for promoting apoptosis. They may be activated both by
the death receptor and mitochondrial-mediated cell apoptosis
pathways. In particular, caspase-3-mediated apoptosis is the key
mechanism of cell apoptosis (16).
Activated caspase proteins have been shown to hydrolyze a large
number of molecular proteins in cells, and finally lead to cell
death, as indicated by both biological chemistry and morphological
analysis (12). In the present
study, the expression of caspase-3 increased as the TMZ
concentration and TMZ intervention time increased. Cell apoptosis
was consequently induced, which caused the number of tumor cells to
decrease and inhibited tumor growth.
TMZ is a commonly used chemotherapy agent for the
treatment of glioblastoma multiforme. The mechanism of the
cytotoxic effect of TMZ is mainly through the methylation of the
guanine O6 position of the DNA repair protein
O6-alkylguanine DNA alkyltransferase (MGMT), which
changes its structure and reduces its activity (17). Although TMZ is able to increase the
2-year survival rate of patients significantly, long-term survivors
are seldom found. The biological characteristics of cancer stem
cells may be the cause of the failure of long-term chemotherapy;
MRPs are expressed in the cancer stem cells isolated from certain
solid tumors, and may provide the tumor progenitor cells with
resistance to the killing effect of cytotoxic drugs and alter the
differentiation of cells. TMZ may efficiently inhibit cell
proliferation rather than induce cell death in cancer stem cells
(18). The study by Beier et
al provided the important evidence that CD133+
cancer stem cells display resistance to conventional chemotherapy
drugs; the CD133+ levels of recurrent tumors are higher
than those of primary tumors in patients with glioblastoma
multiforme (19). Overmeyer et
al reported that TMZ caused the aging and apoptosis of
glioblastoma multiforme cells, and that mutations of tumor
suppressor genes, such as P53, could reduce the sensitivity of the
cells to TMZ-induced apoptosis. There is also certain evidence
indicating that TMZ may overcome the resistance of glioblastoma
multiforme to apoptosis by inducing autophagy (20). In the present study, following TMZ
intervention, the results showed that TMZ inhibited the apoptosis
process by inhibiting the expression of livin, increasing the
expression of caspase-3 and arresting the cell cycle.
Based on the above observations and the previous
study results, by using lentiviral transfection technology, cell
models including overexpression, natural expression and silenced
expression of livin were successfully constructed. The results
demonstrated that livin plays an important role in the process of
cell proliferation; the higher the expression level of livin, the
faster cells proliferate. Following TMZ intervention, it was found
that the mechanism of impact on the cell cycle differed between
cancer stem cells and normal cells with the same intervention. The
U251 cells stagnated in the G2-M phase, whereas the U251 stem cells
stagnated in the S phase. The expression levels of caspase-3
increased as the concentration of TMZ increased. Caspase-3 may
accelerate apoptosis and has a certain relationship with the
expression of livin; however, the mechanism is not yet clear and
requires further study.
Acknowledgements
This study was sponsored by the China National
Science Fund (No. 81071779/H1607) and Shandong Provincial Fund for
Awarding Excellent Young and Middle-age Scientist (No.
BS2010YY006).
The study was performed in the Laboratory of General
Surgery and Central Laboratory of Union Hospital, Tongji Medical
College, Huazhong University of Science and Technology. The authors
would like to acknowledge the staff of these laboratories for their
assistance.
References
|
1
|
Hingtgen S, Ren XH, Terwilliger E, et al:
Targeting multiple pathways in glioma with stem cell and viral
delivered S-TRAIL and temozolomide. Mol Cancer Ther. 7:3575–3585.
2008. View Article : Google Scholar : PubMed/NCBI
|
|
2
|
Norden AD and Wen PY: Glioma therapy in
adults. Neurologist. 12:279–292. 2006. View Article : Google Scholar : PubMed/NCBI
|
|
3
|
Liu GT, Yuan XP, Zeng ZH, et al: Analysis
of gene expression and chemoresistance of CD133+ cancer
stem cells in glioblastoma. Mol Cancer. 5:67–79. 2006. View Article : Google Scholar
|
|
4
|
Dean M, Fojo T and Bates S: Tumour stem
cells and drug resistance. Nat Rev Cancer. 5:275–284. 2005.
View Article : Google Scholar : PubMed/NCBI
|
|
5
|
Gilbert CA and Ross AH: Cancer stem cell:
cell culture, markers and targets for new therapies. J Cell
Biochem. 108:1031–1038. 2009. View Article : Google Scholar : PubMed/NCBI
|
|
6
|
Beier D, Röhrl S, Pillai DR, et al:
Temozolomide preferentially depletes cancer stem cells in
glioblastoma. Cancer Res. 68:5706–5715. 2008. View Article : Google Scholar : PubMed/NCBI
|
|
7
|
Jin F, Zhao L, Zhao HY, et al: Comparison
between cells and cancer stem-like cells isolated from glioblastoma
and astrocytoma on expression of anti-apoptotic and multidrug
resistance-associated protein genes. Neuroscience. 154:541–550.
2008. View Article : Google Scholar : PubMed/NCBI
|
|
8
|
Livak KJ and Schmittgen TD: Analysis of
relative gene expression data using real-time quantitative PCR and
the 2(−Delta Delta C(T)) method. Methods. 25:402–408. 2001.
View Article : Google Scholar
|
|
9
|
LaCasse EC, Baird S, Korneluk RG and
MacKenzie AE: The inhibitors of apoptosis (IAPs) and their emerging
role in cancer. Oncogene. 17:3247–3259. 1998. View Article : Google Scholar
|
|
10
|
Lopes RB, Gangeswaran R, McNeish IA, et
al: Expression of the IAP protein family is dysregulated in
pancreatic cancer cells and is important for resistance to
chemotherapy. Int J Cancer. 120:2344–2352. 2007. View Article : Google Scholar : PubMed/NCBI
|
|
11
|
Yan B: Research progress on livin protein:
an inhibitor of apoptosis. Mol Cell Biochem. 357:39–45. 2011.
View Article : Google Scholar : PubMed/NCBI
|
|
12
|
Nachmias B, Ashab Y, Bucholtz V, et al:
Caspase-mediated cleavage converts livin from an antiapoptotic to a
proapoptotic factor: implications for drug-resistant melanoma.
Cancer Res. 63:6340–6349. 2003.PubMed/NCBI
|
|
13
|
Jin F, Zhao L, Zhao HY, et al: Paradoxical
expression of anti-apoptotic and MRP genes on cancer stem-like cell
isolated for TJ905 glioblastoma multiforme cell line. Cancer
Invest. 26:338–343. 2008. View Article : Google Scholar : PubMed/NCBI
|
|
14
|
Jin F, Zhao L, Guo YJ, et al: Influence of
Etoposide on antiapoptotic and multidrug resistance-associated
protein genes in CD133 positive U251 glioblastoma stem-like cells.
Brain Res. 1336:103–111. 2010. View Article : Google Scholar : PubMed/NCBI
|
|
15
|
Ma YB and Chang HY: Caspase work model
during pathogen infection. Virol Sin. 26:366–375. 2011. View Article : Google Scholar : PubMed/NCBI
|
|
16
|
He X, Nie H, Hong Y, et al: SIRT2 activity
is required for the survival of C6 glioma cells. Biochem Biophys
Res Commun. 417:468–472. 2012. View Article : Google Scholar
|
|
17
|
Ryu CH, Yoon WS, Park KY, et al: Valproic
acid downregulates the expression of MGMT and sensitizes
temozolomide-resistant glioma cells. J Biomed Biotechnol. 1–9.
2012. View Article : Google Scholar
|
|
18
|
Fisher T, Galanti G, Lavie G, et al:
Mechanisms operative in the antitumor activity of temozolomide in
glioblastoma multiforme. Cancer J. 13:335–344. 2007. View Article : Google Scholar : PubMed/NCBI
|
|
19
|
Beier D, Schulz JB and Beier CP:
Chemoresistance of glioblastoma cancer stem cells - much more
complex than expected. Mol Cancer. 10:128–139. 2011. View Article : Google Scholar :
|
|
20
|
Overmeyer JH, Young AM, Bhanot H and
Maltese WA: A chalcone-related small molecule that induces
methuosis, a novel form of non-apoptotic cell death in glioblastoma
cells. Mol Cancer. 10:69–86. 2011. View Article : Google Scholar
|