Introduction
Graves’ disease (GD) is an autoimmune disorder,
which is caused by abnormal genetic alterations, including
alterations in the expression levels of certain human cellular
genes, and various environmental factors, such as smoking (1). GD mainly affects the thyroid,
frequently resulting in enlarged and overactive thyroid glands, as
well as several symptoms, including muscle weakness, insomnia and
irritability (2,3). In addition, GD may affect the eyes,
resulting in exophthalmos, or other systems of the body, including
the skin, heart, circulation and nervous system. Up to 2% of the
female population is affected by GD, with a female-to-male ratio
between 5:1 and 10:1 (4,5). Furthermore, interactions between
genetic factors and environmental factors may increase the risk of
GD (6,7).
Previous studies have identified ~20 genetic
polymorphisms that are associated with GD, including genes
associated with the thyroid or involved in autoimmune responses
(8,9). T helper type 1 (Th1) and Th2 serum
cytokines have been demonstrated to be involved in the development
of GD (10–12). Interleukin (IL)-2, a cytokine
signaling molecule, is a protein regulating the activities of
lymphocytes that are involved in immunity. IL-2 is required for the
proliferation and differentiation of human T cells into effector
cells (13). A previous study
reported that the serum concentrations of IL-2 were increased in
patients with vitiligo, which is an acquired depigmenting disorder
associated with GD and characterized by the loss of functional
melanocytes (14).
IL-10 is an anti-inflammatory cytokine, also known
as a human cytokine synthesis inhibitory factor, which presents
pleiotropic effects in inflammation and immunoregulation. IL-10
inhibits the expression levels of Th1 cytokines, major
histocompatibility complex class II antigens and costimulatory
molecules on macrophages (15). In
addition, IL-10 assists B-cell survival, proliferation and antibody
production and affects the functionality of certain cellular
pathways. For instance, it inhibits the activities of nuclear
factor-κB and alters the JAK-STAT signaling pathway (16). A previous study on a murine model
indicated that IL-10 deficiency reduces the induction of
anti-thyroid stimulating hormone receptor antibodies; thus, IL-10
plays an important role in the development of GD in mice (17).
In the present study, the serum levels of IL-2 and
IL-10 were investigated in GD patients and healthy individuals. The
mRNA and protein expression levels of IL-2 and IL-10 were also
determined and compared between the GD patient and healthy control
groups. In addition, the study aimed to determine whether the IL-2
and IL-10 expression levels may be used as biological markers of
GD.
Materials and methods
Patients
A total of 256 individuals were enrolled into the
study, including 118 patients with GD (female, 80; male, 38; mean
age, 42.7±11.2 years) and 138 healthy individuals (female, 89;
male, 49; mean age, 41.8±10.8 years). The GD patients had been
newly diagnosed with GD and had not received any therapies prior to
participation in this study. The healthy individuals did not
possess antithyroid autoantibodies or a family history of
autoimmune disorders and served as the control group. As
demonstrated in Table I, no
statistically significant differences were detected in the age and
gender distribution between the GD and healthy groups (P>0.05).
All the experiments were conducted according to the Ethical
Guidelines of the Linyi People’s Hospital (Linyi, China) and
written informed consent was obtained from all the participants.
The present study was approved by the Ethics Committee of Linyi
People’s Hospital (Linyi, China).
 | Table IInformation of GD patients and healthy
individuals. |
Table I
Information of GD patients and healthy
individuals.
| Parameter | Healthy individuals
(n=138) | GD patients
(n=118) |
|---|
| Age (years) | 36–52 | 35–54 |
| Mean ages (years ±
SD) | 41.8±10.8 | 42.7±11.2 |
| Gender, female/male
(n) | 89/49 | 80/38 |
| Severe | - | 81 |
| Highly severe | - | 37 |
Enzyme-linked immunosorbent assay
(ELISA)
Blood samples (1 ml) were collected from all the
patients and healthy individuals, and were centrifuged at 800 × g
for 15 min for serum separation. The serum samples were analyzed
for specific antibodies using an indirect ELISA method, as
described in a previous study (18). GD patient serum samples were
defined as the GD group, whereas serum samples of the healthy
controls were defined as the healthy group. Goat anti-mouse
horseradish peroxidase (HRP)-labeled immunoglobulin (Ig)G (1:2,000;
Santa Cruz Biotechnology, Inc., Dallas TX, USA) was used as the
secondary antibody. The absorbance at 450 nm was measured using a
microplate reader (Multiskan MK-3; Thermo Fisher Scientific,
Vantaa, Finland). The antibody titers were calculated as the
highest dilution providing a positive reading. The cut-off value
was set to double the mean absorbance detected in the serum samples
of the negative healthy controls.
Reverse transcription-quantitative
polymerase chain reaction (RT-qPCR)
Total RNAs were harvested from the peripheral blood
mononuclear cell samples using the RNeasy kit (Qiagen Inc.,
Valencia, CA, USA), according to the manufacturer’s instructions.
The RT-qPCR experiments were repeated for a minimum of four times.
Subsequently, the total RNA samples (1 μl) were reversely
transcribed into cDNA using random primers in a Reverse
Transcription II system (Promega Corporation, Madison, WI, USA),
according to the manufacturer’s instructions. Next, the mRNA
expression levels were determined by qPCR using an ABI Sequence
Detection system (Applied Biosystems Life Technologies, Foster
City, CA, USA). An assay reagent containing premixed primers and a
VIC-labeled probe was used to determine the mRNA expression levels
of endogenous GAPDH. The FAM fluorescent intensity was measured to
detect the cDNA expression levels of IL-2 and IL-10, while the VIC
fluorescent intensity was measured to determine the cDNA expression
of endogenous GAPDH, using the ABI 7900HT Fast Real-Time PCR system
(Applied Biosystems Life Technologies). The relative mRNA
expression levels of IL-2 and IL-10 were normalized to the level of
GAPDH mRNA of each individual. The primers used in RT-qPCR are
listed in Table II.
| Table IIPrimers used in this study. |
Table II
Primers used in this study.
| Primers | Primer sequences | Targets |
|---|
| IL-2_F |
5′-ATGGTAACTACCGCGTATTGCA-3′ | IL-2 |
| IL-2_R |
5′-GTACCTAGGCTTTATCGATTCG-3′ | |
| IL-10_F |
5′-CTTCGAGATCTCCGAGATGCCTTC-3′ | IL-10 |
| IL-10_R |
5′-ATTCTTCACCTGCTCCACGGCCTT-3′ | |
| GAPDH_F |
5′-TGGCTATTGCATGTTCAACCA-3′ | GAPDH |
| GAPDH_R |
5′-GTCGAAGGTGAACTGTGTTCCT-3′ | |
| RFLP_IL-2_F |
5′-TATTCACATGTTCAGTGTAGTTCT-3′ | IL-2 |
| RFLP_IL-2_R |
5′-CATTGTGGCAGGAGTTGAGGT-3′ | |
| RFLP_IL-10_F |
5′-CCAAGACAACACTACTAAGGCTCCTTT-3′ | IL-10 |
| RFLP_IL-10_R |
5′-GCTTCTTATATGCTAGTCAGGT-3′ | |
Western blot analysis
Peripheral blood mononuclear cells were collected
for western blot analysis. Total proteins were isolated and
separated using SDS-PAGE, followed by immunoblot analysis. The
primary antibodies against IL-2, IL-10 and GAPDH were purchased
from Santa Cruz Biotechnology Inc. The antibodies used in this
study were as follows: rabbit polyclonal anti-IL-2 IgG antibody
(cat no., sc-7896; 1:200); mouse monoclonal anti-IL-10 IgG2b
antibody (cat no., sc-8438; 1:200); and goat polyclonal anti-GAPDH
IgG antibody (cat no., sc-20357; 1:10,000). The secondary
antibodies used in this study were the goat anti-mouse IgG-HRP (cat
no., sc-2005; 1:10,000; Santa Cruz Biotechnology Inc.) and goat
anti-rabbit IgG-HRP (cat no., sc-2004; 1:5,000; Santa Cruz
Biotechnology Inc.) antibodies. The bound antibodies were detected
using an enhanced chemiluminescence reagent (Pierce Biotechnology
Inc., Rockford, IL, USA). The experiments were repeated for a
minimum of three times. The obtained images were quantified using
the Image Quant 7.0 software (GE Healthcare Life Sciences, Little
Chalfont, UK).
Restriction fragment length polymorphism
(RFLP)
RT-qPCR was performed in a solution with total
volume of 50 μl, which consisted of 200 ng of DNA templates
isolated from the blood of the patients and healthy controls, 2
units Taq polymerase (Takara Bio Inc., Otsu, Japan) 200 μM
deoxynucleoside triphosphate (Takara Bio Inc.), 1 pmol PCR primer,
1.5 mM MgCl2, 10 mM Tris-HCl (pH 8.3) and 50 mM KCl. In
order to amplify the region of interest in the promoter of the IL-2
gene, the forward primer had a T base at the position −333, which
was altered to C, creating a restriction site for the MaeI
enzyme. The primers used are listed in Table II. RFLP analyses were conducted in
a reaction volume of 20-μl using 1.5 units MaeI (New England
Biolabs, Ltd., Hitchin, UK). The RFLP analysis of IL-10 was
performed following a similar method, using the primers listed in
Table II and the XagI
enzyme (New England Biolabs, Ltd.).
Statistical analysis
The experimental data are expressed as the mean ±
standard deviation. The SPSS statistical software (version 10.0:
SPSS, Inc., Chicago, IL, USA) was used to perform independent
sample t-tests, followed by one-way analysis of variance. In all
the analyses, P<0.05 was considered to indicate a statistically
significant difference. The correlation between the polymorphisms
and risks of GD was indicated by the odds ratio (OR) and the 95%
confidence interval (CI), which were calculated using a
nonconditional logistic regression model, adjusting for ages,
gender and other factors. The distribution of allele frequency was
determined by Hardy-Weinberg equilibrium.
Results
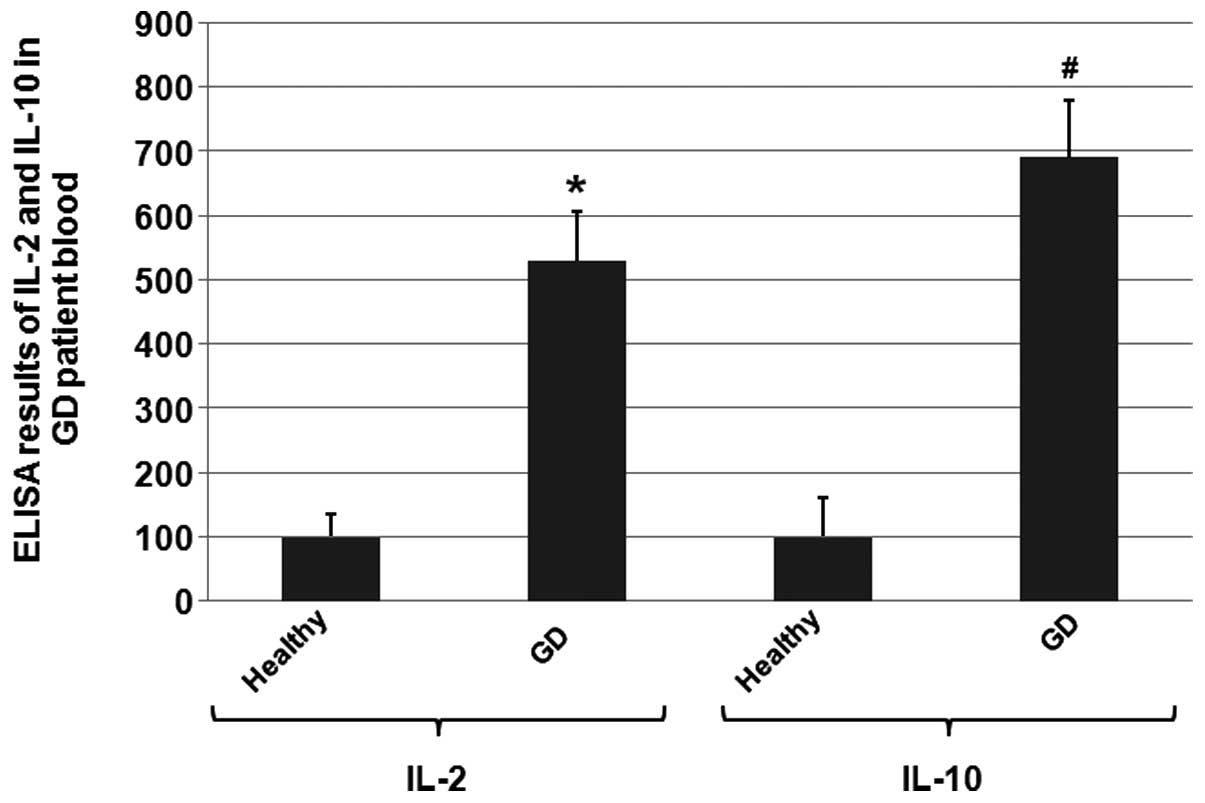
Elevated serum levels of IL-2 and IL-10
in GD patients
To determine whether the serum levels of IL-2 and
IL-10 were altered in the GD patients when compared with the
healthy controls, blood (1 ml) was collected from all the patients
and healthy individuals, followed by centrifugation for serum
separation and determination of the serum levels using ELISA. As
shown in Fig. 1, the ELISA results
revealed a 5.2-fold and 7-fold increase in the IL-2 and IL-10 serum
levels, respectively, when compared with the healthy controls.
These results indicated that the IL-2 and IL-10 expression levels
were altered in the GD patients.
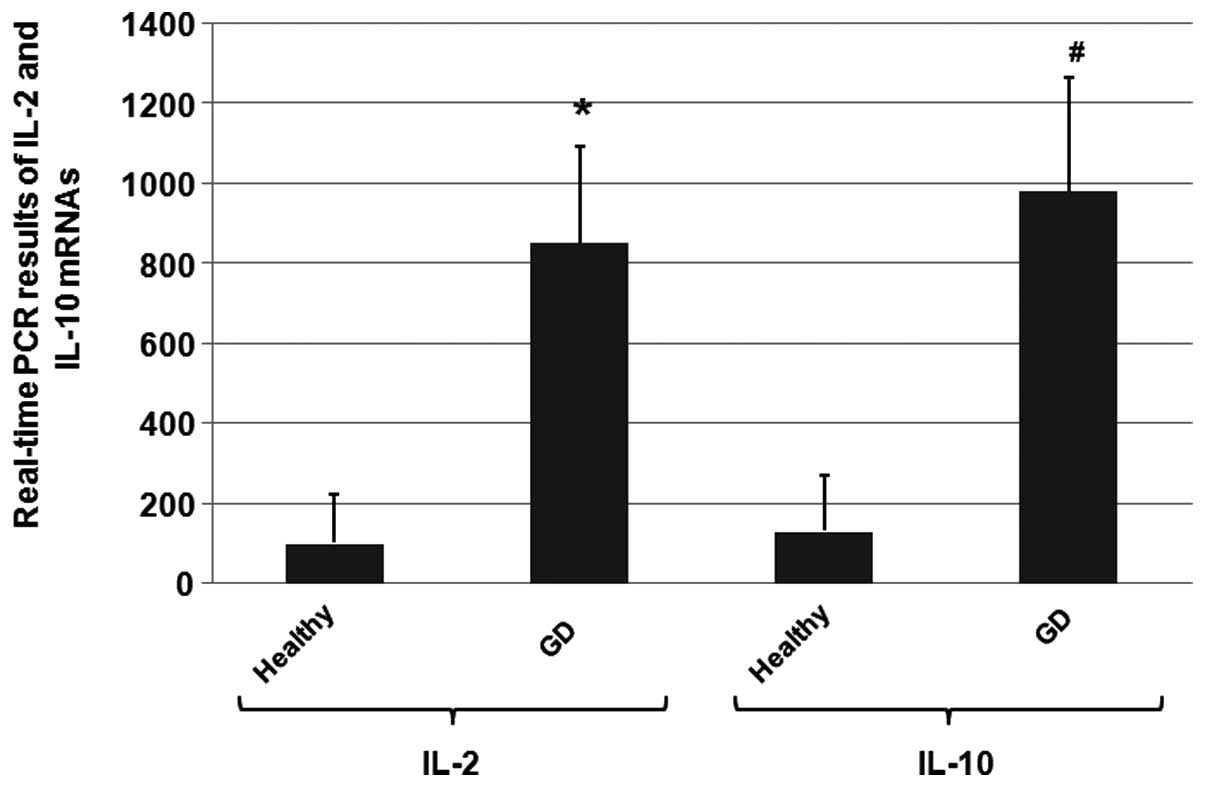
Upregulation of IL-2 and IL-10 mRNA
expression levels in GD patients
To determine whether the increased IL-2 and IL-10
serum levels resulted from the upregulation of IL-2 and IL-10 mRNA
expression levels, the mRNA transcript levels in all the patients
and healthy controls were determined using RT-qPCR. The mean mRNA
expression levels of IL-2 and IL-10 of the healthy individuals were
assigned a value of 100.
As shown in Fig. 2,
the mean mRNA expression levels of IL-2 and IL-10 in the blood
samples of the GD patients were approximately 8-fold and 10-fold
higher compared with the levels in the healthy control group
(P<0.05). These results indicated that the IL-2 and IL-10 mRNA
expression levels in GD patients were significantly increased when
compared with the healthy individuals.
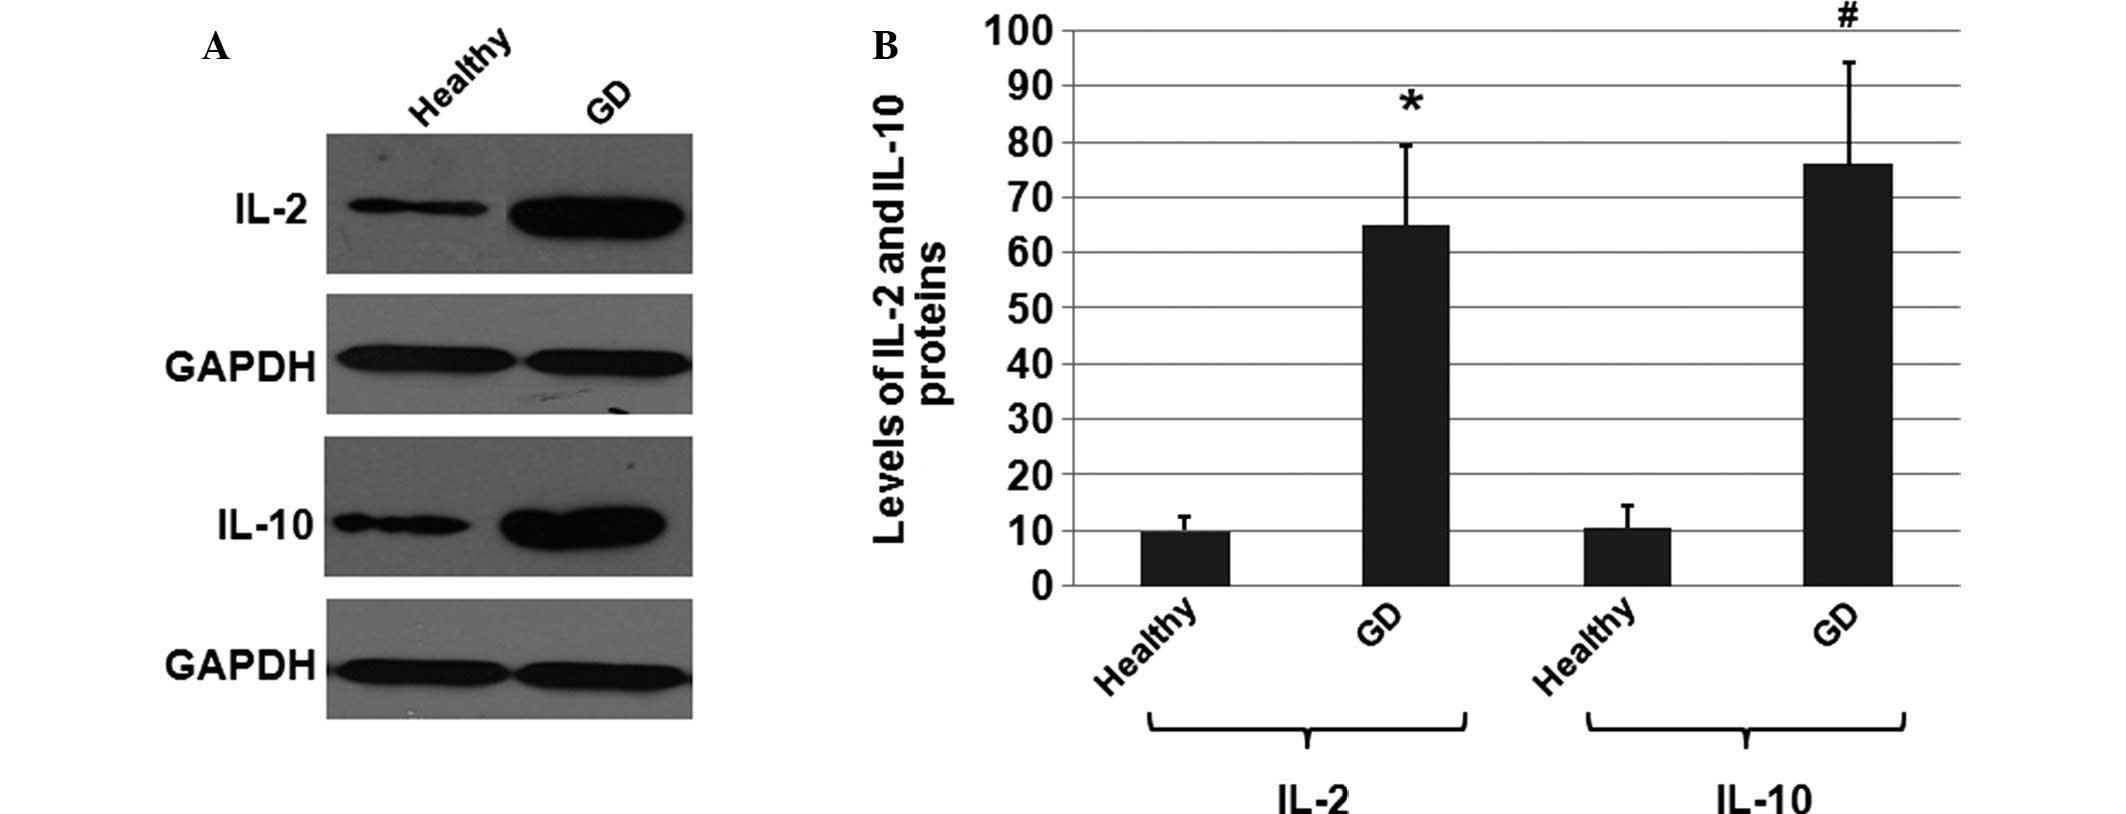
Increased protein expression levels of
IL-2 and IL-10 in the GD patients
To investigate whether the protein expression levels
of IL-2 and IL-10 were altered in the GD patients when compared
with the healthy individuals, total proteins were extracted from
the healthy individual and GD patient samples. The IL-2 and IL-10
protein expression levels were determined using western blot
analysis, with the cellular GAPDH protein used as the loading
control. The mean normalized optical density (OD) values of the
IL-2 and IL-10 protein bands relative to the OD values of the GAPDH
bands from the same individual were calculated and subjected to
statistical analysis (Fig.
3A).
Representative western blots from healthy
individuals and GD patients are shown in Fig. 3A. As shown in Fig. 3B, the mean protein expression
levels of IL-2 and IL-10 in GD patients were significantly higher
compared with the levels in the healthy controls. A 6.4-fold
increase was detected in IL-2 expression, while a 7.6-fold increase
was detected in IL-10 expression, compared with the control group
expression levels. These results indicated that the expression
levels of the IL-2 and IL-10 proteins were significantly increased
in the GD patients when compared with the healthy individuals.
IL-2 -330T/G and IL-10 -1082A/G
polymorphisms may be risk factors for GD in the Asian
population
Polymorphisms at the −330 locus of the IL-2 promoter
and the −1082 locus of the IL-10 promoter were analyzed in the GD
patients and healthy controls. The allele frequency distribution of
IL-2 at the −330 locus, and of IL-10 at the −1082 locus was in
Hardy-Weinberg equilibrium (P>0.05; data not shown).
Subsequently, putative correlations of the genotype distribution of
the −330 IL-2 and −1082 IL-10 promoter loci with the occurrence
rates of GD were investigated. As demonstrated in Table III, the increased number of GG
single nucleotide polymorphisms (SNPs) in the GD group was detected
in the two loci. These results indicated that the relatively high
rates of homozygous GG SNPs on the alleles may be associated with
the incidence of GD.
| Table IIIAssociation of SNPs at the -330 locus
of IL-2 promoter and the -1082 locus of IL-10 promoter with the
risk of GD development. |
Table III
Association of SNPs at the -330 locus
of IL-2 promoter and the -1082 locus of IL-10 promoter with the
risk of GD development.
| Sites | SNPs | Healthy individuals,
(n=138), n (%) | GD patients, (n=118),
n (%) | P-valuea | OR (95% CI) |
|---|
| IL-2 | TT | 114 (82.6) | 92 (77.9) | | |
| -330 | TG | 24 (17.4) | 18 (15.4) | 0.059 | 1.603
(0.242–0.671) |
| GG | 0 (0) | 8 (6.7) | 0.043 | 1.104
(1.821–2.882) |
| IL-10 | AA | 87 (63.0) | 74 (62.7) | | |
| -1082 | AG | 49 (35.5) | 37 (31.3) | 0.051 | 1.271
(0.562–3.269) |
| GG | 2 (1.5) | 7 (5.9) | 0.028 | 1.214
(1.321–3.645) |
Discussion
GD, an autoimmune disorder, is the cause of the
majority of hyperthyroidism cases. Previous studies have
demonstrated that GD is a genetically complex disease (19,20).
Genetic predisposition to GD is based on multiple genes with
limited individual effects. In the present study, variations in the
expression levels of IL-2 and IL-10 between the healthy control and
GD patient groups were investigated.
The ELISA results of the current study indicated
that the IL-2 and IL-10 serum levels of the GD patients were
increased by ~5.2-fold and ~7-fold, respectively, compared with the
levels in the healthy controls. These observations were supported
by the RT-qPCR and western blot results. The RT-qPCR results
indicated that the IL-2 and IL-10 mRNA expression levels were
increased in GD patients when compared to the healthy controls. In
addition, the western blot analysis results demonstrated that the
protein expression levels of IL-2 and IL-10 were significantly
increased in the GD patients. These results indicated that the
development of GD is associated with the alterations in the IL-2
and IL-10 gene expression levels.
Alterations in gene expression levels frequently
result from alterations in gene promoter activities (21). The RFLP results of the present
study indicated that an increased number of GG SNPs in the GD group
was identified in the −330 locus of the IL-2 promoter and the −1082
locus of the IL-10 promoter. These results indicated that the
relatively high rates of homozygous GG SNPs on the alleles may be
associated with the development of GD. Therefore, SNPs may serve as
biomarkers in GD patients, at least in the Asian population.
Recently, IL-16 polymorphism has been demonstrated
to be associated with GD in the Taiwanese population (22), using sliding-window haplotype
analysis. The authors demonstrated that the most significant
haplotype was provided by the 6-SNP haplotype window, including
rs7182786, rs8028364, rs12907134, rs4128767, rs4072111 and
rs8031107, indicating that IL-16 may be a genetic marker for the
diagnosis and prognosis of GD in the Taiwanese population (22). In addition, an association between
IL-10 polymorphism and Graves’ disease has been reported in the
Turkish population (23). A recent
meta-analysis of 11 case control studies indicated that
polymorphisms at the −511 locus of IL-1B are associated with the
risk of GD development in Caucasian and Asian individuals in a
homozygotic model (24). SNPs of
the IL-21 gene have been found to be associated with development of
GD (25), while individuals with
SNPs at the common IL-21 and IL-21R genes may present a higher risk
of developing Hashimoto’s thyroiditis (25). However, interleukin gene
polymorphisms are not only associated with GD. The association
between interleukin gene polymorphisms and other diseases have also
been investigated. For instance, a previous study demonstrated that
the −590 C/T polymorphism of IL-4 promoter is associated with
genetic susceptibility to rheumatoid arthritis (26). The results of the present study
facilitate the understanding of the association between interleukin
gene polymorphisms and the diagnosis and prognosis of GD.
In conclusion, the results of the present study
demonstrated that patients with GD have significantly higher levels
of IL-2 and IL-10, and significantly higher rates of homozygous GG
SNPs (IL-2 -330T/G and IL-10 −1082A/G polymorphisms). These
findings suggest that IL-2 and IL-10 may be potential biomarkers
for the incidence of GD.
Acknowledgements
This study was supported by grants from the Shandong
Natural Science Foundation of China (no. ZH2011HM067) and the
Medical and Health Science Technology Development Program of
Shandong Institute (nos. 2011HW023 and 2013WS0075).
References
|
1
|
Menconi F, Marcocci C and Marinò M:
Diagnosis and classification of Graves’ disease. Autoimmun Rev.
13:398–402. 2014. View Article : Google Scholar : PubMed/NCBI
|
|
2
|
Park J, Kim JG, Park SP and Lee HW:
Asymmetric chorea as presenting symptom in Graves’ disease. Neurol
Sci. 33:343–345. 2012. View Article : Google Scholar
|
|
3
|
Mohaseb K, Linder M, Rootman J, Wilkins
GE, Schechter MT, Dolman PJ and Singer J: Development and
validation of a patient symptom questionnaire to facilitate early
diagnosis of thyroid-associated orbitopathy in graves’ disease.
Orbit. 27:419–425. 2008. View Article : Google Scholar
|
|
4
|
Imrie H, Vaidya B, Perros P, et al:
Evidence for Graves’ disease susceptibility locus at chromosome
Xp11 in a United Kingdom population. J Clin Endocrinol Metab.
86:626–630. 2001.PubMed/NCBI
|
|
5
|
Ngo ST, Stern FJ and McCombe PA: Gender
differences in autoimmune disease. Front Neuroendocrinol.
35:347–369. 2014. View Article : Google Scholar : PubMed/NCBI
|
|
6
|
Rioux JD and Abbas AK: Paths to
understanding the genetic basis of autoimmune disease. Nature.
435:584–589. 2005. View Article : Google Scholar : PubMed/NCBI
|
|
7
|
Prummel MF, Strieder T and Wiersinga WM:
The environment and autoimmune thyroid diseases. Eur J Endocrinol.
150:605–618. 2004. View Article : Google Scholar : PubMed/NCBI
|
|
8
|
Sorrentino R: Genetics of autoimmunity: an
update. Immunol Lett. 158:116–119. 2014. View Article : Google Scholar
|
|
9
|
Bordignon M, Bargagli E and Agostini Et Al
C: TLR7 Gln11Leu single nucleotide polymorphism in patients with
sarcoidosis. Sarcoidosis Vasc Diffuse Lung Dis. 30:157–161.
2013.PubMed/NCBI
|
|
10
|
Esfahanian F, Naimi E, Doroodgar F and
Jadali Z: Th1/Th2 cytokines in patients with Graves’ disease with
or without ophthalmopathy. Iran J Allergy Asthma Immunol.
12:168–175. 2013.PubMed/NCBI
|
|
11
|
Qin Q, Liu P, Liu L, et al: The increased
but non-predominant expression of Th17- and Th1-specific cytokines
in Hashimoto’s thyroiditis but not in Graves’ disease. Braz J Med
Biol Res. 45:1202–1208. 2012. View Article : Google Scholar : PubMed/NCBI
|
|
12
|
Antonelli A, Ferrari SM, Frascerra S, et
al: Peroxisome proliferator-activated receptor α agonists modulate
Th1 and Th2 chemokine secretion in normal thyrocytes and Graves’
disease. Exp Cell Res. 317:1527–1533. 2011. View Article : Google Scholar : PubMed/NCBI
|
|
13
|
Ribot JC, Ribeiro ST, Correia DV, Sousa AE
and Silva-Santos B: Human γδ thymocytes are functionally immature
and differentiate into cytotoxic type 1 effector T cells upon
IL-2/IL-15 signaling. J Immunol. 192:2237–2243. 2014. View Article : Google Scholar : PubMed/NCBI
|
|
14
|
Singh S, Singh U and Pandey SS: Serum
concentration of IL-6, IL-2, TNF-α, and IFNγ in Vitiligo patients.
Indian J Dermatol. 57:12–14. 2012. View Article : Google Scholar : PubMed/NCBI
|
|
15
|
Das S, Banerjee S, Majumder S, et al:
Immune subversion by Mycobacterium tuberculosis through CCR5
mediated signaling: involvement of IL-10. PLoS One. 9:e924772014.
View Article : Google Scholar : PubMed/NCBI
|
|
16
|
Koh SJ, Kim JM, Kim IK, Ko SH and Kim JS:
Anti-inflammatory mechanism of metformin and its effects in
intestinal inflammation and colitis-associated colon cancer. J
Gastroenterol Hepatol. 29:502–510. 2014. View Article : Google Scholar : PubMed/NCBI
|
|
17
|
Ueki I, Abiru N, Kawagoe K and Nagayama Y:
Interleukin 10 deficiency attenuates induction of anti-TSH receptor
antibodies and hyperthyroidism in a mouse Graves’ model. J
Endocrinol. 209:353–357. 2011. View Article : Google Scholar : PubMed/NCBI
|
|
18
|
Yan JL, Wu YM, Zhao FJ and Liu SQ: The
expression of the recombinant protein for gpd gene from Treponema
Pallidum. Zhong Hua Pi Fu Ke Za Zhi. 40:301–302. 2007.(In
Chinese).
|
|
19
|
Stenszky V, Kozma L, Balazs C, Rochlitz S,
Bear JC and Farid NR: The genetics of Graves’ disease: HLA and
disease susceptibility. J Clin Endocrinol Metab. 61:735–740. 1985.
View Article : Google Scholar : PubMed/NCBI
|
|
20
|
Farid NR: Understanding the genetics of
autoimmune thyroid disease - still an illusive goal. J Clin
Endocrinol Metab. 74:495A–495B. 1992. View Article : Google Scholar
|
|
21
|
Świątkowska-Stodulska R, Kitowska A,
Skibowska-Bielińska A, Wiśniewski P and Sworczak K: Hageman factor
C46T promoter gene polymorphism in patients with hypercortisolism.
Horm Metab Res. 46:510–514. 2014. View Article : Google Scholar : PubMed/NCBI
|
|
22
|
Tsai KH, Chang CY, Tsai FJ, Lin HJ, Yang
YS, Lim YP, Liao CC and Wan L: Association of interleukin-16
polymorphisms with Graves’ disease in a Taiwanese population. Chin
J Physiol. 57:69–75. 2014.PubMed/NCBI
|
|
23
|
Kutluturk F, Yarman S, Sarvan FO and Kekik
C: Association of cytokine gene polymorphisms (IL6, IL10, TNF-α,
TGF-β and IFN-γ) and Graves’ disease in Turkish population. Endocr
Metab Immune Disord Drug Targets. 13:163–167. 2013. View Article : Google Scholar : PubMed/NCBI
|
|
24
|
Chen ML, Liao N, Zhao H, Huang J and Xie
ZF: Association between the IL1B (−511), IL1B (+3954), IL1RN (VNTR)
polymorphisms and Graves’ disease risk: a meta-analysis of 11
case-control studies. PLoS One. 9:e860772014. View Article : Google Scholar
|
|
25
|
Zhang J, Xiao WX, Zhu YF, et al:
Polymorphisms of interleukin-21 and interleukin-21-receptor genes
confer risk for autoimmune thyroid diseases. BMC Endocr Disord.
13:262013. View Article : Google Scholar : PubMed/NCBI
|
|
26
|
Qiu LJ, Ni J, Cen H, et al: Relationship
between the IL-4 gene promoter −590C/T (rs2243250) polymorphism and
susceptibility to autoimmune diseases: a meta-analysis. J Eur Acad
Dermatol Venereol. Mar 17–2014.(Epub ahead of print). View Article : Google Scholar
|