Introduction
In adults, nephrotic syndrome is commonly caused by
membranous nephropathy (MN), which is the second leading cause of
end-stage renal disease (ESRD) due to primary glomerulonephritis
(1). During the early stages of
MN, IgG4 targets the M-type phospholipase A2 receptor.
The IgG4 complex and/or other immune complexes are deposited on the
subepithelial area of the basement membrane (2). A previous study estimated that
one-third of MN patients develop ESRD or chronic renal failure and
eventually require a renal transplantation (3). Although clinical manifestations,
urinalysis, clinical chemistry tests and renal histopathology can
be used to diagnose glomerular diseases, a renal biopsy provides a
definitive diagnosis (4). Renal
biopsy is an invasive procedure with the potential risk of serious
complications, including hematoma, infection and arteriovenous
fistula (5). Therefore, a safer
and more effective diagnostic method is desirable. Biomarkers
represent a potentially alternative method for diagnosis.
Proteomic technologies have enabled the
identification of novel protein biomarkers (6,7).
Technologies used for the discovery of protein biomarkers for
glomerular diseases include two-dimensional (2D) gel
electrophoresis, 2D differential in-gel electrophoresis,
surface-enhanced laser desorption ionization time-of-flight (TOF)
mass spectrometry (MS) and capillary electrophoresis-MS (4). Quantitative proteomic methods are
used in the identification and quantification of proteins expressed
at a genome-wide level or in a complex mixture (8). Isobaric tags for relative and
absolute quantification (iTRAQ) is a technique developed by the
Applied Biosystems Incorporation (8). Reagents used for iTRAQ consist of a
peptide reactive group, a reporter group used in the analysis and a
molecular mass balance group. iTRAQ is used to label samples with
up to eight independent isobaric tags, which correspond to eight
unique reporter ions (mass-to-charge ratio, 113–121). Therefore,
quantitative information is obtained following integration of the
peak areas for the eight different samples (8,9).
iTRAQ has been applied in the proteomic analysis of
tissues from various diseases, including endometrial carcinoma
(10), head and neck squamous cell
carcinoma (11) and colorectal
cancer (12). However, iTRAQ
technology has been rarely used in the analysis of MN renal
tissues. In the present study, iTRAQ was used to analyze the total
protein content of renal tissues from patients with MN. The aim of
the present study was to identify a safe, alternative, diagnostic
method for MN, whilst improving the understanding of the mechanisms
underlying the pathogenesis of MN.
Subjects and methods
MN and control groups
Renal tissue was collected from six MN patients
between March and August 2011 at the Guilin 181st
Hospital (Guilin, China; Table I).
The patients were diagnosed with MN through a biopsy, had a
creatinine clearance level of ≥30 ml/min/1.73 m2 and
suffered from persistent proteinuria of >5 g/24 h, although
maximal tolerated angiotensin II was blockaded for at least four
months (13). A renal biopsy was
performed for all the patients with MN, and the results were
examined by a certified pathologist in a blind analysis (the
pathologist was unaware of the clinical and laboratory data). The
control group consisted of only four individuals with normal kidney
function and with no clinical evidence of MN, since normal renal
tissue is difficult to collect and has a short storage life
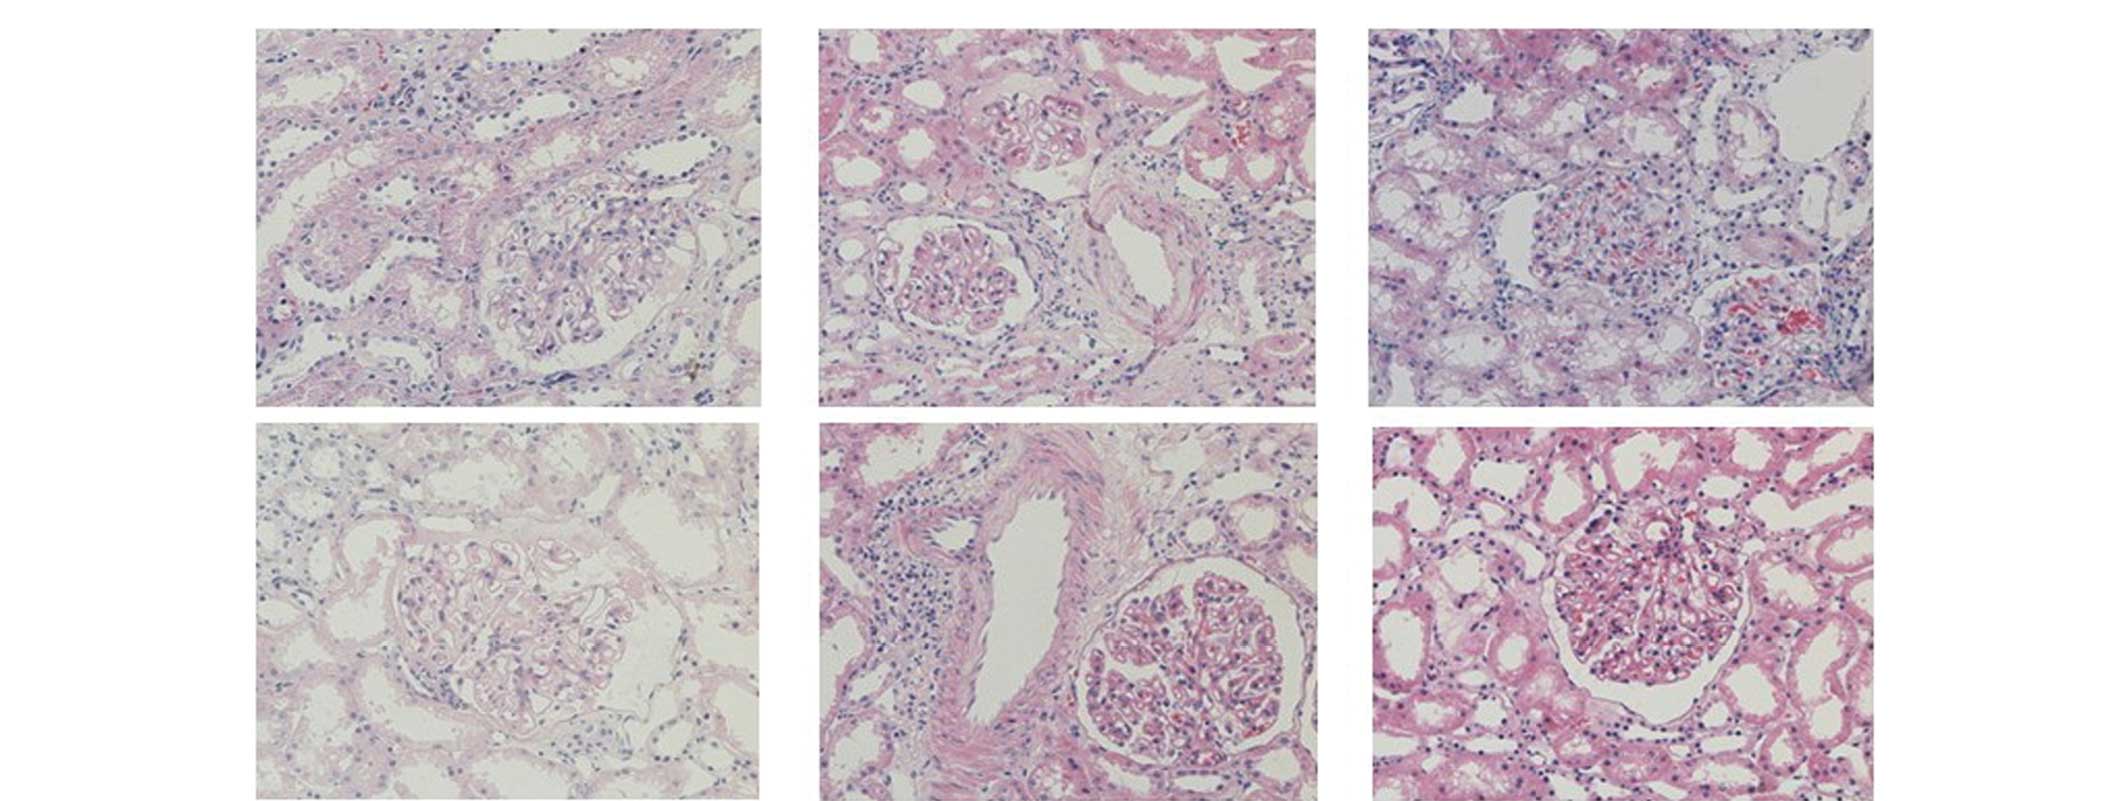
(Table I). Fig. 1 shows light photomicrographs
(magnification, 200x) of the renal tissues from the MN patients,
stained using hematoxylin-eosin and visualized under a microscopse
(Nikon Coolscope II; Nikon Corporation, Tokyo, Japan). This study
was performed according to the guidelines set forth by the Guilin
181st Hospital and abides by the Declaration of Helsinki
on ethical principles for medical research involving human
subjects. Written informed consent was obtained from all the
subjects or their guardians.
 | Table IMain clinical and biochemical
characteristics of patients with MN and the control group. |
Table I
Main clinical and biochemical
characteristics of patients with MN and the control group.
| Characteristic | MN patients | Control group |
|---|
| Male/female, n | 5/1 | 3/1 |
| Age, years | 47.17±12.17 | 39.52±17.23 |
| Blood pressure,
mmHg | 143±26/75±12 | 122±12/73±11 |
| Urinary protein
excretion, g/24 h | 6.7±3.45 | - |
| Serum creatinine,
mg/dl | 1.21±0.52 | - |
| Creatinine clearance,
ml/min | 73.54±29.75 | - |
Sample preparation
Biopsy samples were collected from the MN patients
and control group. The samples were immediately washed with 0.9%
RNase-free NaCl and briefly immersed in RNase inhibitor (Epicentre,
Madison, WI, USA), according to the manufacturer’s instructions.
The samples were stored at −80°C for subsequent analysis.
Protein extraction and
quantification
Renal tissue samples (250 mg) collected from the MN
patients and control group were ground into a fine powder in liquid
nitrogen, and supplemented with acetone. Subsequently, 10%
trichloroacetic acid in acetone was added and the samples were
incubated for 2 h at −20°C. Total protein was extracted using an
extraction buffer, consisting of 8 M urea, 4% CHAPS, 40 mM Tris, 1
mM phenylmethylsulfonyl fluoride, 2 mM EDTA, 10 mM dithiothreitol
and 0.5–2% isotonic glucose phosphate buffer (pH 8.5). Next, the
samples were subjected to centrifugation at 40,000 × g for 1 h at
10°C. The protein concentration of the supernatant was determined
using a bicinchoninic acid assay kit (Pierce Biotechnology, Inc.,
Rockford, IL, USA), according to the manufacturer’s
instructions.
iTRAQ reagent labeling, strong cation
exchange (SCX) fractionation and tandem mass spectrometry
(MS/MS)
Total protein in each group was pooled, blocked,
digested and labeled according to the iTRAQ protocol (Applied
Biosystems Life Technologies, Foster City, CA, USA). The iTRAQ tags
were as follows: Healthy control, iTRAQ 113; MN, iTRAQ 119. The
labeled digests were subsequently combined into one sample
mixture.
Multidimensional liquid chromatography was performed
to separate the tryptic peptides prior to MS. The combined samples
were separated into ten SCX fractions using a 3.5-μm particle size
column (35×0.3 mm, 300 Å; Zorbax Bio-SCX Series II; Agilent
Technologies, Inc., Santa Clara, CA, USA) with a potassium formate
gradient in 25% acetonitrile. The peptide fractions were further
separated on a Tempo™ liquid chromatography nanoflow and
matrix-assisted laser desorption/ionization (MALDI) spotting system
(Applied Biosystems), equipped with a reversed-phase Magic C18Aq
column (Applied Biosystems). Each chromatography run yielded ~380
MALDI spots on a stainless steel MALDI target plate (Applied
Biosystems) (14).
A 4800 Plus MALDI TOF/TOF™ analyzer (Applied
Biosystems Life Technologies) was used for MS data acquisition.
Signal-to-noise ratios of ≥40 were required for MS/MS. Mass spectra
from 500 laser shots were acquired for each spot. The MS/MS data
from the ten SCX fractions were combined and analyzed using the
Paragon Algorithm search engine and Human v3.62 (European
Bioinformatics Institute, http://www.ebi.ac) (14).
Statistical and Gene Ontology (GO)
analyses
Proteins yielding tryptic peptides with average
reporter ion ratios of ≥1.5 and ≤0.67 were classified as
upregulated and downregulated, respectively. The GO database
annotates selected proteins according to their molecular function
(MF), cellular component (CC) and biological process (BP). To
investigate the functions of the identified proteins, the online
tool, Web Gene Ontology Annotation Plotting (http://wego.genomics.org.cn/), was used.
Results
Proteome of renal tissue
Using a peptide of >1 and a confidence interval
of >95% (P<0.05) as the cutoff values for protein
identification, a total of 1,903 proteins were identified and
quantified from the collected renal tissues. Of the 423 proteins
with >1.5-fold differences, 202 proteins were upregulated, while
221 proteins were downregulated. The beta-2-microglobulin level of
MN was 1.56 times higher compared with the control group.
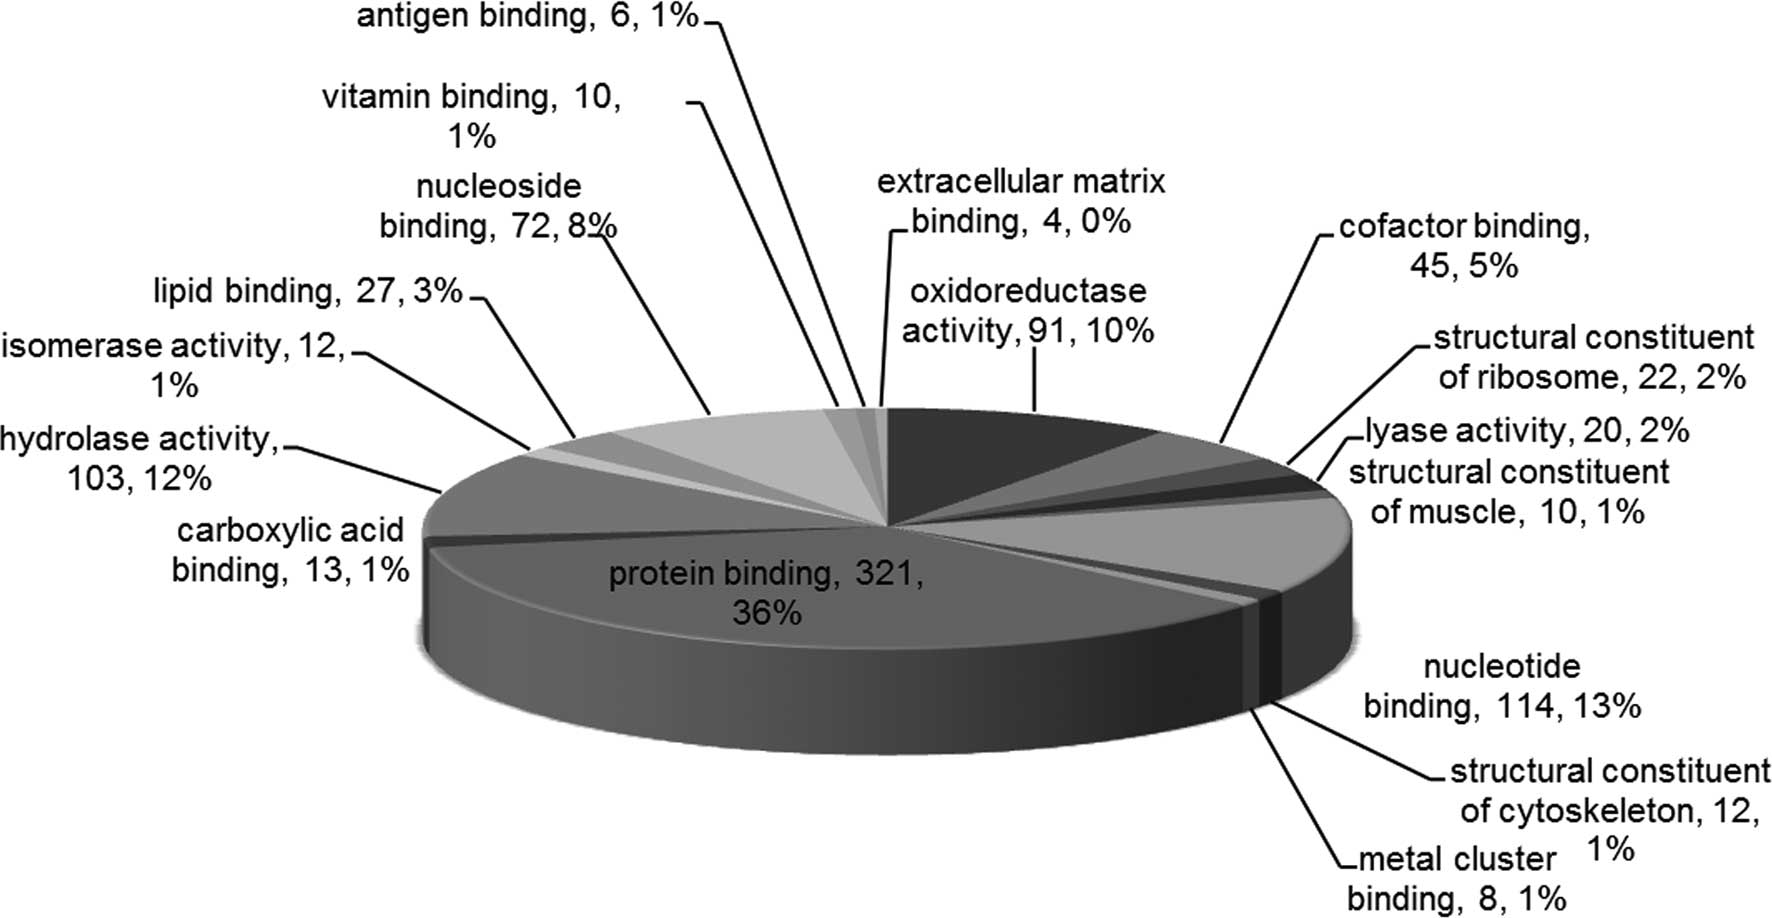
All the proteins were associated with the GO
categories, MF, CC and BP. The most enriched MF terms included
‘protein binding’, ‘nucleotide binding’, ‘hydrolase activity’,
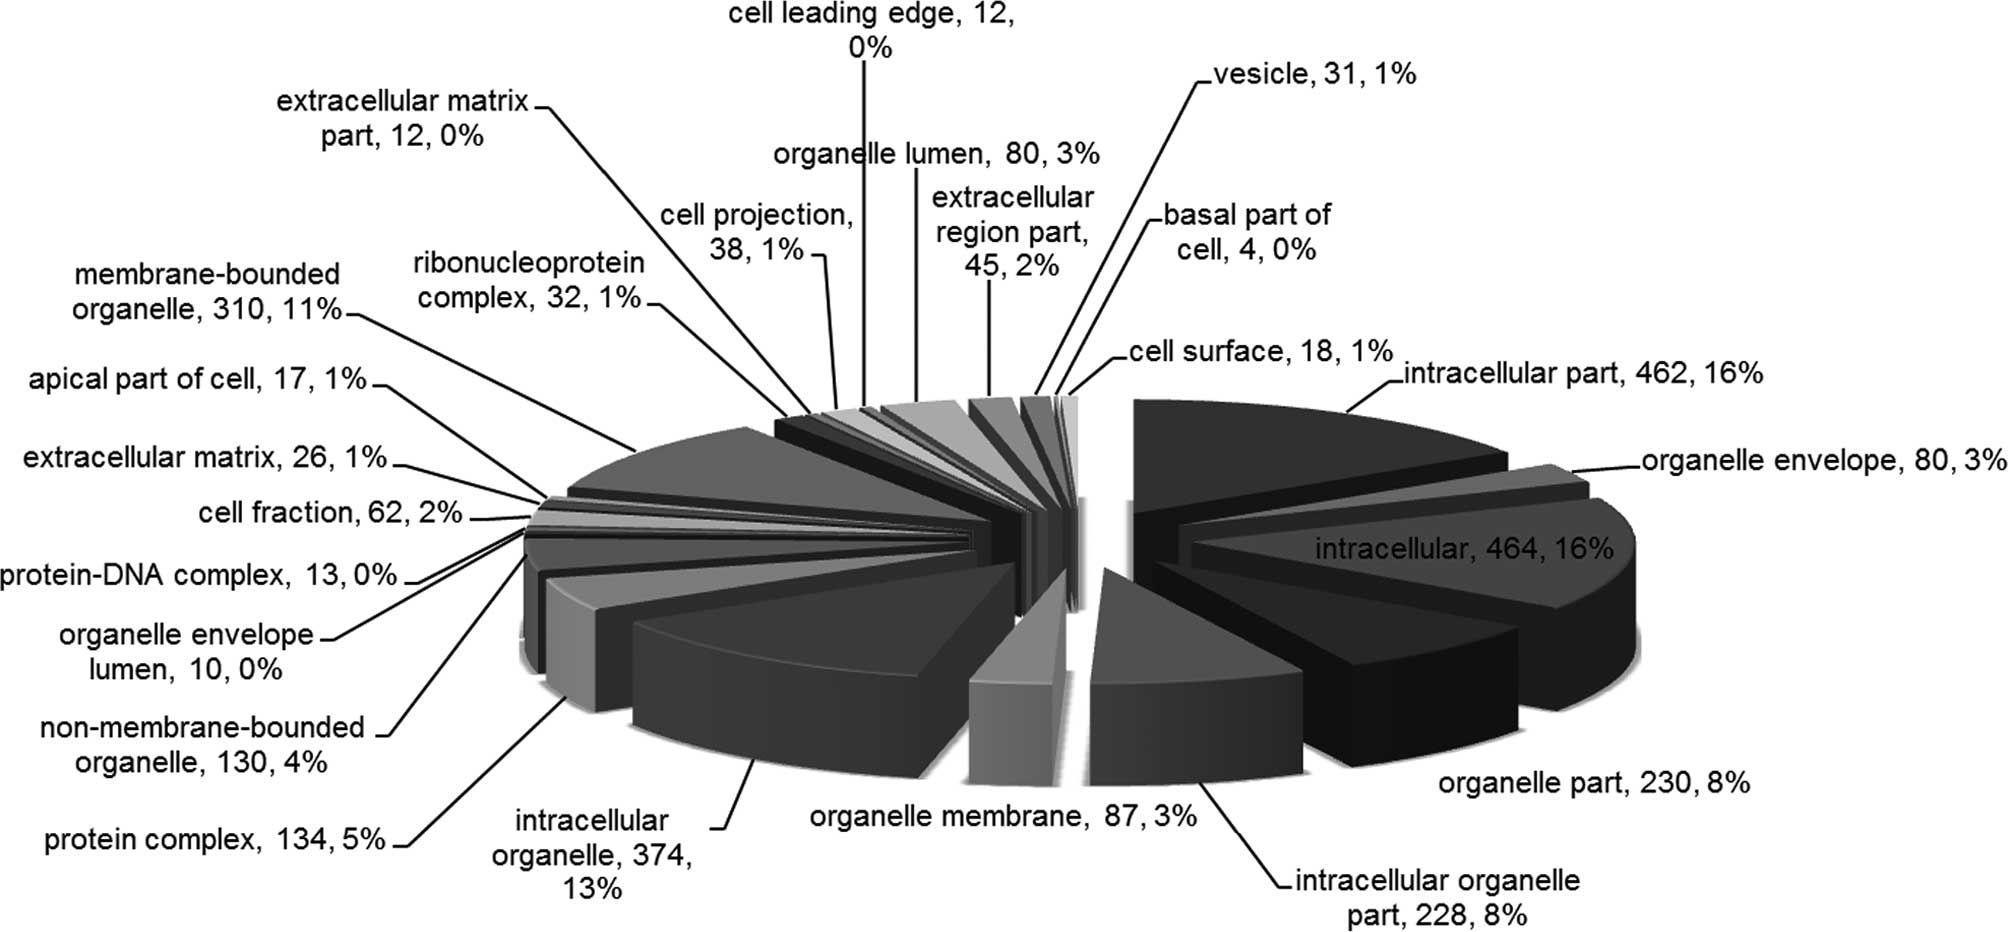
‘oxidoreductase activity’ and ‘nucleoside binding’ (Fig. 2). In addition, the most enriched CC
terms included ‘intracellular’, ‘intracellular part’,
‘intracellular organelle’, ‘membrane-bounded organelle’ and
‘organelle part’ (Fig. 3).
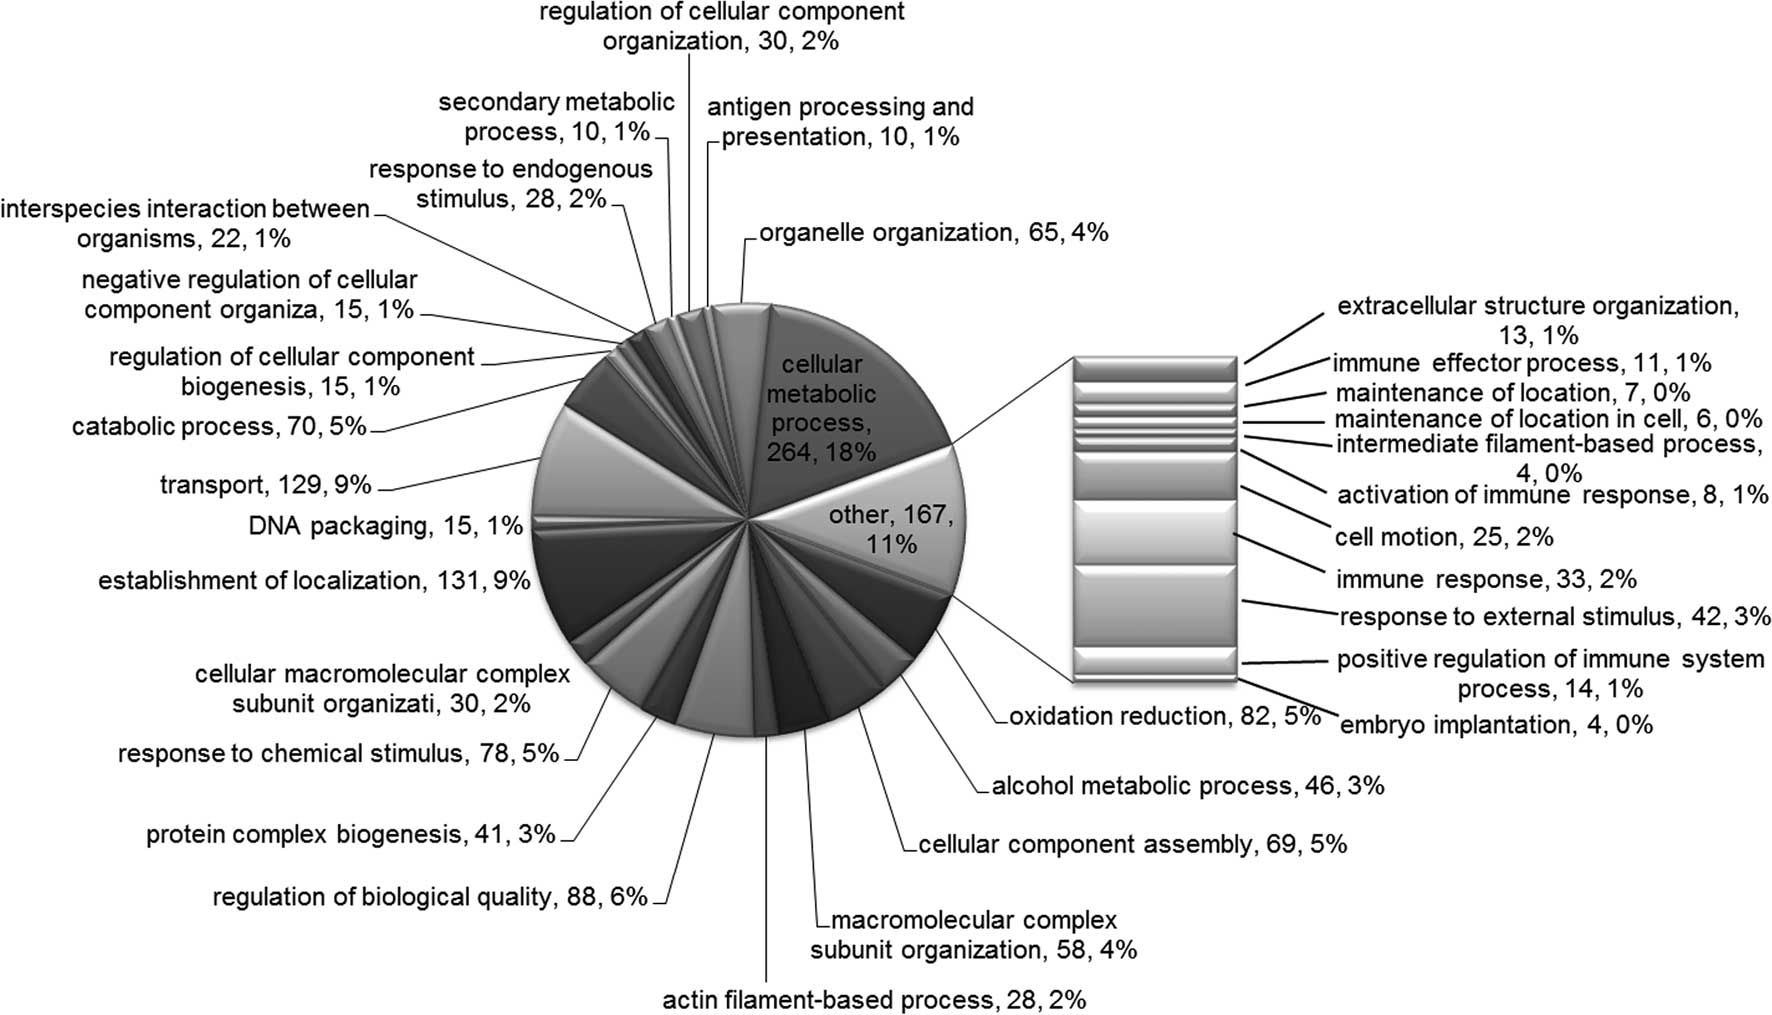
Finally, the most enriched BP terms included ‘cellular metabolic
process’, ‘establishment of localization’, ‘transport’, ‘regulation
of biological quality’ and ‘oxidation reduction’ (Fig. 4).
The upregulated and downregulated proteins belonging
to the terms ‘immune response’, ‘immune effector process’,
‘activation of immune response’ and ‘positive regulation of immune
system process’ are shown in Tables
II and III.
| Table IIUpregulated and downregulated
proteins, belonging to the terms ‘immune response’, ‘immune
effector process’, ‘activation of immune response’ and ‘positive
regulation of immune system process’. |
Table II
Upregulated and downregulated
proteins, belonging to the terms ‘immune response’, ‘immune
effector process’, ‘activation of immune response’ and ‘positive
regulation of immune system process’.
| Uniprot accession
no. | Protein name
(Organism species = Homo sapiens) | Peptides (95%
CI) | iTRAQ 119:113 |
|---|
| Upregulated |
| Q9NZP8 | Complement C1r
subcomponent-like protein (GN, C1RL; PE, 1; SV, 2) | 1 | 2.3562 |
| P07437 | Tubulin β chain (GN,
TUBB; PE, 1; SV, 2) | 42 | 2.0528 |
| P04233 | HLA class II
histocompatibility antigen γ chain (GN, CD74; PE, 1; SV, 3) | 1 | 2.0146 |
| P31146 | Coronin-1A (GN,
CORO1A; PE, 1; SV, 4) | 5 | 1.5730 |
| P61769 |
β2-microglobulin (GN, B2M; PE,
1; SV, 1) | 4 | 1.5640 |
| P04264 | Keratin, type II
cytoskeletal 1 (GN, KRT1; PE, 1; SV, 6) | 46 | 1.5123 |
| P52566 | Rho GDP-dissociation
inhibitor 2 (GN, ARHGDIB; PE, 1; SV, 3) | 5 | 1.6968 |
| P01911 | HLA class II
histocompatibility antigen, DRB1-15 β chain (GN, HLA-DRB1; PE, 1;
SV, 2) | 5 | 1.7591 |
| P61769 |
β2-microglobulin (GN, B2M; PE,
1; SV, 1) | 4 | 1.5640 |
| P13746 | HLA class I
histocompatibility antigen, A-11 α chain (GN, HLA-A; PE, 1; SV,
1) | 12 | 1.8167 |
| Q9TQE0 | HLA class II
histocompatibility antigen, DRB1-9 β chain (GN, HLA-DRB1; PE, 2;
SV, 1) | 7 | 1.6628 |
| P01857 | Ig γ-1 chain C region
(GN, IGHG1; PE, 1; SV, 1) | 67 | 1.5854 |
| P01594 | Ig κ chain V-I region
AU (GN, KV102; PE, 1; SV, 1) | 4 | 1.6595 |
| Q9NZ08 | Endoplasmic reticulum
aminopeptidase 1 (GN, ERAP1; PE, 1; SV, 3) | 3 | 1.7790 |
| Q96A32 | Myosin regulatory
light chain 2, skeletal muscle isoform (GN, MYLPF; PE, 2; SV,
1) | 4 | 2.9194 |
| P32455 | Interferon-induced
guanylate-binding protein 1 (GN, GBP1; PE, 1; SV, 1) | 10 | 1.5951 |
| P30481 | HLA class I
histocompatibility antigen, B-44 α chain (GN, HLA-B; PE, 1; SV,
1) | 4 | 2.5680 |
| P02794 | Ferritin heavy chain
(GN, FTH1; PE, 1; SV, 2) | 6 | 2.0462 |
| P19320-2 | Isoform VCAM-6D of
vascular cell adhesion protein 1 (GN, VCAM1) | 3 | 1.6794 |
| Downregulated |
| P04003 | C4b-binding protein α
chain (GN, C4BPA; PE, 1; SV, 2) | 1 | 0.5745 |
| P10809 | 60 kDa heat shock
protein, mitochondrial (GN, HSPD1; PE, 1; SV, 2) | 47 | 0.5023 |
| Q07021 | Complement component
1 Q subcomponent-binding protein, mitochondrial (GN, C1QBP; PE, 1;
SV, 1) | 9 | 0.6528 |
| Table IIIProteins belonging to the specific
biological process terms of the Gene Ontology enrichment
analysis. |
Table III
Proteins belonging to the specific
biological process terms of the Gene Ontology enrichment
analysis.
| Term | Uniport accession
no. |
|---|
| Immune response | P01031, P07437,
P01876, P40306, P04003, Q9NZP8, P52566, Q07021, P30499, P01911,
P61769, P01834, P13746, P28062, Q9TQE0, P01857, P04264, P63104,
P31146, P01594, P02788, Q9Y3Z3, Q9NZ08, Q96A32, P04433, P01903,
P04233, P10809, P05156, P32455, P30481, P13796, P02794 |
| Immune effector
process | P01903, P01031,
P07437, P04233, P04003, P05156, P10809, Q9NZP8, Q9Y3Z3, P04264,
P63104 |
| Activation of immune
response | P01031, P04003,
P05156, P10809, Q9NZP8, P28482, P04264, P04216 |
| Positive regulation
of immune system process | P19320, P01031,
P31146, P04003, Q9NZP8, P04216, P01903, P61769, P04233, P05156,
P10809, P28482, P04264, Q08722 |
Discussion
The development of iTRAQ has enhanced the analysis
of differential protein expression. Protein quantification using
iTRAQ has been proposed as a suitable method for biomarker
detection, since it permits parallel comparisons of protein
abundance by measuring the peak intensities of reporter ions
released from iTRAQ-tagged peptides. In the present study, iTRAQ
technology and GO analysis were employed to perform quantitative
proteomic analysis of plasma in MN tissue. A general proteome
database was constructed for the renal tissue proteome, which has
not been previously reported.
The use of GO proteomic analysis to investigate the
observed changes was a necessary first step towards understanding
the pathogenesis of MN. Differential proteins were assigned to the
MF, CC and BP terms (Fig.
2–4), and GO enrichment
analysis for the BP domain (Table
III) revealed clusters of proteins for the following terms:
‘Immune response’, ‘immune effector process’, ‘activation of immune
response’ and ‘positive regulation of immune system process’.
Therefore, cellular and humoral immune mechanisms may play a major
role in the pathogenesis of MN. By contrast, the subsequent
progression to renal failure appears to be determined primarily by
cell-mediated immunity. T-helper 2 (Th2) cells secrete a number of
cytokines, including interleukin-4, -5, -10 and -13, which trigger
B-cell activation and immunoglobulin synthesis. A previous study
revealed that a predominance of Th2 cells may exist in MN patients,
as shown by the presence of IgG, particularly IgG4 (15). This predominance complements
deposits in the glomeruli and is a subclass of the type-2 immune
response (15). B cell epitope
spreading is a process whereby the primary immune response against
the dominant initiating epitope further extends to other epitopes,
either within the same molecule or among different molecules. This
phenomenon may be relevant to the pathogenesis of membranous
disease (16). Mesangial cells may
contribute to the derangements occurring in MN, which have features
of immune effector cells (17).
Beyond the observed upregulation or downregulation
of protein expression, the proteins listed in Table II provide evidence that specific
proteins in the kidney tissue may play an important role in MN.
These results may facilitate the analysis of the role of these
proteins in MN and support the proteomic study of the kidney
tissue. A number of the identified proteins were mapped to the GO
terms, ‘immune response’, ‘immune effector process’, ‘activation of
immune response’ and ‘positive regulation of immune system
process’. MN is considered to be an autoimmune disease,
characterized by membrane-like thickening due to the accumulation
of immune deposits on the outer glomerular basement membrane
(16).
β2-microglobulin is a highly accurate and
specific prognosis predictor; therefore, this parameter should be
evaluated to avoid unnecessary immunosuppressive therapy (18). A previous retrospective study
indicated that the urinary levels of β2-microglobulin
and IgG are useful predictors of renal insufficiency in patients
with MN (19). In the present
study, β2-microglobulin was found to be highly expressed
in the kidney tissues of MN patients (1.56 times higher compared
with the control group), and was associated with the GO terms,
‘immune response’ and ‘positive regulation of immune system
process’.
In conclusion, iTRAQ was used as a new strategy for
proteomic analysis, and 1,903 proteins were found to be
differentially expressed in the kidney tissues of MN patients when
compared with the control group. GO enrichment analysis revealed
that the differentially expressed proteins were primarily mapped to
the GO terms, ‘immune response’, ‘immune effector process’,
‘activation of immune response’ and ‘positive regulation of immune
system process’. The identified proteins may be associated with the
pathogenesis of MN; thus, may be candidate biomarkers for the
disease. However, these proteins require further verification.
Acknowledgements
The authors thank the patients and healthy
volunteers who participated in the study, and the members of staff
for their assistance. This study was supported by the Planned
Mission Statement about Construction Projects of Guangxi Science
and Technology Infrastructure (Key Laboratory; no. 11-031-33), the
Guangxi Key Laboratory Construction Project Planning Program (no.
12-071-32) and the Guangxi Natural Science Foundation of China
(2012; no. GXNSFDA053017).
References
|
1
|
Papasotiriou M, Kalliakmani P, Huang L, et
al: Does treatment with corticosteroids and cyclosporine reduce
transglutaminase type 2 expression in the renal tissue of patients
with membranous nephropathy? Nephron Clin Pract. 121:c60–c67. 2012.
View Article : Google Scholar : PubMed/NCBI
|
|
2
|
Beck LH Jr, Bonegio RG, Lambeau G, et al:
M-type phospholipase A2 receptor as target antigen in idiopathic
membranous nephropathy. N Engl J Med. 361:11–21. 2009. View Article : Google Scholar : PubMed/NCBI
|
|
3
|
Ngai HH, Sit WH, Jiang PP, et al: Serial
changes in urinary proteome profile of membranous nephropathy:
implications for pathophysiology and biomarker discovery. J
Proteome Res. 5:3038–3047. 2006. View Article : Google Scholar : PubMed/NCBI
|
|
4
|
Thongboonkerd V: Biomarker discovery in
glomerular diseases using urinary proteomics. Proteomics Clin Appl.
2:1413–1421. 2008. View Article : Google Scholar : PubMed/NCBI
|
|
5
|
Whittier WL and Korbet SM: Renal biopsy:
update. Curr Opin Nephrol Hypertens. 13:661–665. 2004. View Article : Google Scholar : PubMed/NCBI
|
|
6
|
Veenstra TD: Global and targeted
quantitative proteomics for biomarker discovery. J Chromatogr B
Analyt Technol Biomed Life Sci. 847:3–11. 2007. View Article : Google Scholar
|
|
7
|
Duncan MW and Hunsucker SW: Proteomics as
a tool for clinically relevant biomarker discovery and validation.
Exp Biol Med (Maywood). 230:808–817. 2005.
|
|
8
|
Sun C, Song C, Ma Z, et al: Periostin
identified as a potential biomarker of prostate cancer by
iTRAQ-proteomics analysis of prostate biopsy. Proteome Sci.
9:222011. View Article : Google Scholar : PubMed/NCBI
|
|
9
|
Sui W, Tang D, Zou G, et al: Differential
proteomic analysis of renal tissue in lupus nephritis using iTRAQ
reagent technology. Rheumatol Int. 32:3537–3543. 2012. View Article : Google Scholar
|
|
10
|
DeSouza L, Diehl G, Rodrigues MJ, et al:
Search for cancer markers from endometrial tissues using
differentially labeled tags iTRAQ and cICAT with multidimensional
liquid chromatography and tandem mass spectrometry. J Proteome Res.
4:377–386. 2005. View Article : Google Scholar : PubMed/NCBI
|
|
11
|
Ralhan R, Desouza LV, Matta A, et al:
Discovery and verification of head-and-neck cancer biomarkers by
differential protein expression analysis using iTRAQ labeling,
multidimensional liquid chromatography, and tandem mass
spectrometry. Mol Cell Proteomics. 7:1162–1173. 2008. View Article : Google Scholar : PubMed/NCBI
|
|
12
|
Chen JS, Chen KT, Fan CW, et al:
Comparison of membrane fraction proteomic profiles of normal and
cancerous human colorectal tissues with gel-assisted digestion and
iTRAQ labeling mass spectrometry. FEBS J. 277:3028–3038. 2010.
View Article : Google Scholar : PubMed/NCBI
|
|
13
|
Irazabal MV, Eirin A, Lieske J, et al:
Low- and high-molecular-weight urinary proteins as predictors of
response to rituximab in patients with membranous nephropathy: a
prospective study. Nephrol Dial Transplant. 28:137–146. 2013.
View Article : Google Scholar :
|
|
14
|
Wang L, Dai Y, Qi S, et al: Comparative
proteome analysis of peripheral blood mononuclear cells in systemic
lupus erythematosus with iTRAQ quantitative proteomics. Rheumatol
Int. 32:585–593. 2012. View Article : Google Scholar
|
|
15
|
Hirayama K, Ebihara I, Yamamoto S, et al:
Predominance of type-2 immune response in idiopathic membranous
nephropathy. Cytoplasmic cytokine analysis. Nephron. 91:255–261.
2002. View Article : Google Scholar : PubMed/NCBI
|
|
16
|
Ronco P and Debiec H: Antigen
identification in membranous nephropathy moves toward targeted
monitoring and new therapy. J Am Soc Nephrol. 21:564–569. 2010.
View Article : Google Scholar : PubMed/NCBI
|
|
17
|
Werber HI, Emancipator SN, Tykocinski ML
and Sedor JR: The interleukin 1 gene is expressed by rat glomerular
mesangial cells and is augmented in immune complex
glomerulonephritis. J Immunol. 138:3207–3212. 1987.PubMed/NCBI
|
|
18
|
Hofstra JM, Deegens JK, Willems HL and
Wetzels JF: Beta-2-microglobulin is superior to
N-acetyl-beta-glucosaminidase in predicting prognosis in idiopathic
membranous nephropathy. Nephrol Dial Transplant. 23:2546–2551.
2008. View Article : Google Scholar : PubMed/NCBI
|
|
19
|
Branten AJ, du Buf-Vereijken PW, Klasen
IS, et al: Urinary excretion of beta2-microglobulin and IgG predict
prognosis in idiopathic membranous nephropathy: a validation study.
J Am Soc Nephrol. 16:169–174. 2005. View Article : Google Scholar
|