Introduction
Peritoneal dialysis (PD) is an effective and secure
treatment method for patients with short-term (3–5 years) chronic
kidney disease (CKD), and has been accepted as a form of renal
replacement therapy (RRT) for end-stage renal disease (ESRD)
patients (1). There are two forms of
PD, consisting of automated peritoneal dialysis (APD) and
continuous ambulatory peritoneal dialysis (CAPD). Certain studies
have shown that APD has a lower mortality risk compared with CAPD,
with a mortality rate of 40% in patients undergoing APD and a rate
of 60% in patients undergoing CAPD (2,3). In
2008, an estimated 196,000 patients were undergoing PD worldwide,
which represents 11% of the total dialysis population (4). In the United States, ~368,000 patients
underwent dialysis treatment in 2007, with only a 7.2% PD
prevalence (5). However, the number
of patients undergoing treatment with PD appears to be increasing
worldwide, with 41% of patients treated with PD in developed
countries and 59% of patients treated with PD in developing
countries (4). PD, hemodialysis and
kidney transplantation are the three major RRT modalities. In Hong
Kong, PD is the first choice RRT for all ESRD patients (6,7). Due to
the low cost, improved quality of life and excellent comparable
survival rates, the use of PD has increased widely, and the
treatment method has become an essential RRT for patients with ESRD
(8). As an important risk factor
contributing to diabetic foot ulceration, CKD, particularly with
the enrollment of ESRD, has resulted in ~200,000 patients receiving
PD therapy worldwide, which is increasing by >6% per annum
(9,10). These data indicate that the
increasingly wide application of PD is playing a critical role in
the treatment of ESRD patients (11). Furthermore, a previous study
demonstrated that ESRD is associated with the endocrine function of
adipose tissue, and high levels of leptin and adiponectin have been
reported in patients with ESRD (12).
Leptin is a protein product of the obese gene and
one of the adipocytokines primarily secreted by white adipocytes
(13). The protein is formed of 167
amino acids and has a molecular weight of 16 kDa (13). Leptin, via afferent signaling in the
hypothalamus, is known to be involved in regulating the fat stored
in the body and maintaining energy homeostasis, with the means of
exerting influences on the sensation of hunger, energy intake and
energy expenditure (14). Through
increasing the utilization of glucose and the metabolism of
oxidative glucose in adipocytes, insulin indirectly promotes leptin
production (15). Serum
concentrations of leptin are reported to be increased in obese
individuals, due to a reduced ability to detect satiety, and have
been associated with the fat content of the body (16). Serum leptin levels are also known to
be higher in patients who are undergoing PD, such as patients with
hemolytic uremic syndrome, when compared with individuals with
normal renal function. This observation may be caused by the
filtering of leptin at the glomerulus without obstruction and the
degradation of the protein in the renal tubules, as a result of the
impaired clearance by the kidney (17,18). In
addition, malnutrition is a dominant characteristic of uremic
syndrome, and nutritional indicators, including the body mass index
(BMI), the distribution of body fat and the plasma concentration of
albumin, are known to be associated with the development of renal
failure (19,20). Inversely, decreased levels of total
protein and albumin in renal failure patients may reflect the
catabolism of protein, and hypoalbuminemia is strongly associated
with malnutrition (21).
Overexpression of serum leptin is hypothesized to be an independent
risk factor for PD, due to the close association between
peritonitis and the malnutrition resulting from chronic
inflammation. PD may in certain cases be attributed to a higher
expression of leptin clearance, as the plasma concentrations of
leptin in the patients increase correspondingly (20). Previous studies have agreed with the
hypothesis that hyperleptinemia is a leading cause of protein
malnutrition, and that PD may be responsible for the higher levels
of leptin (22,23); however, alternative studies have
reported that high serum concentrations of leptin may not be
present in PD patients (20,24). As a result, the aim of the present
study was to perform a meta-analysis investigating the correlation
between high plasma levels of leptin and PD.
Materials and methods
Search strategy
Potentially relevant studies were identified through
a comprehensive literature search without language restriction,
which covered the following computerized bibliographic databases:
MEDLINE (1966–2014), Science Citation Index (1945–2014), Cochrane
Library (Oxford, UK, Issue 12, 2014), PubMed (1966–2014), Embase
(1974–2014) and CINAHL (1982–2014). In addition, the following
three Chinese databases were included in the search to identify
Chinese-language articles: Chinese Biomedical (1978–2014), Chinese
Journal Full-Text (1980–2014) and Weipu Journal (1989–2014). The
following medical subject headings and free language terms were
used in conjunction with a highly sensitive search strategy. The
search terms were as follows: ʻPDʼ or ʻPeritoneal Dialysisʼ,
ʻContinuous Ambulatory PDʼ or ʻCAPDʼ, ʻContinuous Cycling PDʼ or
ʻCCPDʼ or ʻperitoneum dialysisʼ, and ʻLeptinʼ, ʻObese Proteinʼ,
ʻObese Gene Productʼ, ʻOb Gene Productʼ or ʻOb Proteinʼ.
Additionally, reference lists of relevant studies selected from the
electronic debates were searched manually to identify additional
studies.
Inclusion and exclusion criteria
To be included in the systematic review, retrieved
studies were assessed for their suitability in meeting the
following criteria: i) Search results were conducted within a human
population and published in a peer-reviewed journal; ii) only
case-control studies examining the association between serum leptin
levels and patients undergoing PD were incorporated into the
meta-analysis; iii) all the patients satisfied the guideline
criteria for PD (25); iv) articles
were required to present original data and supply sufficient
information with regard to the serum leptin levels; and v) when
studies provided overlapping data, the study that had the largest
sample number was selected. The major exclusion criteria in this
systematic review were as follows: i) Articles that did not satisfy
the current inclusion criteria; ii) certain publication types,
including letters, abstracts, reviews, meta-analyses and
proceedings; iii) unpublished sources of data; iv) duplication
publications or studies without extractable, numerical data; and v)
subgroup analysis of the included trials. With the application of
these inclusion criteria, the title and abstract of all the
articles were evaluated on relevance. From the selected articles,
the full texts were reviewed, followed by a decision on their
eligibility for inclusion.
Study quality and data extraction
In order to ensure consistency in reviewing and
reporting the results, two reviewers independently assessed the
methodological quality of the included trials using the
Newcastle-Ottawa Scale (NOS) criteria with regard to study design,
content and ease-of-use in the explanation of results or the
meta-analysis for assessing the quality (26). Three broad perspectives were judged,
including subject selection (0–4), subject comparability (0–2) and
clinical outcome (0–3). The subject selection criteria included
four sub-criteria: i) Adequacy of case definition; ii)
representativeness of the cases; iii) selection of control; and iv)
definition of controls. Subject comparability comprised a single
critera; the comparability of cases and controls on the basis of
the design or analysis. Clinical outcome consisted of three
sub-criteria; the ascertainment of clinical outcome, a consistent
method of ascertainment for cases and controls and non-response
rate (http://www.biomedcentral.com/1471-2288/14/45). The NOS
scores ranged between 0 and 9; a study was classified as good
quality for the evidence with a score of ≥7.
Each of the two reviewers assessed the studies
independently based on the aforementioned inclusion/exclusion
criteria. A standardized data form in duplicate was used to collect
the following descriptive information of the included studies:
Surname and initials of the first author, the year of publication
or submission, journal, source country, racial descent of the study
population, language of publication, study design, number of cases
and controls, demographic variables of the subjects, detection
method of the serum leptin levels and baseline leptin levels in the
cases and the controls. Disagreement on the inclusion of a single
study was settled by discussion, or a third investigator was
consulted.
Statistical analysis
The effect size was represented by the mean ±
standard difference, which was used to calculate the serum leptin
levels in patients undergoing PD and healthy controls. A
confidential interval of 95% (95%CI) was calculated for all mean
values, using the Z-test. In addition, a test for the heterogeneity
between the included trials for each comparison was performed using
the Cochran's Q test and I2 tests
(27). If the Q test showed
evidence of a P-value of <0.05 or if the I2
test exhibited a value of >50%, which indicated maximal
heterogeneity among the included studies, a meta-regression
analysis with a random-effects model was conducted to investigate
the sources of heterogeneity, while in other cases, the SMD values
were pooled in accordance with the fixed-effects model (28,29).
When substantial heterogeneity was identified, the differences in
the leptin levels (and 95% CI) were evaluated among subgroups for
different explanatory variables. Additionally, in order to evaluate
the impact of single studies on the overall estimate, a one-way
sensitivity analysis was employed. Furthermore, Egger's linear
regression test, with visual inspection of the funnel plot, was
applied to detect the potential publication bias (30,31).
Statistical analyses were conducted using STATA statistical
software (version 12.0; Stata Corporation, College Station, TX,
USA).
Results
Description of the included
studies
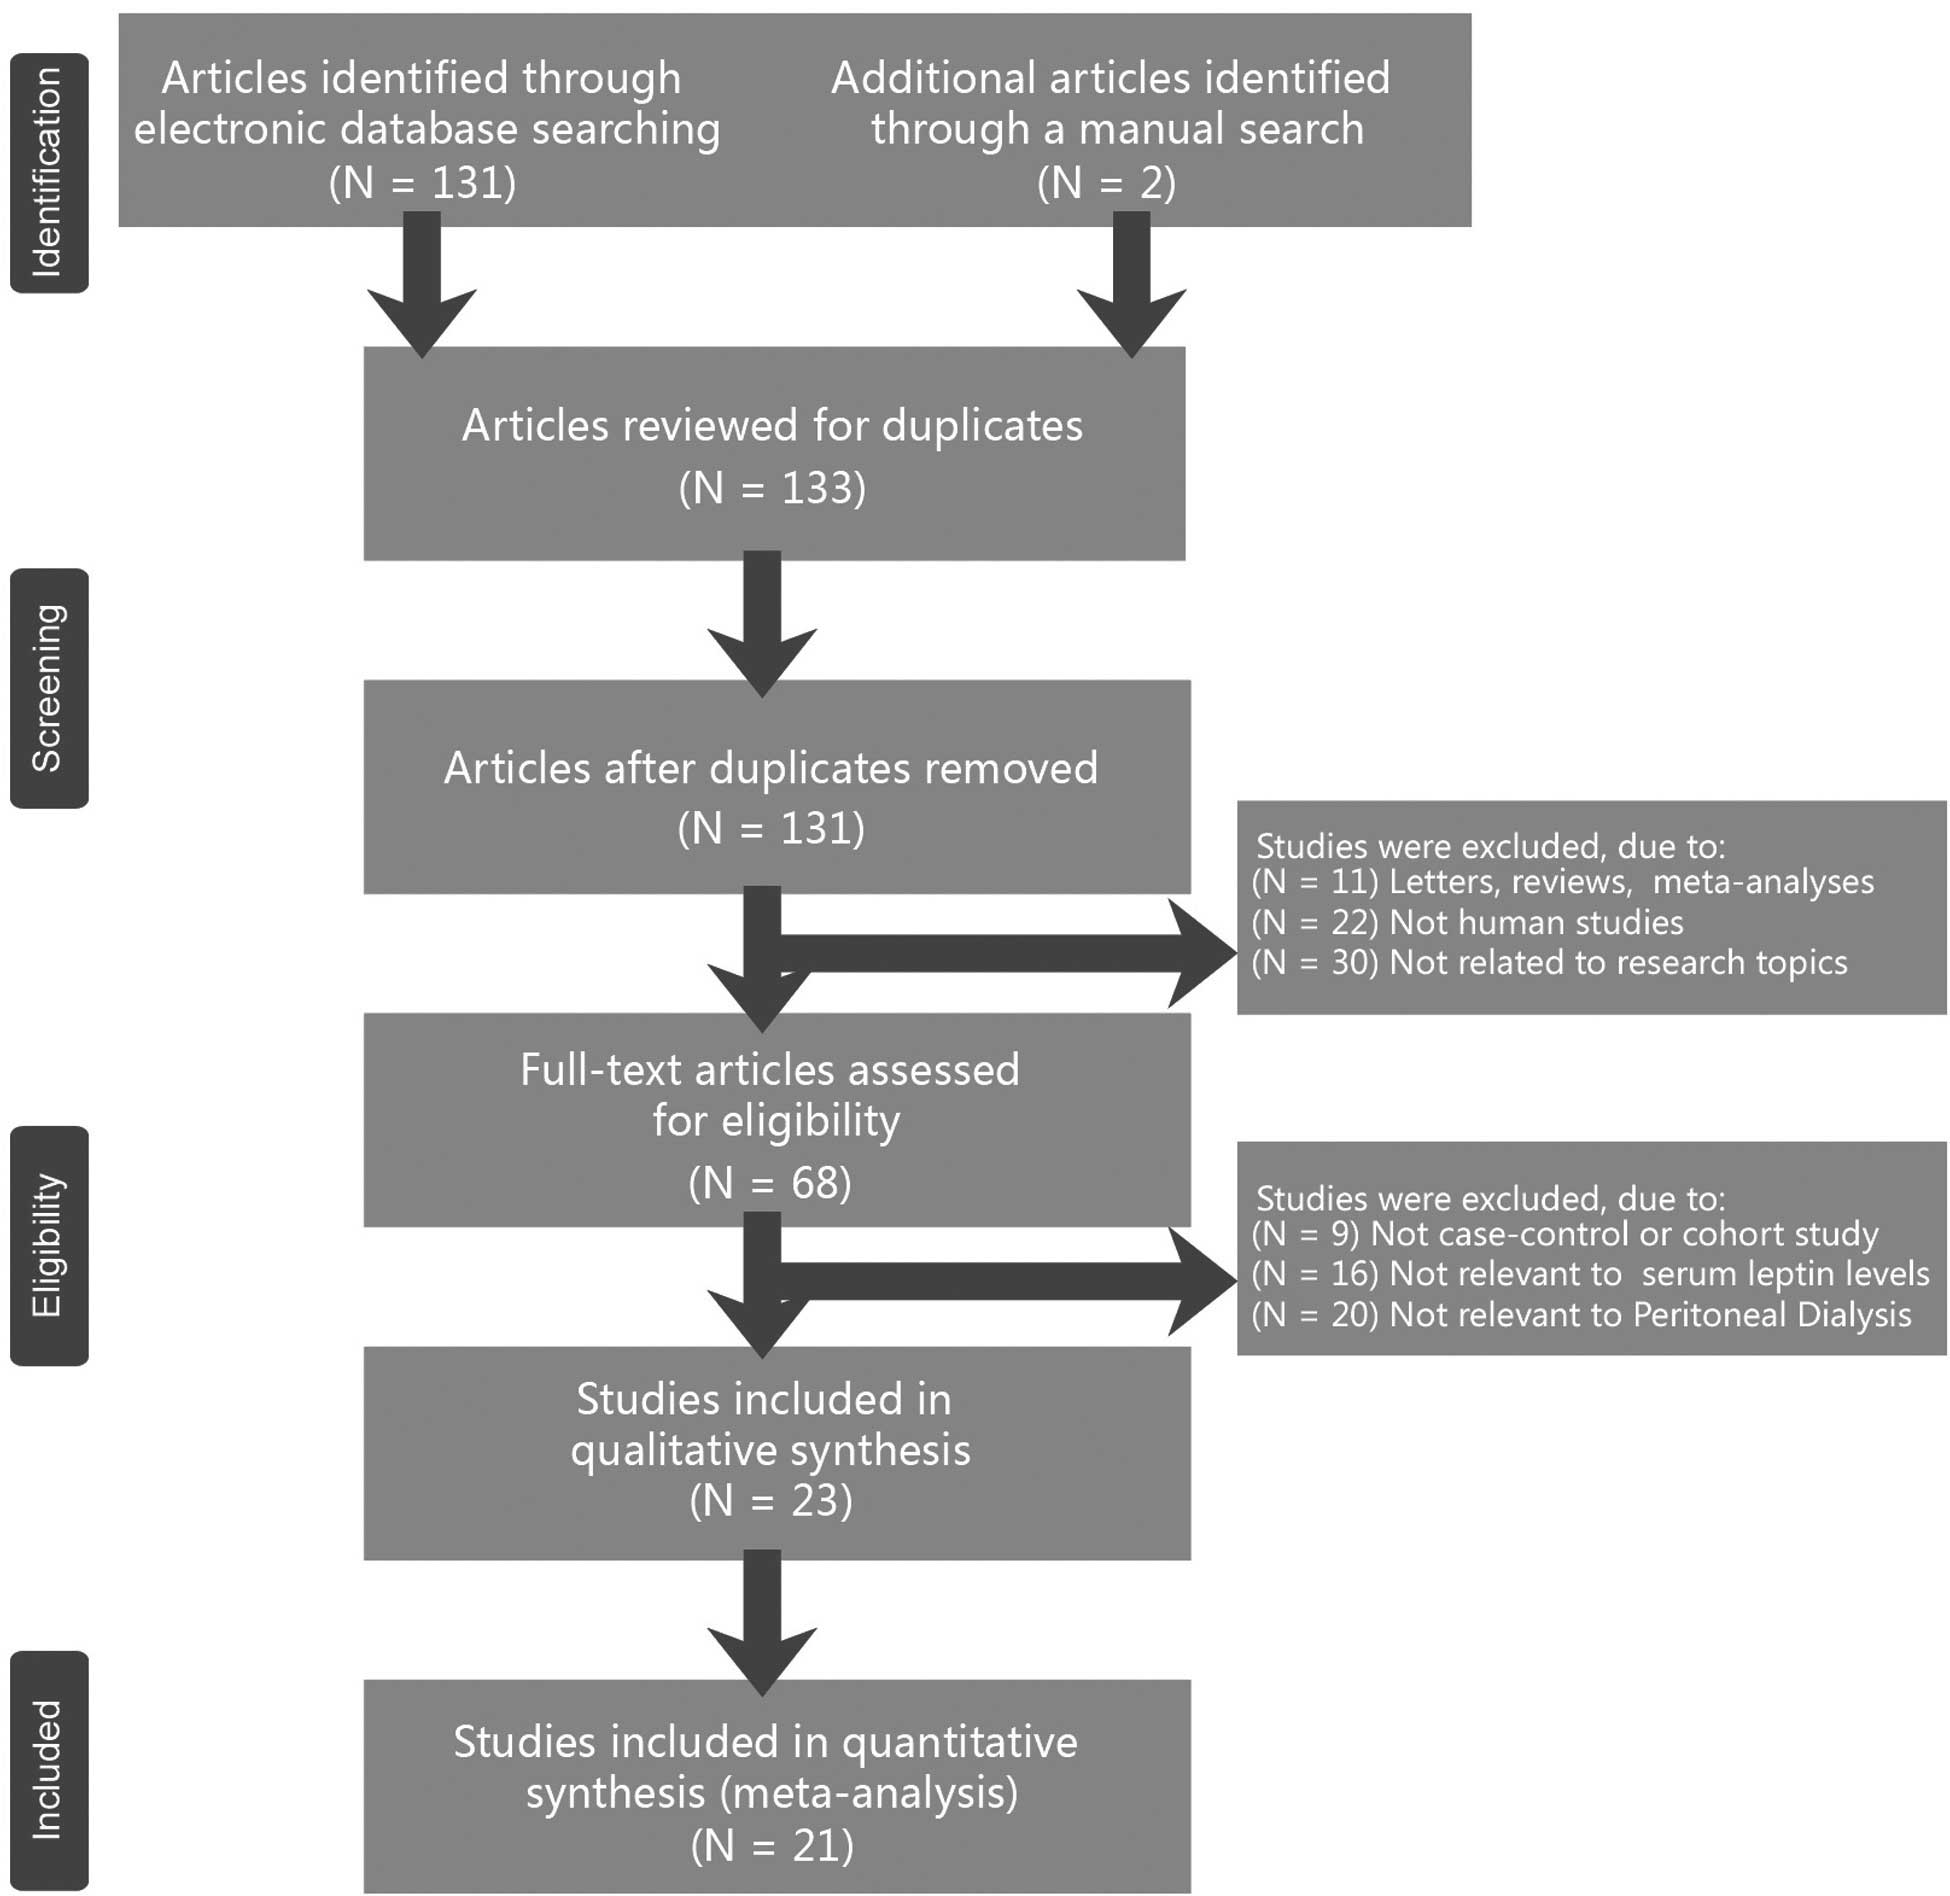
The combined electronic and manual search initially
resulted in 133 potentially eligible articles. Following the
identification of two duplicated studies, the retrieved studies
(n=131) were screened by their title and abstract for relevance.
Subsequently, 63 irrelevant articles were excluded. The remaining
68 articles that qualified for full-text reading were
systematically reviewed. After reading the full text, 45 articles
were deemed unsuitable and were therefore excluded. Thus, 23
articles were included in the qualitative analysis. However, an
additional two studies were excluded due to lack of data integrity
following a more careful assessment of the remaining articles. A
flow diagram of the study selection progress and the main reasons
for exclusion is shown in Fig. 1
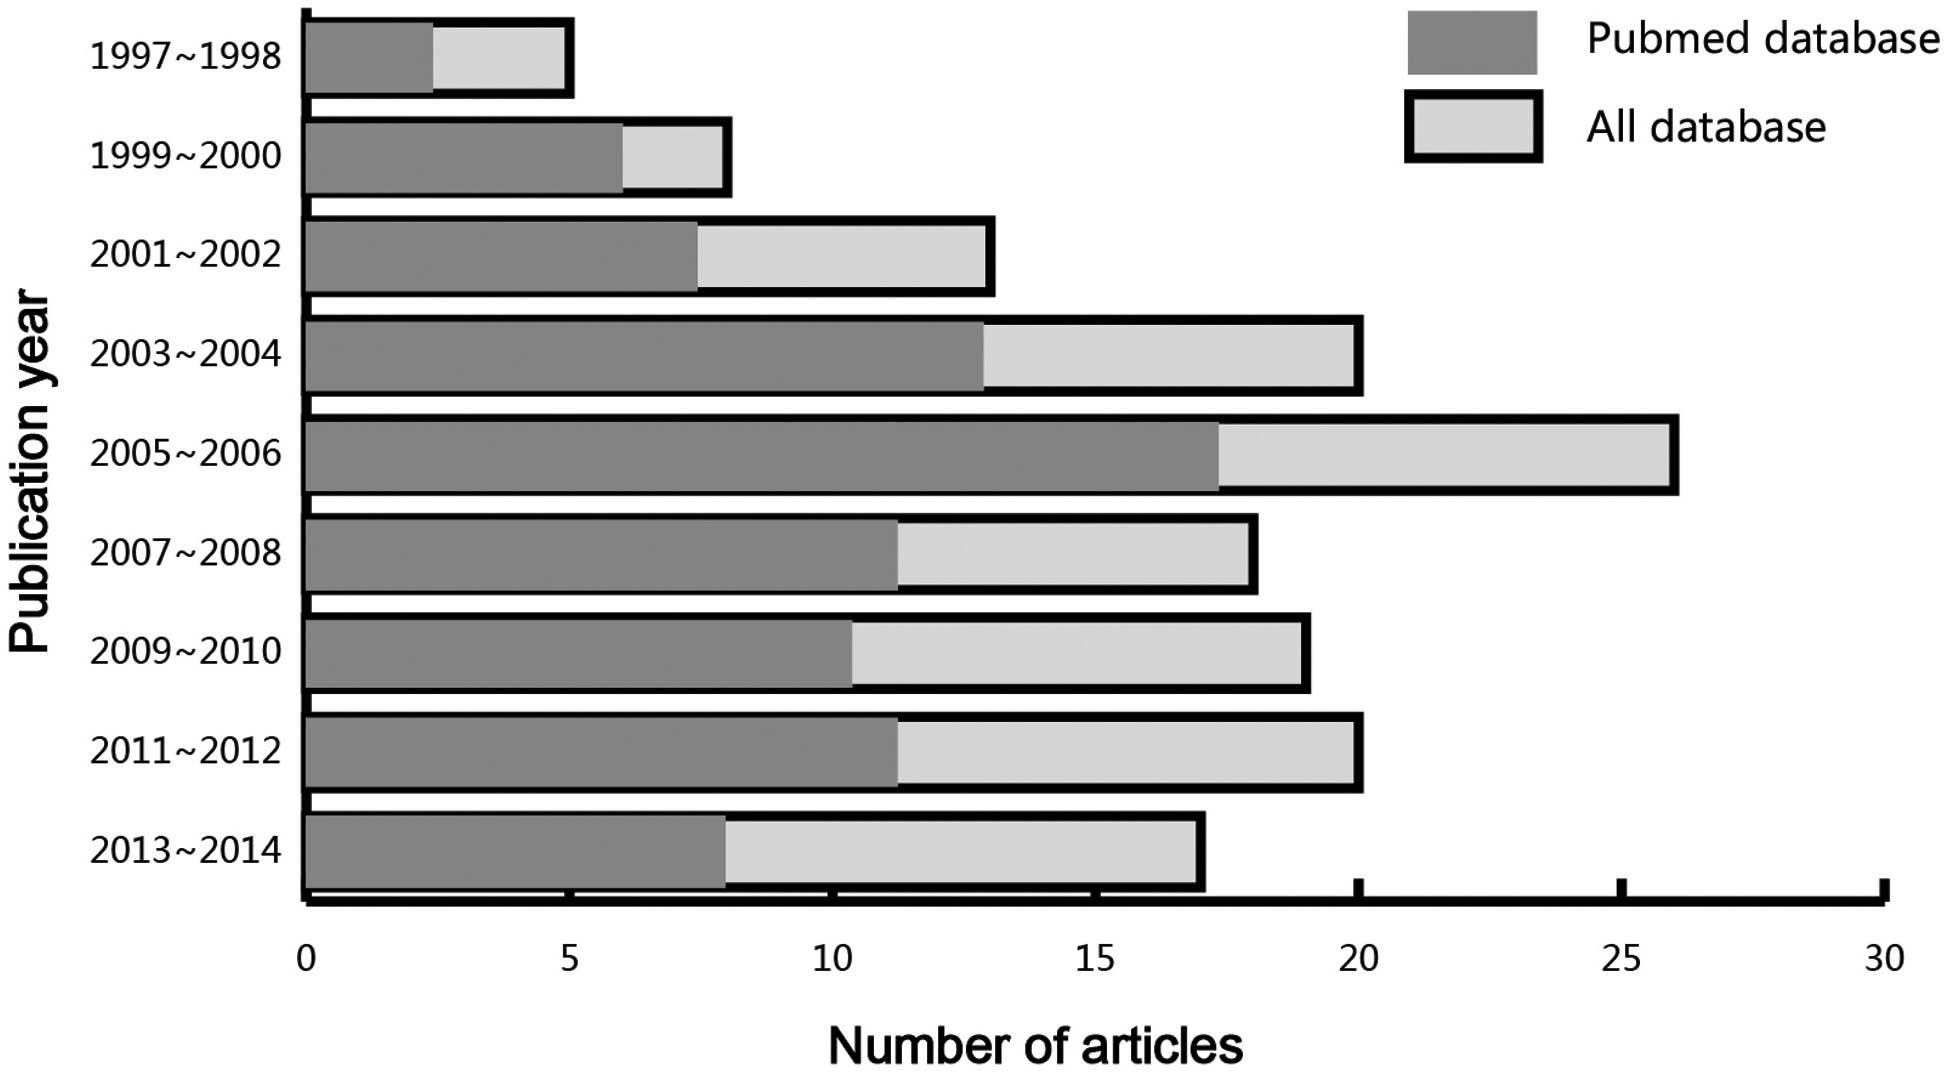
Finally, 21 case-control studies, comprising 574 patients that had
undergone PD and 613 controls, were incorporated into the current
meta-analysis (15,20,22–24,32–47). All
the eligible studies had been published between 1997 and 2014
(Fig. 2), and all the enrolled
papers exhibited moderate to high quality.
With regard to the demographic variables of the 21
included studies, 13 studies were performed with an Asian study
population, while the remaining eight studies included a Caucasian
study population. With regard to the methods used to detect the
leptin levels, 11 studies utilized a radioimmunoassay (RIA), while
the remaining 10 studies performed an enzyme-linked immunosorbent
assay (ELISA). Table I presents the
baseline characteristics of the study populations and the
characteristics of the included studies.
 | Table I.Characteristics of the included
studies focused on the serum levels of leptin. |
Table I.
Characteristics of the included
studies focused on the serum levels of leptin.
|
|
|
| Sample size
(n) | Gender, M/F
(n) | Mean age
(years) |
|
|
|---|
|
|
|
|
|
|
|
|
|
|---|
| First author
(reference) | Year | Ethnicity | Case | Control | Case | Control | Case | Control | Method | NOS score |
|---|
| Kaynar K (20) | 2014 | Asian | 30 | 30 | – | – |
39.1±13.4 |
33.4±9.4 | ELISA | 6 |
| Yang FF (40) | 2011 | Asian | 30 | 30 | 17/13 | – |
61.7±14.0 | – | RIA | 6 |
| Wu R (42) | 2011 | Asian | 26 | 30 |
15±11 | – |
53.3±12.7 | – | ELISA | 6 |
| Ma Y (46) | 2011 | Asian | 20 | 20 |
12±8 | – |
55.8±14.5 | – | RIA | 6 |
| Zhang L (24) | 2010 | Asian | 20 | 13 |
11±9 |
6±7 |
58.8±11.4 |
57.8±12.7 | RIA | 6 |
| Wang ZM (44) | 2010 | Asian | 45 | 30 |
24±21 |
17±13 |
60.4±10.2 |
58.5±12.9 | RIA | 8 |
| Malyszko J
(35) | 2010 | Caucasian | 40 | 22 | – |
11±9 |
52.3±12.5 |
56.0±14.8 | RIA | 7 |
| Małgorzewicz S
(36) | 2010 | Caucasian | 30 | 23 |
12±18 |
8±15 |
57.3±16.6 |
63.3±7.8 | ELISA | 7 |
| Xu XD (41) | 2008 | Asian | 40 | 40 | – | – | – | – | RIA | 6 |
| Taskapan MC
(15) | 2007 | Asian | 30 | 30 |
18±12 |
17±13 |
43.2±10.8 |
40.9±10.0 | ELISA | 7 |
| Wu JQ (43) | 2006 | Asian | 26 | 26 | – | – | – | – | ELISA | 6 |
| Guan X (47) | 2006 | Asian | 30 | 30 |
16±14 |
19±11 |
52.3±3.1 |
51.2±3.6 | ELISA | 7 |
| Buyan N (39) | 2006 | Asian | 24 | 23 | – | – | 13 (7–18) | 14 (4–18) | RIA | 6 |
| Wright M (32) | 2004 | Caucasian | 39 | 43 |
23±16 |
22±21 | 53 (23–75) | 50 (36–73) | ELISA | 7 |
| Hilkens MG
(22) | 2003 | Caucasian | 10 | 10 |
5±5 |
5±5 | 49 | 49 | ELISA | 6 |
| Zuo J (45) | 2002 | Asian | 9 | 13 |
8±1 |
8±5 |
61.0±12.0 |
52.0±6.0 | ELISA | 6 |
| Vignioble M
(33) | 2001 | Caucasian | 23 | 35 |
10±13 |
16±19 | – | – | RIA | 6 |
| Tsujimoto Y
(34) | 1999 | Asian | 46 | 67 |
28±18 |
37±30 |
50.0±1.6 |
50.6±1.0 | ELISA | 8 |
| Landt M (37) | 1999 | Caucasian | 28 | 28 |
14±14 |
14±14 |
54.5±17.7 |
36.8±8.0 | RIA | 6 |
| Johansen KL
(38) | 1998 | Caucasian | 9 | 41 |
5±4 |
21±20 |
43.0±15.0 |
36.0±10.0 | RIA | 6 |
| Howard JK (23) | 1997 | Caucasian | 19 | 29 | – | – | – | – | RIA | 6 |
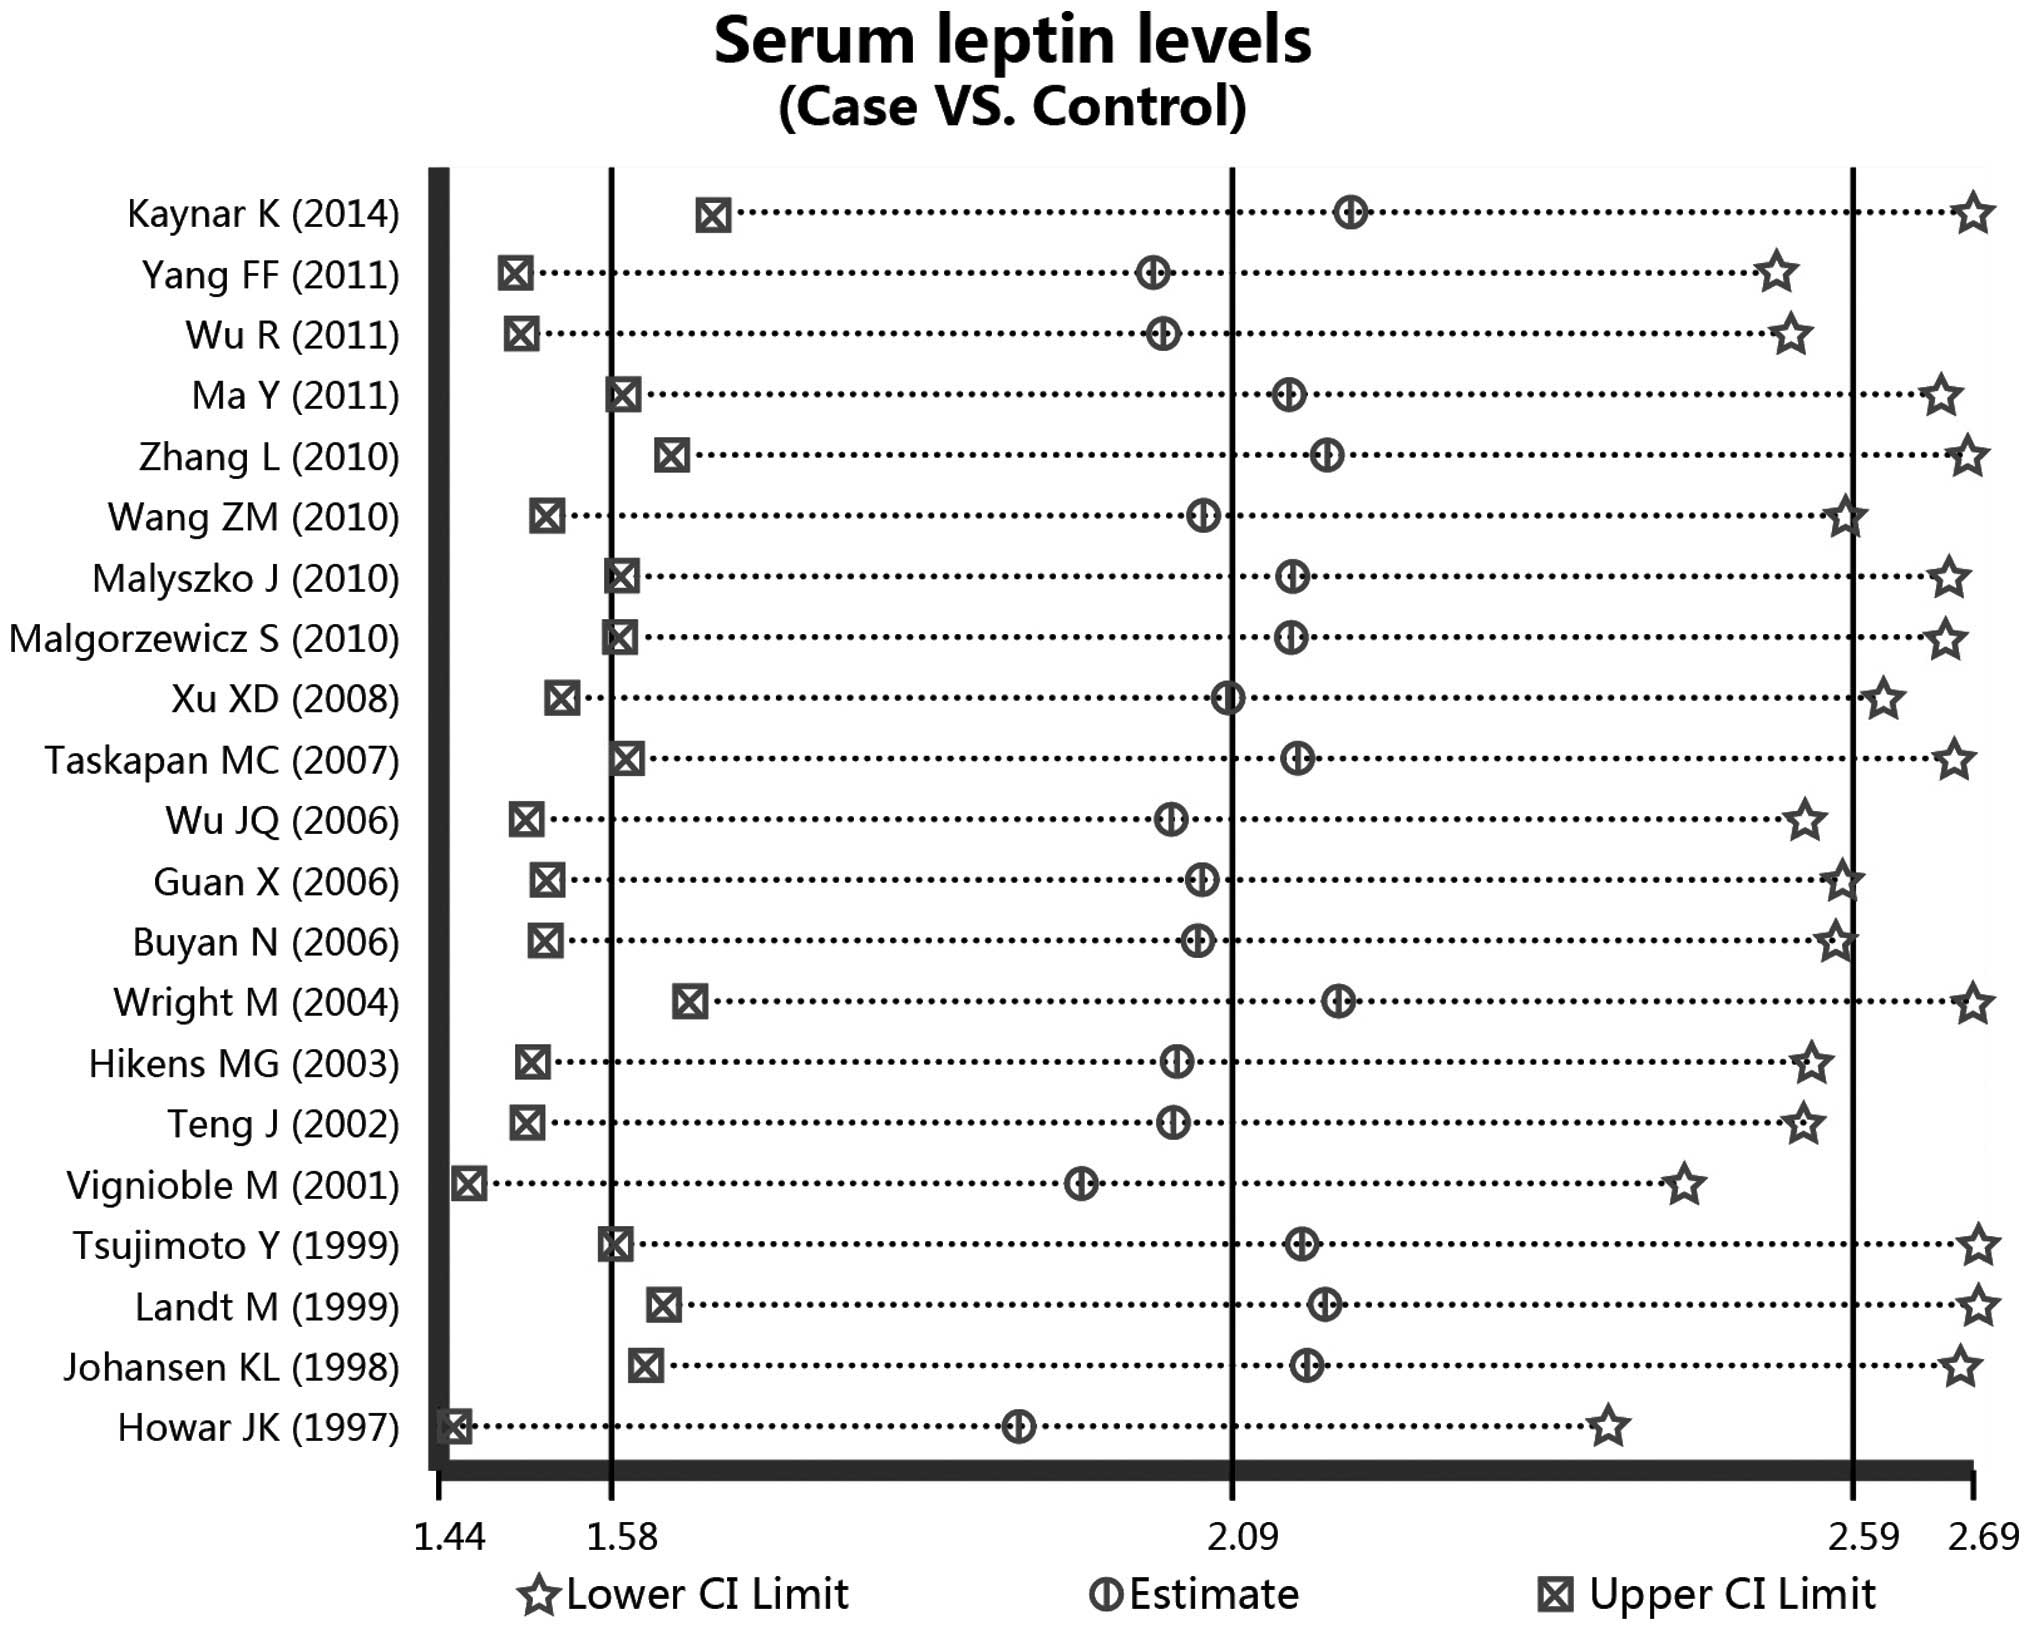
Quantitative data synthesis
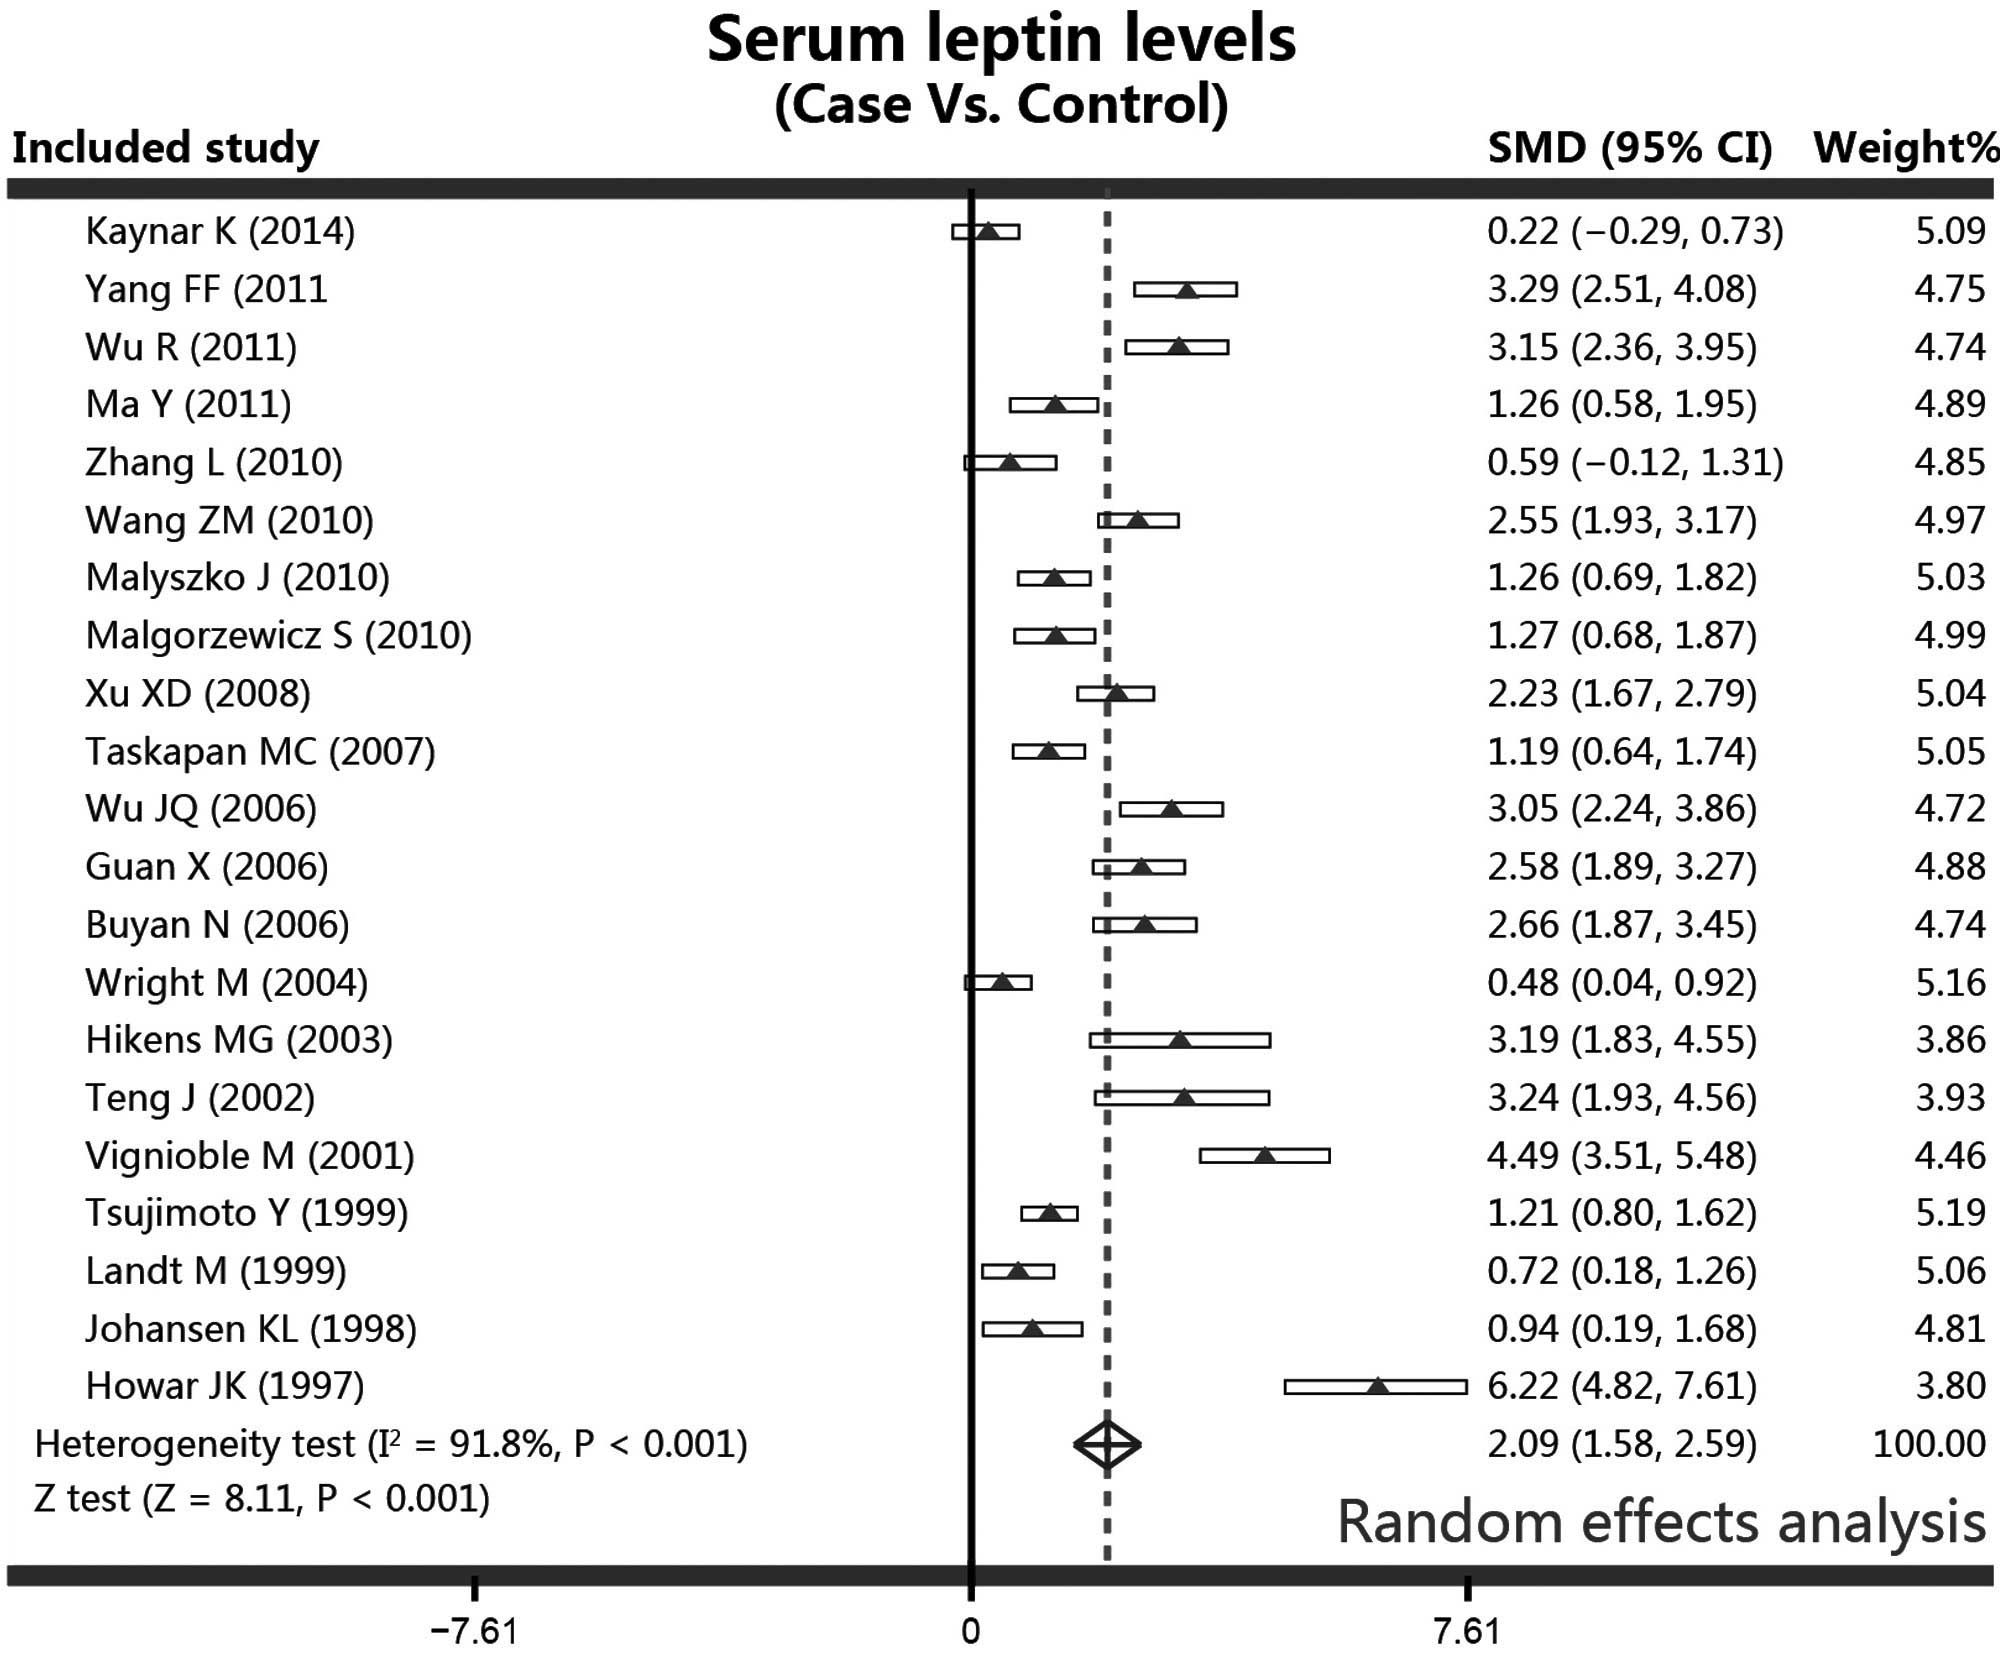
In the meta-analysis, the serum leptin levels in the
patients receiving PD and the controls were analyzed using a random
effects model due to the evidence of heterogeneity (controls vs.
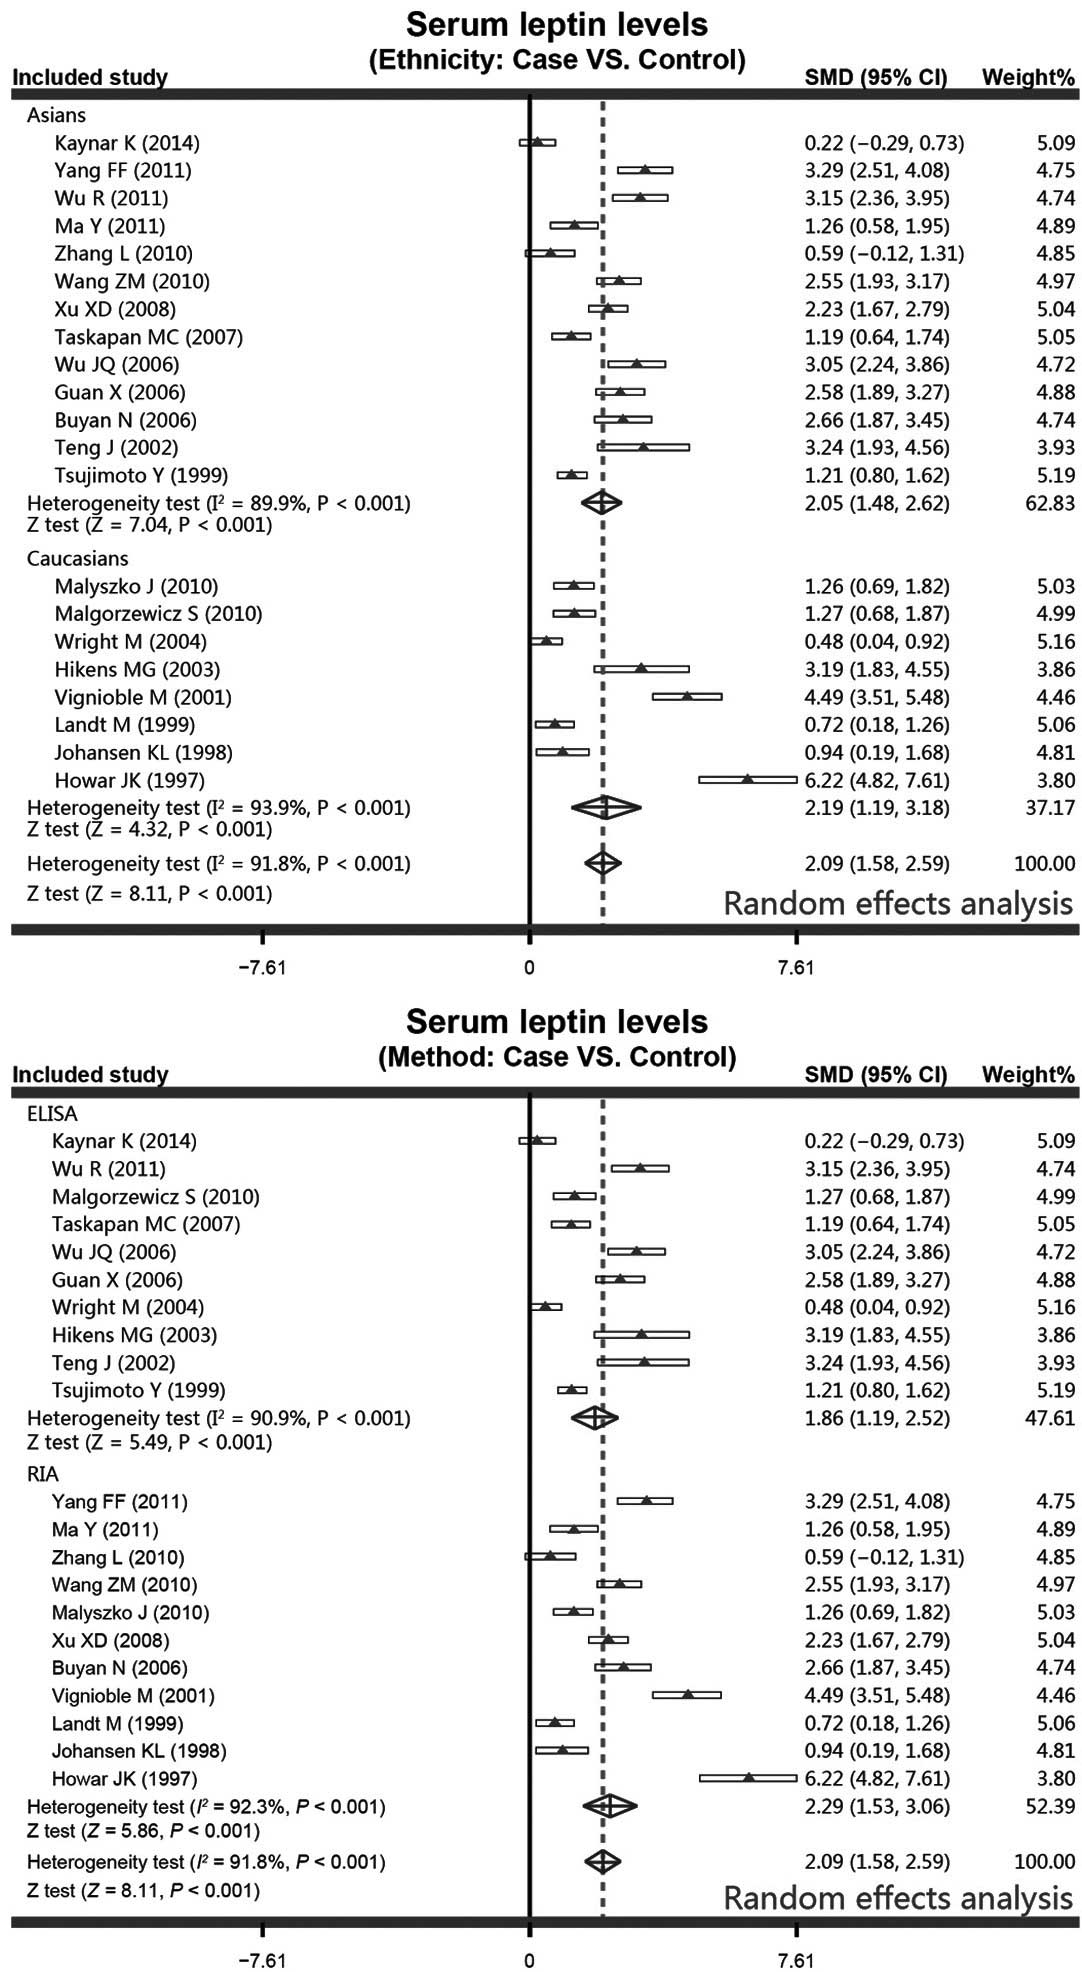
cases, I2=91.8%, P<0.001). Additionally, since
a significant heterogeneity was shown to exist, the studies were
stratified by ethnicity (Asian population subgroup,
I2=89.9%, P<0.001; Caucasian population
subgroup, I2=93.9%, P<0.001) and detection
methods (ELISA subgroup, I2=90.9%, P<0.001;
RIA subgroup, I2=92.3%, P<0.001). Results from
the meta-analysis revealed a statistically significant difference
in the serum levels of leptin between the PD patients and the
healthy controls. Higher serum concentrations of leptin were
observed in the PD patients when compared with the controls,
according to the random effects pooled SMD in the 21 included
studies (controls vs. cases, SMD, 2.09; 95% CI, 1.58–2.59;
P<0.001; Fig. 3).
With regard to the ethnicity-stratified subgroup
analysis, the results from the meta-analysis revealed that the PD
patients were associated with increased serum leptin levels in
contrast to the healthy controls in the Asian population subgroup
(controls vs. cases, SMD, 2.05; 95% CI, 1.48–2.62; P<0.001).
Additionally, higher serum leptin levels were observed more
frequently in the PD patients in the Caucasian population subgroup
(controls vs. cases, SMD, 2.19; 95% CI, 1.19–3.18; P<0.001).
Furthermore, in the method-stratified subgroup analysis, the PD
patients were found to have higher serum leptin levels in the ELISA
subgroup (controls vs. cases, SMD, 1.86; 95% CI, 1.19–2.52;
P<0.001), and a similar correlation was also observed in the RIA
subgroup (controls vs. cases, SMD, 2.29; 95% CI, 1.53–3.06;
P<0.001; Fig. 4).
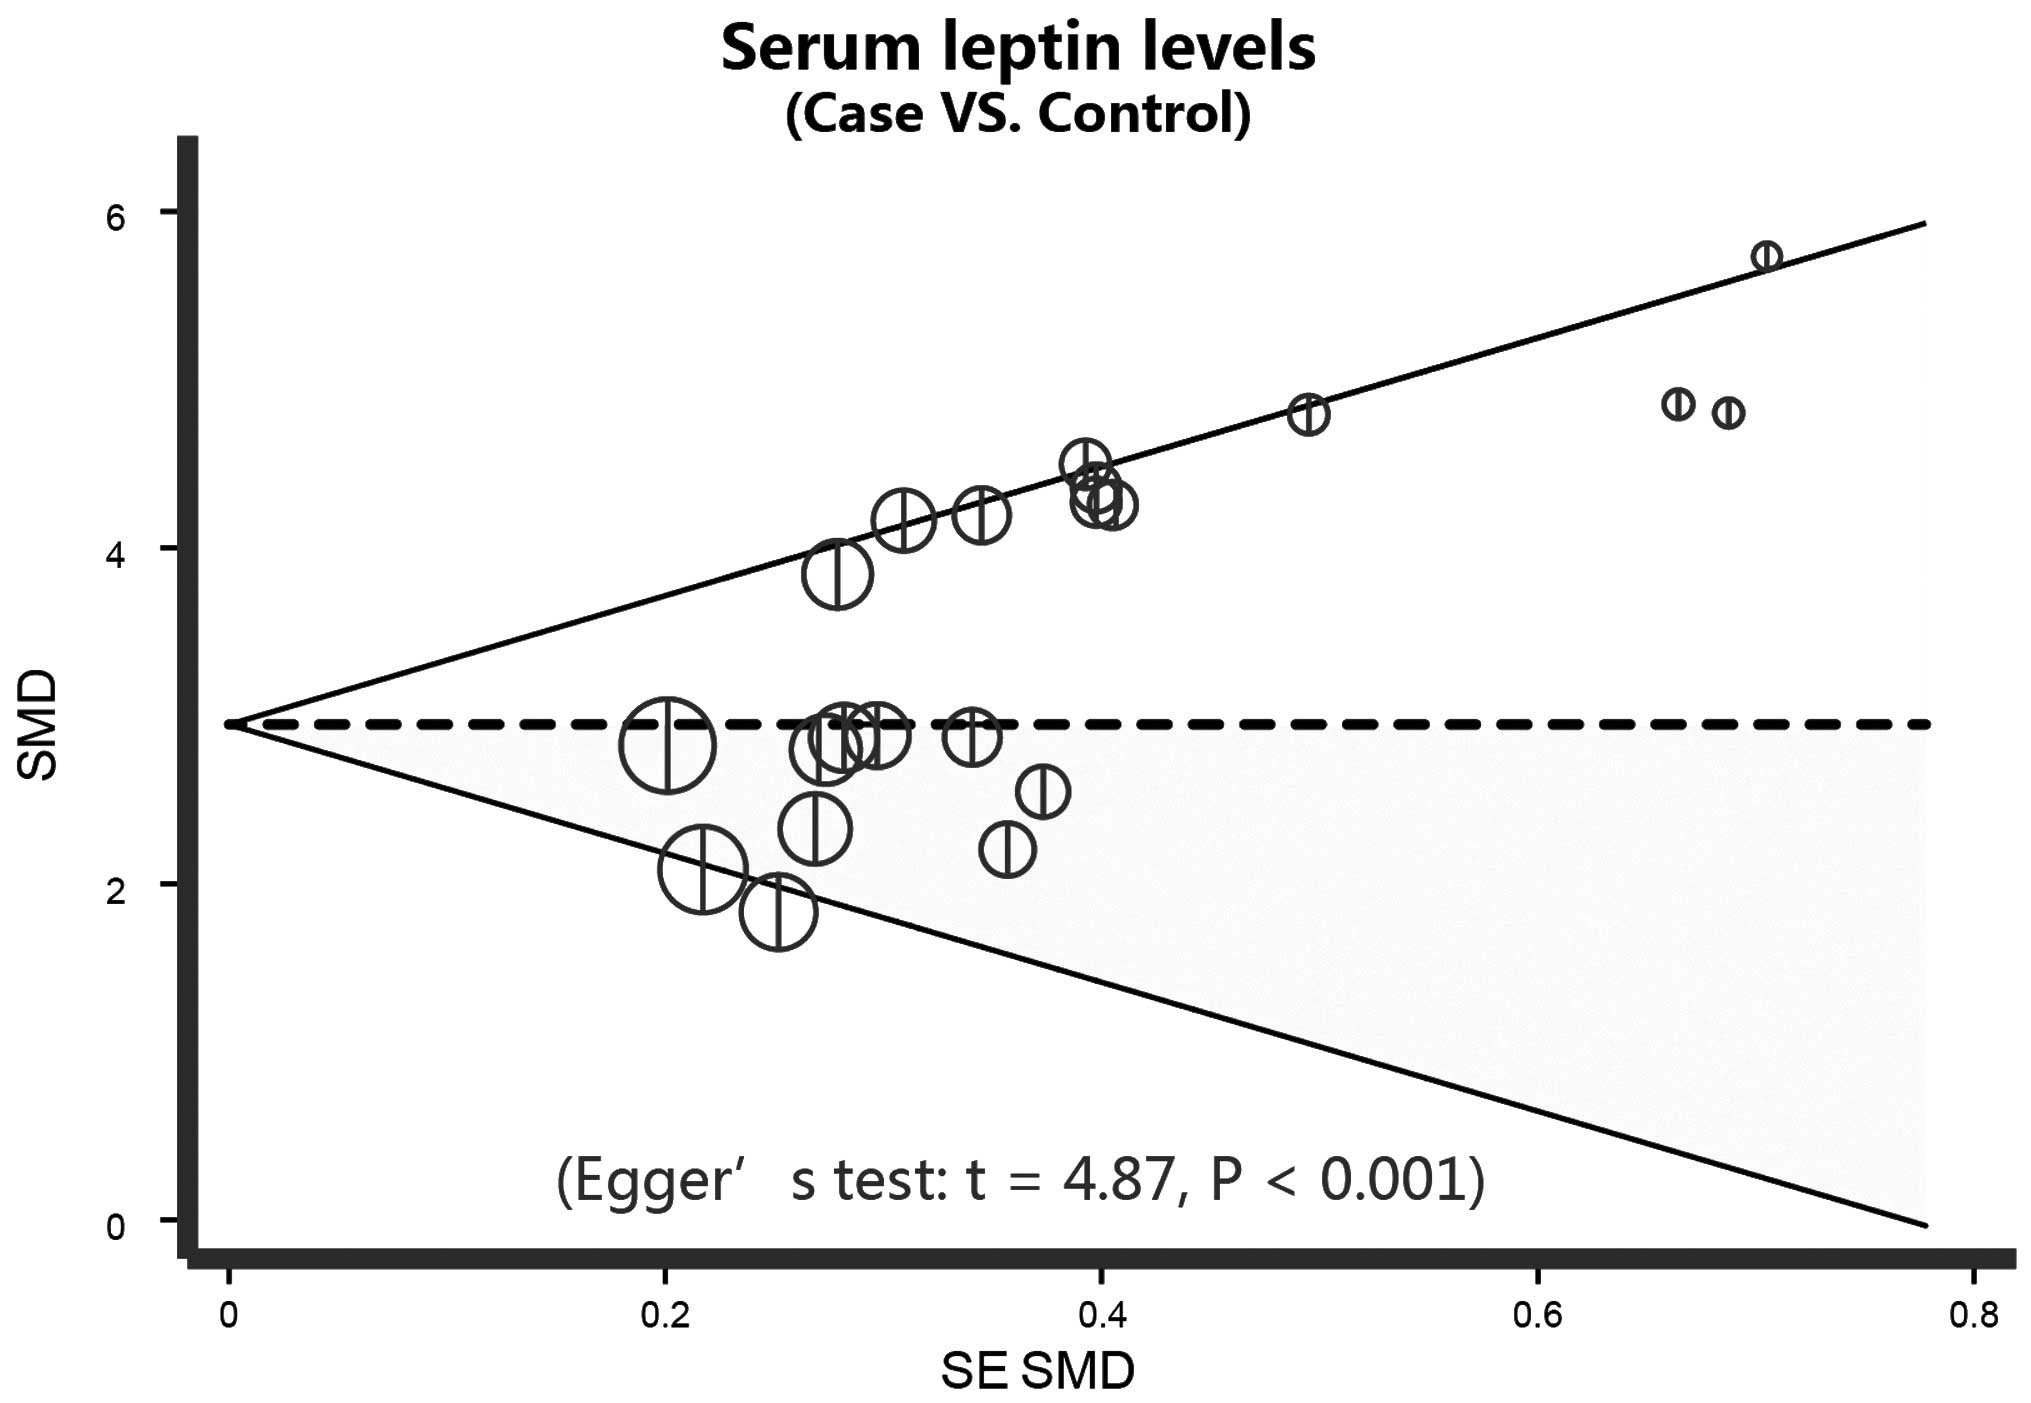
Further sensitivity analyses were conducted to
determine whether the review conclusions were affected by the
selection of a single study, and the findings indicated that no
single study had an effect on the pooled SMD values in the current
meta-analysis (Fig. 5). Finally,
Egger's regression analysis displays the asymmetrical distribution
of the funnel plot, which indicates publication biases in the
differences in serum leptin levels between patients undergoing PD
and controls (t=4.87; P<0.001) in the systematic reviews
(Fig. 6).
Discussion
The aim of the present meta-analysis was to
investigate the association between high serum levels of leptin and
PD. The results of the meta-analysis demonstrated that high leptin
levels were closely associated with PD, indicating that PD therapy
may not be an effective therapy for the clearance of leptin. As the
first adipocyte-derived hormone, leptin is a 16 kDa peptide hormone
with 146 amino acids, which is formed by cleaving a signal peptide
of 21 amino acids from its prototype in the blood (48). Leptin plays a role in the central
nervous system through hypothalamic pathways, with its main
function to cause a decrease in food intake and an increase in the
metabolic rate, promoting weight loss and the regulation of the
energy balance (39). In addition to
the effect on the central nervous system, leptin is also able to
inhibit the secretion of insulin, increase natriuresis, diuresis
and angiogenesis, and promote the calcification of vessels and
increase oxidative stress (49).
Thus, leptin is associated with a number of diseases, such as
coronary artery calcification, vascular dysfunction, hypertension
and kidney diseases (50). The
metabolic pathway of leptin is through glomerulus filtration,
followed by degradation within the renal tubules; thus, a high
serum level of leptin is often observed in kidney disease patients
(51). Elevated serum leptin levels
may cause weight loss, malnutrition and anorexia, which can
deteriorate the symptoms of kidney disease patients and are
detrimental for the long-term survival of patients (36,52). PD,
as a first-choice RRT, uses the peritoneum as a dialysis membrane,
and is a safe and gentle method to correct metabolic and
electrolytic disturbances generated in kidney diseases, including
the clearance of leptin (53).
However, PD is only partially able to clear leptin, and the
clearance volume in PD and the high level of leptin have been found
to be positively associated (54).
In PD patients, the filtration rate of the glomerulus is decreased
due to renal impairment; thus, the renal clearance of leptin is
decreased, which leads to high serum leptin levels (55). Furthermore, the increased glucose
load results in chronic hyperinsulinemia, which subsequently
stimulates the insulin level and regulates the gene expression of
leptin, ultimately causing high leptin serum levels (15). From these observations, it was
hypothesized that high leptin levels in kidney disease patients may
deteriorate the symptoms of the patients by causing malnutrition
and anorexia. In addition, PD was hypothesized to be closely
associated with the high leptin level, through the insufficient
physical clearance, renal impairment and the increase in the
indirect glucose load, which subsequently regulated the increased
expression of leptin. Malyszko et al also observed increased
levels of leptin in PD patients, which represented a connection
between inflammation and adipocytokines, and the authors concluded
that the dialysis time and adequacy may affect the clearance of
leptin in patients undergoing dialysis (35).
Since a number of factors may influence the
association between high serum levels of leptin and PD, a
stratified analysis based on the ethnicity of the study population
and the leptin detection method was established. The ethnicity
subgroup analysis revealed a significant association between the
leptin serum level increase and PD therapy in Asian and Caucasian
populations, which may demonstrate that no racial difference exists
between the high leptin level and PD. Therefore, the results of the
present study are in accordance with previous studies that
demonstrated a close connection between PD therapy and an increase
in serum leptin levels (19,22,43).
These observations indicate that PD therapy may contribute
potential damage to renal function and subsequently have an
influence on the clearance of leptin; thus, additional measures
should be undertaken to reduce the leptin level in PD patients and
improve the treatment of kidney disease.
However, there were a number of limitations in the
current meta-analysis that should be taken into consideration.
Firstly, the existence of heterogeneity, since the groups were not
homogenous with respect to age, BMI, smoking status, ethnicity and
serum level detection methods, and the insulin sensitivity of the
patients was not further investigated. Notably, certain publication
convention may be acknowledged that positive results tend to be
more acceptable by journals, while negative researches are often
easy to be rejected or not submitted for review. Thus, the lack of
negative results may restrict a broader experiment and constrict
the findings of the present study to a large extent. Furthermore,
language introduces bias and those publications prone to be
published in English language-based journals. Thirdly, although
this study was based on relatively large sample size studies, a
relatively small sample size may limit the detection of more subtle
changes over time. In addition, regardless of the underlying degree
of glucose tolerance, fasting or diet, significant circadian
fluctuations in the serum leptin concentration may obscure a number
of small, but significant changes, in the serum leptin level, which
may be a source of potential bias for longitudinal observation.
Therefore, all these factors may result in an inconsistent
outcome.
In conclusion, the present study reported increased
serum leptin concentrations in patients undergoing PD therapy,
indicating that PD therapy may contribute potential damage to renal
function and affect the clearance of leptin. These results
highlight the importance of leptin as a potential determinant of
weight loss, malnutrition and anorexia, particularly in patients
undergoing PD therapy. However, further studies with larger sample
sizes are required to confirm the clinical utility of serum leptin
as an important biomarker for PD patients.
References
|
1
|
Chaudhary K and Khanna R: Biocompatible
peritoneal dialysis solutions: do we have one? Clin J Am Soc
Nephrol. 5:723–732. 2010. View Article : Google Scholar : PubMed/NCBI
|
|
2
|
Katavetin P, Theerasin Y, Treamtrakanpon
W, et al: Treatment failure in automated peritoneal dialysis and
double-bag continuous ambulatory peritoneal dialysis. Nephrology
(Carlton). 18:545–548. 2013. View Article : Google Scholar : PubMed/NCBI
|
|
3
|
Cortés-Sanabria L, Paredes-Ceseña CA,
Herrera-Llamas RM, et al: Comparison of cost-utility between
automated peritoneal dialysis and continuous ambulatory peritoneal
dialysis. Arch Med Res. 44:655–661. 2013. View Article : Google Scholar : PubMed/NCBI
|
|
4
|
Jain AK, Blake P, Cordy P and Garg AX:
Global trends in rates of peritoneal dialysis. J Am Soc Nephrol.
23:533–544. 2012. View Article : Google Scholar : PubMed/NCBI
|
|
5
|
Chaudhary K, Sangha H and Khanna R:
Peritoneal dialysis first: rationale. Clin J Am Soc Nephrol.
6:447–456. 2011. View Article : Google Scholar : PubMed/NCBI
|
|
6
|
Sakthong P and Kasemsup V: Health utility
measured with EQ-5D in Thai patients undergoing peritoneal
dialysis. Value Health. 15:(Suppl). S79–S84. 2012. View Article : Google Scholar : PubMed/NCBI
|
|
7
|
Kwan BC, Chow KM, Ma TK, et al: Automated
peritoneal dialysis in Hong Kong: there are two distinct groups of
patients. Nephrology (Carlton). 18:356–364. 2013. View Article : Google Scholar : PubMed/NCBI
|
|
8
|
Guney I, Solak Y, Atalay H, et al:
Comparison of effects of automated peritoneal dialysis and
continuous ambulatory peritoneal dialysis on health-related quality
of life, sleep quality and depression. Hemodial Int. 14:515–522.
2010. View Article : Google Scholar : PubMed/NCBI
|
|
9
|
Johnson DW, Brown FG, Clarke M, et al:
balANZ Trial Investigators: Effects of biocompatible versus
standard fluid on peritoneal dialysis outcomes. J Am Soc Nephrol.
23:1097–1107. 2012. View Article : Google Scholar : PubMed/NCBI
|
|
10
|
Kaminski M, Frescos N and Tucker S:
Prevalence of risk factors for foot ulceration in patients with
end-stage renal disease on haemodialysis. Intern Med J.
42:e120–e128. 2012. View Article : Google Scholar : PubMed/NCBI
|
|
11
|
Weinhandl ED, Foley RN, Gilbertson DT, et
al: Propensity-matched mortality comparison of incident
hemodialysis and peritoneal dialysis patients. J Am Soc Nephrol.
21:499–506. 2010. View Article : Google Scholar : PubMed/NCBI
|
|
12
|
Kim S, Oh KH, Chin HJ, et al: Effective
removal of leptin via hemodiafiltration with on-line endogenous
reinfusion therapy. Clin Nephrol. 72:442–448. 2009. View Article : Google Scholar : PubMed/NCBI
|
|
13
|
Marwarha G and Ghribi O: Leptin signaling
and Alzheimer's disease. Am J Neurodegener Dis. 1:245–265.
2012.PubMed/NCBI
|
|
14
|
Mutabaruka MS, Aoulad Aissa M, Delalandre
A, et al: Local leptin production in osteoarthritis subchondral
osteoblasts may be responsible for their abnormal phenotypic
expression. Arthritis Res Ther. 12:R202010. View Article : Google Scholar : PubMed/NCBI
|
|
15
|
Taskapan MC, Taskapan H, Sahin I, et al:
Serum leptin, resistin and lipid levels in patients with end stage
renal failure with regard to dialysis modality. Ren Fail.
29:147–154. 2007. View Article : Google Scholar : PubMed/NCBI
|
|
16
|
Fang TC, Lee CJ, Wang CH, et al: Fasting
serum leptin level correlates with mid-arm fat area in peritoneal
dialysis patients. Ther Apher Dial. 14:583–588. 2010. View Article : Google Scholar : PubMed/NCBI
|
|
17
|
Briley LP and Szczech LA: Leptin and renal
disease. Semin Dial. 19:54–59. 2006. View Article : Google Scholar : PubMed/NCBI
|
|
18
|
Mak RH, Cheung W, Cone RD and Marks DL:
Leptin and inflammation-associated cachexia in chronic kidney
disease. Kidney Int. 69:794–797. 2006. View Article : Google Scholar : PubMed/NCBI
|
|
19
|
Pérez-Fontán M, Cordido F,
Rodríguez-Carmona A, et al: Plasma ghrelin levels in patients
undergoing haemodialysis and peritoneal dialysis. Nephrol Dial
Transplant. 19:2095–2100. 2004. View Article : Google Scholar : PubMed/NCBI
|
|
20
|
Kaynar K, Kural BV, Ulusoy S, et al: Is
there any interaction of resistin and adiponectin levels with
protein-energy wasting among patients with chronic kidney disease.
Hemodial Int. 18:153–162. 2014. View Article : Google Scholar : PubMed/NCBI
|
|
21
|
Horwich TB, Kalantar-Zadeh K, MacLellan RW
and Fonarow GC: Albumin levels predict survival in patients with
systolic heart failure. Am Heart J. 155:883–889. 2008. View Article : Google Scholar : PubMed/NCBI
|
|
22
|
Hilkens MG, Netea MG, Van der Meer JW and
Koolen MI: Leptin and proinflammatory cytokines in patients
undergoing peritoneal dialysis. Eur J Clin Invest. 33:525–526;
author reply 527–528. 2003. View Article : Google Scholar : PubMed/NCBI
|
|
23
|
Howard JK, Lord GM, Clutterbuck EJ, et al:
Plasma immunoreactive leptin concentration in end-stage renal
disease. Clin Sci (Lond). 93:119–126. 1997.PubMed/NCBI
|
|
24
|
Zhang L, Liu J, Xu DM, et al: Clearance
effect of peritoneal dialysis on leptin. J Southeast Univ.
29:539–542. 2010.
|
|
25
|
Tsubakihara Y, Nishi S, Akiba T, et al:
2008 Japanese society for dialysis therapy: guidelines for renal
anemia in chronic kidney disease. Ther Apher Dial. 14:240–275.
2010. View Article : Google Scholar : PubMed/NCBI
|
|
26
|
Stang A: Critical evaluation of the
Newcastle-Ottawa scale for the assessment of the quality of
nonrandomized studies in meta-analyses. Eur J Epidemiol.
25:603–605. 2010. View Article : Google Scholar : PubMed/NCBI
|
|
27
|
Zintzaras E and Ioannidis JP: HEGESMA:
genome search meta-analysis and heterogeneity testing.
Bioinformatics. 21:3672–3673. 2005. View Article : Google Scholar : PubMed/NCBI
|
|
28
|
Zintzaras E and Ioannidis JP:
Heterogeneity testing in meta-analysis of genome searches. Genet
Epidemiol. 28:123–137. 2005. View Article : Google Scholar : PubMed/NCBI
|
|
29
|
Higgins JP and Thompson SG: Quantifying
heterogeneity in a meta-analysis. Stat Med. 21:1539–1558. 2002.
View Article : Google Scholar : PubMed/NCBI
|
|
30
|
Song F and Gilbody S: Bias in
meta-analysis detected by a simple, graphical test. Increase in
studies of publication bias coincided with increasing use of
meta-analysis. BMJ. 316:4711998.PubMed/NCBI
|
|
31
|
Peters JL, Sutton AJ, Jones DR, et al:
Comparison of two methods to detect publication bias in
meta-analysis. JAMA. 295:676–680. 2006. View Article : Google Scholar : PubMed/NCBI
|
|
32
|
Wright M, Woodrow G, O'Brien S, et al:
Cholecystokinin and leptin: their influence upon the eating
behaviour and nutrient intake of dialysis patients. Nephrol Dial
Transplant. 19:133–140. 2004. View Article : Google Scholar : PubMed/NCBI
|
|
33
|
Vignioble M, Brichard S, Jadoul M and
Goffin E: Serum leptin concentration in peritoneal dialysis
patients: determinants, longitudinal evolution and circadian
rhythm. Acta Clin Belg. 56:173–179. 2001. View Article : Google Scholar : PubMed/NCBI
|
|
34
|
Tsujimoto Y, Shoji T, Tabata T, et al:
Leptin in peritoneal dialysate from continuous ambulatory
peritoneal dialysis patients. Am J Kidney Dis. 34:832–838. 1999.
View Article : Google Scholar : PubMed/NCBI
|
|
35
|
Malyszko J, Malyszko JS and Mysliwiec M:
Visfatin and endothelial function in dialyzed patients. Nephrology
(Carlton). 15:190–196. 2010. View Article : Google Scholar : PubMed/NCBI
|
|
36
|
Małgorzewicz S, Lichodziejewska-Niemierko
M, Aleksandrowicz-Wrona E, et al: Adipokines, endothelial
dysfunction and nutritional status in peritoneal dialysis patients.
Scand J Urol Nephrol. 44:445–451. 2010. View Article : Google Scholar : PubMed/NCBI
|
|
37
|
Landt M, Parvin CA, Dagogo-Jack S, et al:
Leptin elimination in hyperleptinaemic peritoneal dialysis
patients. Nephrol Dial Transplant. 14:732–737. 1999. View Article : Google Scholar : PubMed/NCBI
|
|
38
|
Johansen KL, Mulligan K, Tai V and
Schambelan M: Leptin, body composition and indices of malnutrition
in patients on dialysis. J Am Soc Nephrol. 9:1080–1084.
1998.PubMed/NCBI
|
|
39
|
Buyan N, Bideci A, Ozkaya O, et al: Leptin
and resistin levels and their relationships with glucose metabolism
in children with chronic renal insufficiency and undergoing
dialysis. Nephrology (Carlton). 11:192–196. 2006. View Article : Google Scholar : PubMed/NCBI
|
|
40
|
Yang FF, Lin X, Wang J and Luo ZW: Effect
observation of peritoneal dialysis on clearance of hyperleptinemia
and inflammatory factor in uremic patients. Chongqing Yi Yao.
40:34–35,37. 2011.(In Chinese).
|
|
41
|
Xu XD, Hu P, Wang NS, et al: The
relationship between leptin and nutrition status in patients with
chronic renal failure undergoing different ways of blood
purification. Xuzhou Yi Ke Da Xue. 28:85–88. 2008.(In Chinese).
|
|
42
|
Wu R, Ma K and Wang J: Analysis of serum
leptin and inflammatory cytokines in peritoneal dialysis clear
uremic patients. Chin and Foreign Health Abstract. 8:468. 2011.
|
|
43
|
Wu JQ, Zhou ZS, Pan ZX and Li HZ: An
analysis for the relationship between leptin and the nutrition
status in peritoneal dialysis patients. Zhongguo Ji Ceng Yi Yao.
13:185–186. 2006.(In Chinese).
|
|
44
|
Wang ZM, Wang Q and Yu JS: Effects of
peritoneal dialysis on indexes in patients with chronic renal
failure. Xian Dai Zhong Xi Yi Jie He Za Zhi. 19:1185–1186, 1226.
2010.(In Chinese).
|
|
45
|
Zuo J, Zou JZ, Fang Y, et al: Serum leptin
levels and malnutrition in chronic renal failure. Shanghai Yi Xue.
679–682. 2002.(In Chinese).
|
|
46
|
Ma Y, Zhao J, Sun XW, et al: Serum leptin
levels and its clinical significance in patients with different
stages of chronic renal failure. Zhong Guo Xian Dai Yi Yao Za Zhi.
13:42–45. 2011.(In Chinese).
|
|
47
|
Guan X and Zheng HG: Analysis of leptin
levels in peritoneal dialysis patients and its influencing factors.
Zhong Guo Shi Yong Nei Ke Za Zhi. 26:19–21. 2006.(In Chinese).
|
|
48
|
An WS, Son YK, Kim SE, et al: Association
of adiponectin and leptin with serum lipids and erythrocyte omega-3
and omega-6 fatty acids in dialysis patients. Clin Nephrol.
75:195–203. 2011. View
Article : Google Scholar : PubMed/NCBI
|
|
49
|
Hou N and Luo JD: Leptin and
cardiovascular diseases. Clin Exp Pharmacol Physiol. 38:905–913.
2011. View Article : Google Scholar : PubMed/NCBI
|
|
50
|
Díez JJ, Bossola M, Fernández-Reyes MJ, et
al: Relationship between leptin and all-cause and cardiovascular
mortality in chronic hemodialysis patients. Nefrologia. 31:206–212.
2011.PubMed/NCBI
|
|
51
|
Golembiewska E, Safranow K, Ciechanowski
K, et al: Adipokines and parameters of peritoneal membrane
transport in newly started peritoneal dialysis patients. Acta
Biochim Pol. 60:617–621. 2013.PubMed/NCBI
|
|
52
|
Beberashvili I, Sinuani I, Azar A, et al:
Longitudinal study of leptin levels in chronic hemodialysis
patients. Nutr J. 10:682011. View Article : Google Scholar : PubMed/NCBI
|
|
53
|
Ponce D, Caramori JT, Barretti P and Balbi
AL: Peritoneal dialysis in acute kidney injury: Brazilian
experience. Perit Dial Int. 32:242–246. 2012. View Article : Google Scholar : PubMed/NCBI
|
|
54
|
Fontán MP, Rodríguez-Carmona A, Cordido F
and García-Buela J: Hyperleptinemia in uremic patients undergoing
conservative management, peritoneal dialysis and hemodialysis: A
comparative analysis. Am J Kidney Dis. 34:824–831. 1999. View Article : Google Scholar : PubMed/NCBI
|
|
55
|
Tsai JP, Tsai CC, Liu HM, et al:
Hyperleptinaemia positively correlated with metabolic syndrome in
hemodialysis patients. Eur J Intern Med. 22:e105–e109. 2011.
View Article : Google Scholar : PubMed/NCBI
|