Introduction
Breast cancer is a malignant type of tumor with the
highest incidence in women, and it seriously affects the quality of
life of patients (1). The occurrence
of breast cancer is considered to be the result of the abnormal
expression of numerous genes. The overexpression of a variety of
oncogenes and tumor suppressor gene deletion, mutation or low
expression accompany carcinogenesis (2,3).
However, the mechanism of the occurrence and development of breast
cancer remains incompletely understood, and numerous genes and
their functions remain to be discovered and understood. A certain
theoretical basis for further study of the pathogenesis of breast
cancer is provided by the screening of differentially expressed
(DE) genes in breast cancer tissue and normal breast tissue and
analyzing the pathways in which these genes are enriched using
biological information (4,5).
Experimental high-throughput genomics has identified
a number of notable genes, including DE genes having significant
changes in expression level. A main task in bioinformatics is to
elucidate the biological significance of these genes. Based on a
variety of biological knowledge databases such as the Gene Ontology
(GO) database and the Kyoto Encyclopedia of Genes and Genomes
(KEGG) pathway database, numerous research groups are systemically
analyzing the biological processes and single pathways associated
with the enriched genes using a variety of statistical analysis
strategies. At present, studies have clearly shown that UBE2C
(6,7), EGFR (8)
and interferon regulatory factor binding protein 2 (IRF2BP2)
(9) are DE genes associated with the
development of breast cancer. Further study of these genes may be
helpful in preventing the occurrence of this disease.
Pathways can affect each other through a phenomenon
known as crosstalk, rather than acting independently (10). Although it is evident that different
pathways could influence each other, particularly when there is an
overlap of DE genes having significant changes in expression level,
the presence and extent of this phenomenon have not been rigorously
studied. Identification of the interaction of pathways has
important implications for the understanding of numerous diseases;
it may contribute to their prevention and treatment by enabling
inhibition of the interaction among pathways, which may play a key
role in the invasion and proliferation of cancer cells (11–13).
Wang et al (14) showed that
EGFR activity was increased in a PTGS2 (COX-2) transgenic mouse and
that forced expression of PTGS2 (COX-2) in human colorectal cancer
(CRC) cells stimulated cellular proliferation. In addition, it was
demonstrated that a crosstalk of PTGS2 (COX-2) and EGFR pathways
synergistically promoted CRC progression and metastasis. The study
conducted by Krysan et al (15) indicated that PGE2 was able to induce
the proliferation of colon and lung cancer cells through the
activation of MAPK in an EGFR-independent manner in vitro.
Wang et al (16) generated a
mouse model characterized by the co-expression of activated forms
of AKT and Ras in the liver. The results indicated that concomitant
suppression of AKT/mTOR and Ras/MAPK pathways was highly
detrimental for the growth of AKT/Ras-expressing cells in
vitro. This finding has important implications for the
understanding of HCC pathogenesis and its prevention.
The identification of DE genes and the pathways
involved in the development of disease has been the subject of
numerous studies. However, in many cases the crosstalk between
pathways was not investigated, and the enriched DE genes and the
most important pathway were not identified. In the present study, 5
sets of breast cancer data were downloaded from the Gene Expression
Omnibus (GEO) platform and analyzed with the RankProd package
(17) to detect DE genes. The
pathways in which the DE genes were enriched were identified by the
gene set enrichment analysis (GSEA) (18,19)
method. The DE genes that overlapped between pathways were
identified for further analysis. A network diagram of crosstalk
among these pathways was constructed based on the overlapping DE
genes with the aim of identifying the main pathway on the basis of
the connections with other pathways.
Materials and methods
Detection of differentially expressed
genes
The study design was to obtain experimental data for
breast cancer from a genomic database, and to identify DE genes and
their pathways from the data using analytical software. The aim was
to obtain an improved understanding of the interaction among
pathways by analyzing the crosstalk of pathways.
Five biological data sets for breast cancer
(E-GEOD-29431, E-GEOD-3744, E-GEOD-42568, E-GEOD-50567 and
E-GEOD-7904) from different experimental origins were downloaded
from the Gene Expression Omnibus (GEO) database (http://www.ncbi.nlm.nih.gov/geo/). There were 281
breast cancer samples and 69 normal samples in total. After
pretreating these data by RAM, quantiles and median polish
summarization methods, unqualified chips were eliminated leaving
only qualified data to enter the next step. The gene expression
values of all data were transformed to a comparable level, which
provided a digital expression profile for subsequent analysis. As
the 5 sets of data were from different experiments, DE genes were
detected using RankProd (http://www.bioconductor.org/packages/release/bioc/html/RankProd.html),
which is a powerful meta-analysis tool for integrating multiple
array datasets from various experimental platforms. In this
analysis, T and C represent two experimental conditions (treatment
versus control), and there are nT and nC replicates in the first
dataset, mT and mC, sT and sC, wT and wC, and fT and fC replicates
in the second, third, fourth and fifth data sets, respectively. The
rank product for each gene (RPg) was calculated using
the following formula:
rgi is the rank of the gth gene
under ith comparison. i=1, …, K, where K = (nT × nC)
+ (mT × mC) + (sT × sC) + (wT × wC) + (fT × fC). The genes with
|logFC|>2 and percentage of false predictions (pfp)<0.01 were
considered differentially expressed.
GSEA
Following the detection of DE genes from the 5
breast cancer data sets, the next step was to find pathways in
which DE genes were enriched using gene enrichment analysis. There
are three types of common gene enrichment analysis: singular
enrichment analysis (SEA), GSEA and modular enrichment analysis
(MEA). In this study, a broader application of the GSEA (20) analysis method was used. The prior
knowledge of biology such as that available from KEGG (http://www.genome.jp/kegg/) was used to identify a set
of genomes. Each genome was given an enrichment score (ES) by
statistical calculation, the difference in significance level of
the ES for different groups was detected (i.e., breast cancer and
normal), then the significance level was adjusted to P<0.05 to
obtain a list of enriched gene pathways.
The ES was calculated as follows:
S indicates the biological pathway,
rj is the correlation of gene and phenotype,
M is the number of genes in S and N is the
total number of DE genes in the KEGG database. P is used to correct
the ES; it avoids erroneous inferences when the gene is
located in the middle of gene set, as they would otherwise yield
high ES values. Hit(S,i) indicates the total increase in the
ES for cases when gene i belongs to S;
Miss(S,i) indicates the total reduction in ES for cases when
gene i does not belong to S.
Pathway crosstalk network
analysis
The interactions between pathways that were obtained
by the GSEA method were analyzed. It was assumed that if DE genes
overlapped between pathways, an interaction existed between the
pathways. If the number of DE genes that overlapped between
pathways was >5, the two pathways were considered to have a
strong interaction. Under these conditions, a network diagram was
designed, programmed and constructed in order to represent the
crosstalk between pathways visually.
The formula used was as follows:
D indicates the degree of interaction between
pathways. NOD indicates the number of DE genes
that are overlapped, i and J represent DEGs in two
different pathways. When i=j, NOD
increases one; when i≠j, NOD is unchanged.
ΣNOD ≥5 indicates a strong connection, whereas
ΣNOD <5 indicates a normal connection.
The total number of DE genes in a pathway
overlapping with another pathway is Psum; the pathway with the
maximum number (MaxPsum) was considered to be the central
pathway.
Results
Detection of DE genes between breast
cancer and normal breast tissue
DE genes were identified between breast cancer and
normal breast tissue. Genes that were upregulated and
downrregulated, respectively, in breast cancer compared with normal
tissue were identified. Analysis of the DE genes revealed that
there were 1,464 DE genes in total, including 1,038 upregulated
genes and 426 downregulated genes that had an estimated pfp<0.01
and |logFC|>2.
Pathway enrichment analysis
The majority of the pathways that were identified by
the GSEA method to be significant (P<0.05) were cancer-related
signaling pathways (Table I), for
example, Pathways in cancer, Prostate cancer, Small cell lung
cancer, peroxisome proliferator-activated receptor (PPAR) signaling
pathway and p53 signaling pathway. As can be seen in Table I, a total of 26 pathways were
included following enrichment analysis and the majority of the DE
genes, with a count of 55, were contained in Pathways in cancer.
The significance level (P<0.001) of the top five pathways in the
list suggests the high reliability of the enrichment analysis.
 | Table I.Significant pathways. |
Table I.
Significant pathways.
| KEGG ID | Term | Count | P-value |
|---|
| 04512 | ECM-receptor
interaction | 25 | 1.99E-07 |
| 04510 | Focal adhesion | 43 | 3.87E-07 |
| 05200 | Pathways in
cancer | 55 | 2.95E-05 |
| 05144 | Malaria | 13 | 5.66E-04 |
| 03320 | PPAR signaling
pathway | 16 | 7.59E-04 |
| 04110 | Cell cycle | 23 | 1.69E-03 |
| 04115 | p53 signaling
pathway | 14 | 5.14E-03 |
| 05222 | Small cell lung
cancer | 16 | 8.33E-03 |
| 05218 | Melanoma | 14 | 8.75E-03 |
| 00565 | Ether lipid
metabolism | 8 | 8.89E-03 |
| 04530 | Tight junction | 22 | 8.95E-03 |
| 04270 | Vascular smooth
muscle contraction | 19 | 9.89E-03 |
| 04114 | Oocyte meiosis | 19 | 9.89E-03 |
| 04520 | Adherens
junction | 14 | 9.91E-03 |
| 04350 | TGF-β signaling
pathway | 15 | 1.21E-02 |
| 05215 | Prostate
cancer | 16 | 1.29E-02 |
| 04610 | Complement and
coagulation cascades | 13 | 1.29E-02 |
| 04710 | Circadian rhythm -
mammal | 6 | 1.37E-02 |
| 04914 |
Progesterone-mediated oocyte
maturation | 15 | 1.67E-02 |
| 04614 | Renin-angiotensin
system | 5 | 2.12E-02 |
| 00982 | Drug metabolism -
cytochrome P450 | 11 | 2.81E-02 |
| 00564 | Glycerophospholipid
metabolism | 13 | 3.12E-02 |
| 04916 | Melanogenesis | 16 | 3.29E-02 |
| 05219 | Bladder cancer | 8 | 4.49E-02 |
| 05221 | Acute myeloid
leukemia | 10 | 4.60E-02 |
| 04360 | Axon guidance | 19 | 4.65E-02 |
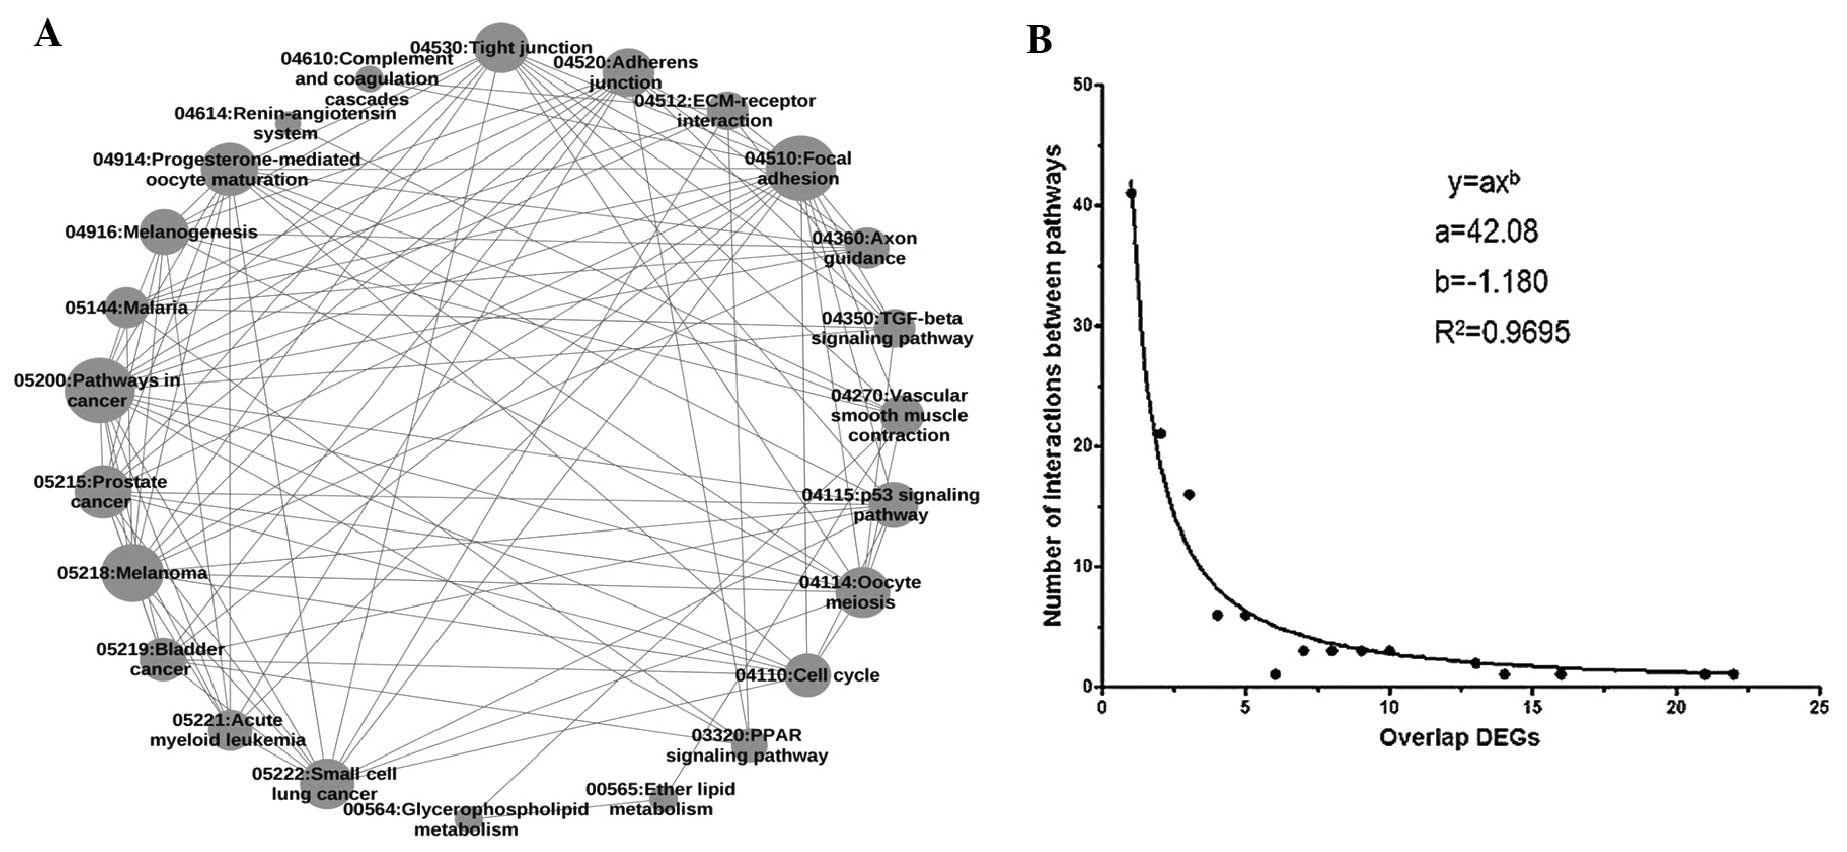
Pathway crosstalk network
analysis
According to the overlap of DE genes between
pathways, a program was designed to generate an overall network
diagram that could describe the crosstalk of all 26 pathways
(Fig. 1A). In addition, a
scattergram of overlapping DE genes in the pathway crosstalk
network was drawn (Fig. 1B). It
showed that the distribution of overlapping DE genes followed a
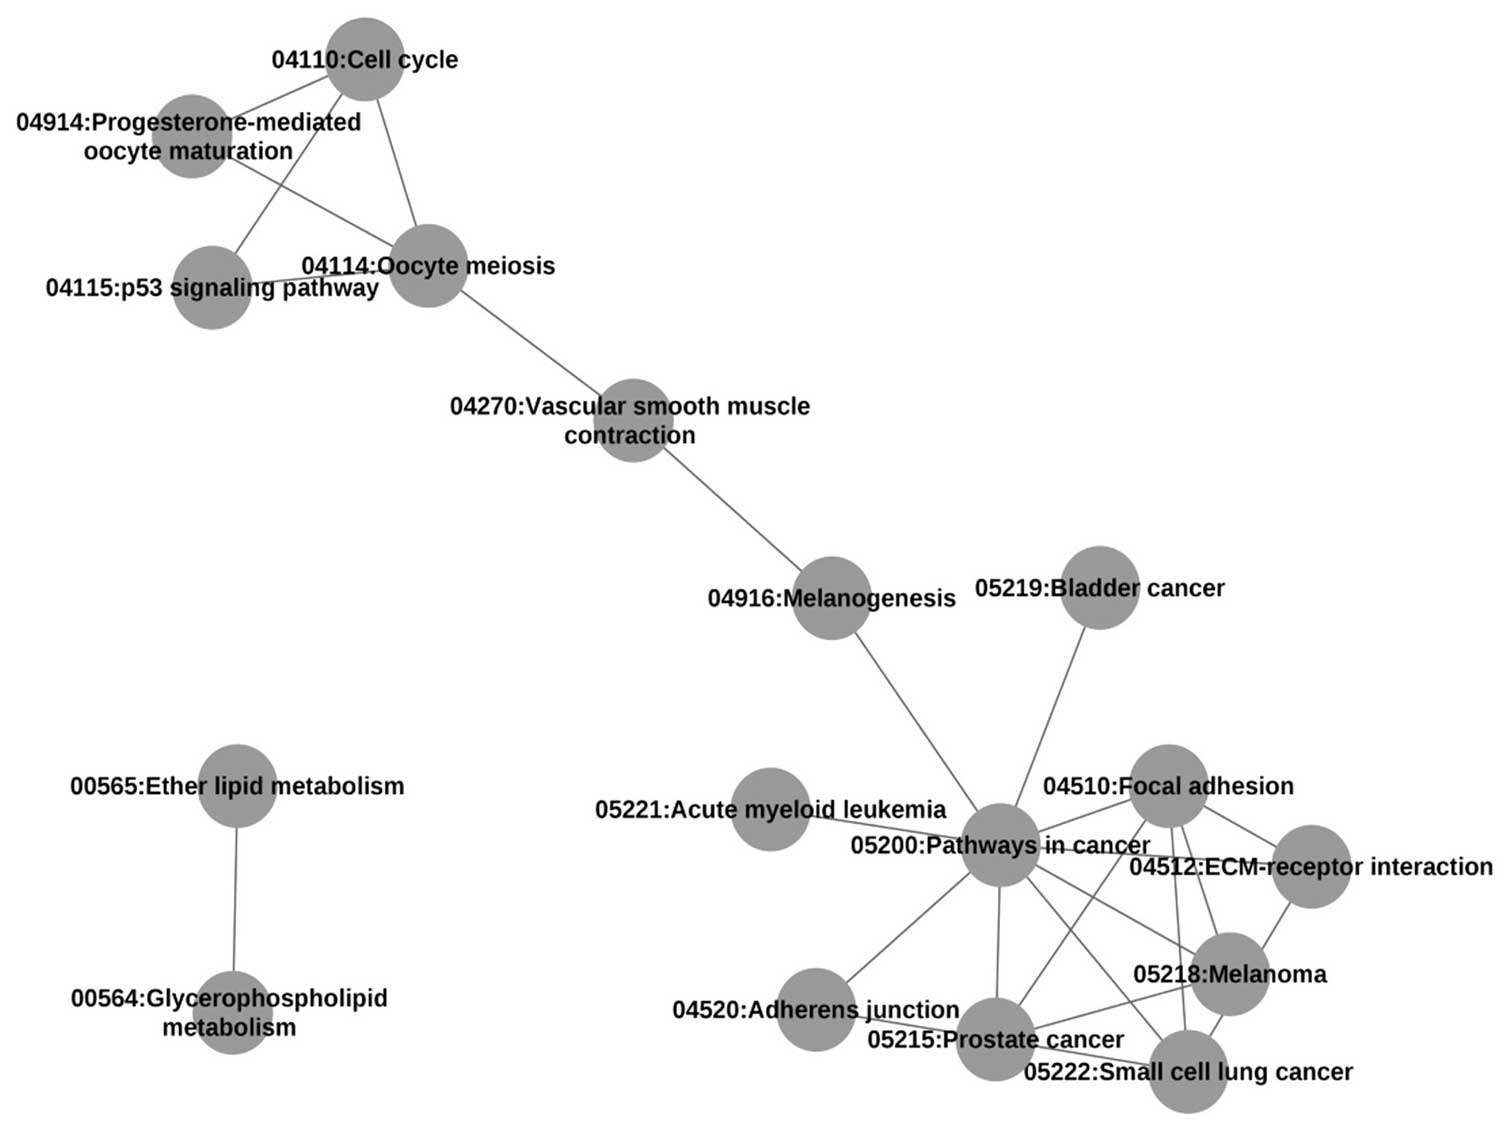
power law (y=axb, where a=42.08 and b=-1.18). In
addition, a network diagram for pathways with a high degree of
crosstalk, that is, those which contained >5 overlapping DE
genes was generated (Fig. 2) and the
main pathway was identified. It was found that the network of
pathways with strong crosstalk conformed to a scale-free network
whose pathway degree distribution followed a power law
(y=axb, where a=43.48 and b=-0.5288).
The pathways with the greatest number of DE genes
overlapping between them were the extracellular matrix
(ECM)-receptor interaction and Focal adhesion pathways, which had
22 overlapping DE genes. From the analytical results, it was found
that Pathways in cancer, the most important pathway with a MaxPsum
of 9, had DE genes that overlapped with the Focal adhesion, Small
cell lung cancer, Prostate cancer, Melanoma, ECM-receptor
interaction, Acute myeloid leukemia, Melanogenesis, Adherens
junction and Bladder cancer pathways (Table II). Furthermore, the DE genes that
overlapped between the Pathways in cancer pathway and the other 9
pathways are listed in Table
III.
| Table II.Differentially expressed genes that
overlap between the main pathway (Pathways in cancer) and 9 other
pathways. |
Table II.
Differentially expressed genes that
overlap between the main pathway (Pathways in cancer) and 9 other
pathways.
| KEGG ID | Term | Overlap DEGs | Count |
|---|
| 04510 | Focal adhesion | IGF1, EGFR, LAMA2,
PTEN, MAPK10, LAMA4, LAMC1, MET, LAMA3, LAMB2, BCL2, PDGFA, COL4A6,
FN1, PIK3R1, PDGFRA, JUN, COL4A2, LAMB3, VEGFC, ITGA6 | 21 |
| 05222 | Small cell lung
cancer | LAMA2, LAMA4,
LAMC1, PTGS2, LAMB3, LAMA3, LAMB2, BCL2, ITGA6, COL4A6, CCNE2, FN1,
E2F3, PTEN, COL4A2, PIK3R1 | 16 |
| 05215 | Prostate
cancer | IGF1, FOXO1,
TCF7L2, BCL2, FGFR1, EGFR, PDGFRA, PDGFA, PTEN, TCF7L1, CCNE2,
LEF1, E2F3, PIK3R1 | 14 |
| 05218 | Melanoma | IGF1, EGFR, FGF2,
PTEN, FGF1, MET, PDGFRA, FGFR1, PIK3R1, MITF, PDGFA, E2F3,
CDKN2A | 13 |
| 04512 | ECM-receptor
interaction | LAMA2, COL4A2,
LAMA4, LAMC1, LAMB3, LAMA3, LAMB2, ITGA6, COL4A6, FN1 | 10 |
| 05221 | Acute myeloid
leukemia | ZBTB16, CEBPA,
RUNX1T1, TCF7L2, STAT5A, STAT5B, TCF7L1, KIT, PIK3R1, LEF1 | 10 |
| 04916 | Melanogenesis | FZD4, TCF7L2, FZD5,
TCF7L1, KIT, MITF, FZD7, LEF1 | 8 |
| 04520 | Adherens
junction | EGFR, TCF7L2,
TGFBR, MET, TCF7L1, FGFR1, LEF1 | 7 |
| 05219 | Bladder cancer | EGFR, VEGFC, MMP1,
MMP9, FGFR3, E2F3, CDKN2A | 7 |
| Table III.Degree of connection among
pathways. |
Table III.
Degree of connection among
pathways.
| KEGG ID | Pathway name | Psum |
|---|
| 04270 | Vascular smooth
muscle contraction | 2 |
| 00564 | Glycerophospholipid
metabolism | 1 |
| 00565 | Ether lipid
metabolism | 1 |
| 04115 | p53 signaling
pathway | 2 |
| 05219 | Bladder cancer | 1 |
| 04520 | Adherens
junction | 2 |
| 04916 | Melanogenesis | 2 |
| 04914 |
Progesterone-mediated oocyte
maturation | 2 |
| 04114 | Oocyte meiosis | 4 |
| 04110 | Cell cycle | 3 |
| 05221 | Acute myeloid
leukemia | 1 |
| 05218 | Melanoma | 3 |
| 05215 | Prostate
cancer | 5 |
| 05222 | Small cell lung
cancer | 4 |
| 05200 | Pathways in
cancer | 9 |
| 04510 | Focal adhesion | 5 |
| 04512 | ECM-receptor
interaction | 3 |
Discussion
Overall, 1,464 DE genes were detected from 5 breast
cancer data sets and 26 pathways were identified by the GSEA
method. Network diagrams of normal and strong crosstalk between
pathways were constructed and Pathways in cancer was identified as
the main pathway.
The hypothesis that the occurrence of breast cancer
is the result of the abnormal expression of numerous genes
(2) was confirmed. It is urgently
necessary to identify genes that undergo changes in expression
level in the process of breast cancer development in order to
prevent the occurrence and development of tumors. Although numerous
studies of DE genes in breast cancer have been conducted, the
results have not been uniform (21,22). The
methods for detecting DE genes from microarray data are the
significance analysis of microarrays (SAM) method (23), two sample t-test (24), Bonferroni correction and the
Benjamini and Hochberg method (25).
In the present study, the RankProd method was applied, which can
analyze data sets of multiple origins simultaneously, and also
offers several advantages including the biologically intuitive
fold-change (FC) criterion, fewer assumptions under the model, and
low numbers of replicates (26). A
total of 1,464 DE genes were identified from the 5 experimental
data sets through analysis. Among them, certain DE genes were
consistent with those identified in previous studies, for instance,
EGFR (8), BCL2 (27) and FN1 (28).
A broader application of the GSEA analysis method
was used to conduct pathway enrichment analysis. The enrichment
analysis strategy has two advantages: i) It reduces the impact of
DE gene selection on the enrichment analysis; and ii) all the
information from the chip experiments is used. The GSEA analysis
identified 26 pathways enriched in DE genes, and the top ranked DE
gene-enriched pathways were Pathways in cancer, Focal adhesion and
ECM-receptor interaction. This finding was consistent a previous
study in which certain pathways, such as Pathways in cancer and
Cell cycle, were identified (29).
Huan et al (29) determined
the changes in metabolic pathways at different time points after
the treatment of breast cancer samples with estradiol, using KEGG
pathway enrichment analysis for the DE genes. They concluded that
the changes were mainly focused on the Pathways in cancer, Focal
adhesion, and Chemokine signaling pathways.
Due to the fast-growing human interactome knowledge
base, network-based approaches have become increasingly powerful
and informative for the study of disease mechanisms (30). Computational methods have been
proposed for the detection of disease-related networks, including
co-expression (31), protein-protein
interaction (PPI) (32), protein
phosphorylation (33) and DNA
methylation (34) networks. To the
best of our knowledge, no previous study has constructed a network
based on overlapping DE genes and identified the most significant
pathway in breast cancer using RankProd and GSEA methods.
Furthermore, the present study showed overlapping genes in all
pathways. Among them, EGFR (35),
IGF-1 (36), E2F3 (37) are associated with lung cancer,
prostate cancer and other diseases, which may be helpful for the
study of diseases by understanding of these pathways. Although the
crosstalk between pathways was analyzed and the main pathway was
identified, further evaluation of how the pathways effect each
other would be worthwhile. In addition, as high-throughput genomic
technologies become more affordable and accurate, their use is
likely to become more prevalent in the identification of candidate
genes in the future.
References
|
1
|
Igene H: Global health inequalities and
breast cancer: An impending public health problem for developing
countries. Breast J. 14:428–434. 2008. View Article : Google Scholar : PubMed/NCBI
|
|
2
|
Chia S, Norris B, Speers C, et al: Human
epidermal growth factor receptor 2 overexpression as a prognostic
factor in a large tissue microarray series of node-negative breast
cancers. J Clin Oncol. 26:5697–5704. 2008. View Article : Google Scholar : PubMed/NCBI
|
|
3
|
Planas-Silva MD, Bruggeman RD, Grenko RT
and Smith JS: Overexpression of c-Myc and Bcl-2 during progression
and distant metastasis of hormone-treated breast cancer. Exp Mol
Pathol. 82:85–90. 2007. View Article : Google Scholar : PubMed/NCBI
|
|
4
|
Ota D, Mimori K, Yokobori T, et al:
Identification of recurrence-related microRNAs in the bone marrow
of breast cancer patients. Int J Oncol. 38:955–962. 2011.PubMed/NCBI
|
|
5
|
Ohira M and Nakagawara A: Global genomic
and RNA profiles for novel risk stratification of neuroblastoma.
Cancer Sci. 101:2295–2301. 2010. View Article : Google Scholar : PubMed/NCBI
|
|
6
|
Fujita T, Ikeda H, Kawasaki K, Taira N,
Ogasawara Y, Nakagawara A and Doihara H: Clinicopathological
relevance of UbcH10 in breast cancer. Cancer Sci. 100:238–248.
2009. View Article : Google Scholar : PubMed/NCBI
|
|
7
|
Berlingieri MT, Pallante P, Sboner A, et
al: UbcH10 is overexpressed in malignant breast carcinomas. Eur J
Cancer. 43:2729–2735. 2007. View Article : Google Scholar : PubMed/NCBI
|
|
8
|
Wang S, Chen C, Meng Y, et al: Effective
suppression of breast tumor growth by an anti-EGFR/ErbB2 bispecific
antibody. Cancer Lett. 325:214–219. 2012. View Article : Google Scholar : PubMed/NCBI
|
|
9
|
Tinnikov AA, Yeung KT, Das S and Samuels
HH: Identification of a novel pathway that selectively modulates
apoptosis of breast cancer cells. Cancer Res. 69:1375–1382. 2009.
View Article : Google Scholar : PubMed/NCBI
|
|
10
|
Donato M, Xu Z, Tomoiaga A, et al:
Analysis and correction of crosstalk effects in pathway analysis.
Genome Res. 23:1885–1893. 2013. View Article : Google Scholar : PubMed/NCBI
|
|
11
|
Bradley EW, Ruan MM, Vrable A and Oursler
MJ: Pathway crosstalk between Ras/Raf and PI3K in promotion of
M-CSF-induced MEK/ERK-mediated osteoclast survival. J Cell Biochem.
104:1439–1451. 2008. View Article : Google Scholar : PubMed/NCBI
|
|
12
|
Gerits N, Kostenko S, Shiryaev A,
Johannessen M and Moens U: Relations between the mitogen-activated
protein kinase and the cAMP-dependent protein kinase pathways:
Comradeship and hostility. Cell Signal. 20:1592–1607. 2008.
View Article : Google Scholar : PubMed/NCBI
|
|
13
|
Pham H, Chong B, Vincenti R and Slice LW:
Ang II and EGF synergistically induce COX-2 expression via CREB in
intestinal epithelial cells. J Cell Physiol. 214:96–109. 2008.
View Article : Google Scholar : PubMed/NCBI
|
|
14
|
Wang D, Xia D and Dubois RN: The crosstalk
of PTGS2 and EGF signaling pathways in colorectal cancer. Cancers
(Basel). 3:3894–3908. 2011. View Article : Google Scholar : PubMed/NCBI
|
|
15
|
Krysan K, Reckamp KL, Dalwadi H, Sharma S,
Rozengurt E, Dohadwala M and Dubinett SM: Prostaglandin E2
activates mitogen-activated protein kinase/Erk pathway signaling
and cell proliferation in non-small cell lung cancer cells in an
epidermal growth factor receptor-independent manner. Cancer Res.
65:6275–6281. 2005. View Article : Google Scholar : PubMed/NCBI
|
|
16
|
Wang C, Cigliano A, Delogu S, Armbruster
J, et al: Functional crosstalk between AKT/mTOR and Ras/MAPK
pathways in hepatocarcinogenesis: Implications for the treatment of
human liver cancer. Cell Cycle. 12:1999–2010. 2013. View Article : Google Scholar : PubMed/NCBI
|
|
17
|
Hong FX, Breitling R, McEntee CW, Wittner
BS, Nemhauser JL and Chory J: A bioconductor package for detecting
differentially expressed genes in meta-analysis. Bioinformatics.
22:2825–2827. 2006. View Article : Google Scholar : PubMed/NCBI
|
|
18
|
Mootha VK, Lindgren CM, Eriksson KF, et
al: PGC-1alpha-responsive genes involved in oxidative
phosphorylation are coordinately downregulated in human diabetes.
Nat Genet. 34:267–273. 2003. View
Article : Google Scholar : PubMed/NCBI
|
|
19
|
Suárez-Fariñas M, Lowes MA, Zaba LC and
Krueger JG: Evaluation of the psoriasis transcriptome across
different studies by gene set enrichment analysis (GSEA). PLoS ONE.
5:e102472010. View Article : Google Scholar : PubMed/NCBI
|
|
20
|
Subramanian A, Tamayo P, Mootha VK, et al:
Gene set enrichment analysis: A knowledge-based approach for
interpreting genome-wide expression profiles. Proc Natl Acad Sci
USA. 102:15545–15550. 2005. View Article : Google Scholar : PubMed/NCBI
|
|
21
|
Lisowska KM, Dudaladava V, Jarzab M, et
al: BRCA1-related gene signature in breast cancer: The role of ER
status and molecular type. Front Biosci (Elite Ed). 3:125–136.
2011. View Article : Google Scholar : PubMed/NCBI
|
|
22
|
Richardson AL, Wang ZC, De Nicolo A, et
al: X chromosomal abnormalities in basal-like human breast cancer.
Cancer Cell. 9:121–132. 2006. View Article : Google Scholar : PubMed/NCBI
|
|
23
|
Efron B and Tibshirani R: Empirical Bayes
methods and false discovery rates for microarrays. Genet Epidemiol.
23:70–86. 2002. View Article : Google Scholar : PubMed/NCBI
|
|
24
|
Cui X and Churchill GA: Statistical tests
for differential expression in cDNA microarray experiments. Genome
Biol. 4:2102003. View Article : Google Scholar : PubMed/NCBI
|
|
25
|
Yekutieli D and Benjamini Y:
Resampling-based false discovery rate controlling multiple test
procedures for correlated test statistics. J Stat Plan Inference.
82:171–196. 1999. View Article : Google Scholar
|
|
26
|
Breitling R and Herzyk P: Rank-based
methods as a non-parametric alternative of the T-statistic for the
analysis of biological microarray data. J Bioinform Comput Biol.
3:1171–1189. 2005. View Article : Google Scholar : PubMed/NCBI
|
|
27
|
Long JM, Bell CW, Fagg WS IV, et al:
Microarray and pathway analysis reveals decreased CDC25A and
increased CDC42 associated with slow growth of BCL2 overexpressing
immortalized breast cell line. Cell Cycle. 7:3062–3073. 2008.
View Article : Google Scholar : PubMed/NCBI
|
|
28
|
Bissell MJ, Radisky DC, Rizki A, Weaver VM
and Petersen OW: The organizing principle: Microenvironmental
influences in the normal and malignant breast. Differentiation.
70:537–546. 2002. View Article : Google Scholar : PubMed/NCBI
|
|
29
|
Huan J, Wang L, Xing L, et al: Insights
into significant pathways and gene interaction networks underlying
breast cancer cell line MCF-7 treated with 17β-estradiol (E2).
Gene. 533:346–355. 2014. View Article : Google Scholar : PubMed/NCBI
|
|
30
|
del Sol A, Balling R, Hood L and Galas D:
Diseases as network perturbations. Curr Opin Biotechnol.
21:566–571. 2010. View Article : Google Scholar : PubMed/NCBI
|
|
31
|
Miller JA, Oldham MC and Geschwind DH: A
systems level analysis of transcriptional changes in Alzheimer's
disease and normal aging. J Neurosci. 28:1410–1420. 2008.
View Article : Google Scholar : PubMed/NCBI
|
|
32
|
Shao L, Wang L, Wei Z, et al: Dynamic
network of transcription and pathway crosstalk to reveal molecular
mechanism of MGd-treated human lung cancer cells. PLoS ONE.
7:e319842012. View Article : Google Scholar : PubMed/NCBI
|
|
33
|
Tian M, Chen X, Xiong Q, et al:
Phosphoproteomic analysis of protein phosphorylation networks in
Tetrahymena thermophila, a model single-celled organism. Mol
Cell Proteomics. 13:503–519. 2014. View Article : Google Scholar : PubMed/NCBI
|
|
34
|
Bartlett TE, Olhede SC and Zaikin A: A DNA
methylation network interaction measure, and detection of network
oncomarkers. PLoS ONE. 9:e845732014. View Article : Google Scholar : PubMed/NCBI
|
|
35
|
Remon J, Morán T, Reguart N, Majem M,
Carcereny E and Lianes P: Beyond EGFR TKI in EGFR-mutant non-small
cell lung cancer patients: Main challenges still to be overcome.
Cancer Treat Rev. 40:723–729. 2014. View Article : Google Scholar : PubMed/NCBI
|
|
36
|
Wang Z, Wang Z, Liang Z, et al: Expression
and clinical significance of IGF-1, IGFBP-3, and IGFBP-7 in serum
and lung cancer tissues from patients with non-small cell lung
cancer. Onco Targets Ther. 6:1437–1444. 2013.PubMed/NCBI
|
|
37
|
Bilke S, Schwentner R, Yang F, et al:
Oncogenic ETS fusions deregulate E2F3 target genes in Ewing sarcoma
and prostate cancer. Genome Res. 23:1797–1809. 2013. View Article : Google Scholar : PubMed/NCBI
|