Introduction
Activated T cells rely on aerobic glycolysis and
glutaminolysis in order to proliferate and differentiate into
effector T cells (1,2). Intervention in these metabolic pathways
inhibits the proliferation of activated T cells and their
differentiation to effector cells. For example, treatment of
activated T cells with 2-deoxy-D-glucose abrogates their
proliferation and differentiation into effector T cells by
inhibiting glycolysis at the level of hexokinase II (HKII)
(3,4). A similar effect is yielded by treatment
with dichloroacetate, which activates pyruvate dehydrogenase (PDH)
through the inhibition of pyruvate dehydrogenase kinase (PDK)
(3,5). The PDH dehydrogenase regulates the
influx of pyruvate into the mitochondria, increasing the ratio of
glucose oxidation to glycolysis. Notably, indoleamine
2,3-dioxygenase, a key immunomodulatory enzyme, exerts its
suppressive effect at least in part by inhibiting aerobic
glycolysis and glutaminolysis in activated T cells (6–8).
To date, the effect of Krebs' cycle inhibition on
the proliferation of activated T cells has not been fully
evaluated. For this purpose, the present study was devised to
investigate the activity of the
3-(aryloxyacetylamino)-4-hydroxybenzoic acid derivative LW6. LW6
was originally considered to be an inhibitor of hypoxia-inducible
factor-1α (HIF-1α) (9). However, a
further study by the same investigators revealed that LW6 is a
specific malate dehydrogenase-2 (MDH2) inhibitor (10). Furthermore, the inhibition of HIF-1α
is secondary and results from its degradation due to increased
intracellular O2 induced by LW6. By inhibiting the
Krebs' cycle, LW6 decreases the production of reduced nicotinamide
adenine dinucleotide (NADH) and flavin adenine dinucleotide
(FADH2), which are electron donors required for
oxidative phosphorylation, and thus reduce O2
consumption (10). The specific
Krebs' cycle inhibitor LW6 was selected because suppression at the
MDH2 level may prevent total cell energy collapse due to
pyruvate-malate cycling. Accumulated malate exits the mitochondria
and enters the cytoplasm, where it is converted by malic enzyme to
pyruvate, which may re-enter the mitochondria and the Krebs' cycle
(11).
The aim of the present study was to evaluate the
effects of the MDH2 inhibitor LW6 on human activated T-cell
proliferation and survival. In addition, the effects of LW6 on the
levels of certain transcription factors involved in cell
proliferation, apoptosis and metabolism, and certain enzymes
associated with glucose metabolism and glutaminolysis were
evaluated, and Krebs' cycle activity was assessed.
Materials and methods
Subjects
Blood samples were collected from 8 healthy
volunteers (4 men and 4 women; 33±8 years old). Informed consent
was obtained from each individual enrolled in the study, and the
study protocol was approved by the Ethics Committee of the Medical
School, University of Thessaly (Larissa, Greece).
Isolation of T cells and culture
conditions
Peripheral blood mononuclear cells (PBMCs) were
isolated from whole blood by Ficoll-Hypaque density gradient
centrifugation (Histopaque-1077; Sigma-Aldrich, St. Louis, MO,
USA). T cells were isolated from PBMCs. This comprised the indirect
magnetic labeling of non-T cells by using a cocktail of
biotin-conjugated monoclonal antibodies and their depletion using a
Pan T cell Isolation kit (Miltenyi Biotec GmbH, Bergisch Gladbach,
Germany). Negatively selected T cells were counted using an optical
microscope Axiovert 40 C, (Carl Zeiss Light Microscopy, Göttingen,
Germany) on a Neubauer plaque. Cell viability was assessed via
trypan blue assay (Sigma-Aldrich). T cells were cultured in
RPMI-1640 medium with L-glutamine and 10 mM
4-(2-hydroxyethyl)-1-piperazineethanesulfonic acid (HEPES),
supplemented with 10% fetal bovine serum (Sigma-Aldrich) and
antibiotic-antimycotic solution (Sigma-Aldrich). All culturing was
performed at 37°C in a humidified atmosphere containing 5%
CO2.
Unstimulated T cells were used as the control cells,
whereas activated T cells were induced by stimulation with
anti-CD2, anti-CD3 and anti-CD28-conjugated beads using the T-Cell
Activation/Expansion kit (Miltenyi Biotec GmbH), with a
bead-to-cell ratio of 1:2. Stimulated T cells were cultured in the
presence or absence of LW6 (Santa Cruz Biotechnology, Inc., Dallas,
TX, USA) at a concentration of 30 µM for 72 h.
Evaluation of LW6 toxicity and its
effect on the proliferation of activated T cells
Control, stimulated or stimulated and LW6 (30
µΜ)-treated T cells were cultured in 96-well plates
(1×10⁵ cells/well) for 72 h. LW6 toxicity in the
activated T cells was evaluated by a lactate dehydrogenase (LDH)
release assay using a CytoTox Non-Radioactive Cytotoxic assay kit
(Promega Corporation, Madison, WI, USA) according to the
instructions provided by the manufacturer. Cytotoxicity was
calculated using the following equation: Cytotoxicity (%) = (LDH in
the supernatant/Total LDH) × 100.
Control, stimulated or LW6-treated stimulated T
cells were cultured in 96-well plates (1×10⁵ cells/well)
for 72 h. At the end of the 72-h period, cell proliferation was
assessed via Cell Proliferation ELISA (Roche Diagnostics,
Indianapolis, IN, USA) using bromodeoxyuridine (BrdU) labeling and
immunoenzymatic detection according to the manufacturer's
instructions. The proliferation index was calculated as the ratio
of the optical density (OD) derived from the stimulated or the
stimulated and LW6-treated T cells to the OD derived from the
control T cells.
Experiments were performed in T cells derived from
the blood of 8 individuals. In each experiment, three measurements
were made for the T cell samples obtained from each individual, and
the results are expressed as the mean of the three
measurements.
Assessment of the effect of LW6 on
HIF-1α, c-Myc, p53, cleaved caspase-3 and certain enzymes of
glucose metabolism and glutaminolysis in activated T cells
Control, stimulated or stimulated and LW6 (30
µΜ)-treated T cells were cultured in 12-well plates
(1×10⁶ cells/well) for 72 h. Subsequently, T cells were
lysed using the T-PER tissue protein extraction reagent (Pierce
Biotechnology, Inc., Rockford, IL, USA) supplemented with protease
and phosphatase inhibitors (Sigma-Aldrich and Roche Diagnostics,
respectively). Protein was quantified using a Bradford assay
(Sigma-Aldrich) and western blot analysis was performed. Equal
quantities of protein extracts (50 µg) from each sample were loaded
for electrophoresis in sodium dodecyl sulfate (SDS) polyacrylamide
gels (Invitrogen Life Technologies, Carlsbad, CA, USA).
Subsequently, proteins were transferred to polyvinylidene
difluoride (PVDF) membranes (Invitrogen Life Technologies). Blots
were incubated with primary antibody for 16 h, followed by
anti-rabbit IgG, HRP-linked secondary antibody (cat. no., #7074;
dilution, 1/1000); Cell Signaling Technology, Inc., Danvers, MA,
USA) for 30 min. A benchmark pre-stained protein ladder (Invitrogen
Life Technologies) was used as a marker. Bands were visualized via
enhanced chemiluminescent detection using a LumiSensor Plus
Chemiluminescent HRP Substrate kit (GenScript Corporation,
Piscataway, NJ, USA). In cases of reprobing PVDF blots, the
previous primary and secondary antibodies were safely removed using
Restore Western Blot Stripping Buffer (Thermo Fisher Scientific,
Rochford, IL, USA) according to the manufacturer's instructions.
The PVDF blot was then reused and western blot analysis was resumed
as previously described, using a different primary antibody.
Analysis of the bands was performed using Image J software
(National Institute of Health, Bethesda, MD, USA).
The primary antibodies used in western blot analysis
were specific for HIF-1α (cat. no., #3716; dilution, 1/500), c-Myc
(cat. no., #5605; dilution, 1/500), p53 (cat. no., #9282; dilution,
1/500), cleaved caspase-3 (cat. no., #9664; dilution, 1/500; Cell
Signaling Technology, Inc.), glucose transporter-1 (GLUT1; (cat.
no., sc-7903; dilution, 1/200; Santa Cruz Biotechnology, Inc.),
hexokinase II (HKII; (cat. no., #2867; dilution, 1/1000; Cell
Signaling Technology, Inc.), lactate dehydrogenase-A (LDH-A; cat.
no., #2012; dilution, 1/1000; Cell Signaling Technology, Inc.),
pyruvate dehydrogenase (PDH; cat. no., #2784; dilution, 1/1000;
Cell Signaling Technology, Inc.), PDH phosphorylated at serine 393
(p-PDH; cat. no., orb6670; dilution, 1/100; Biorbyt, Ltd., San
Francisco, CA, USA), glutaminase (GLS)-1 and GLS2 (cat. nos.,
#AP18036PU-N and AP17426PU-N, respectively; dilutions, 1/100; Acris
Antibodies GmbH, Herford, Germany) and β-actin (cat. no., #4967;
dilution, 1/2500; Cell Signaling Technology, Inc.).
Assessment of the effect of LW6 on
Krebs' cycle activity in activated T cells
Control, stimulated or stimulated and LW6 (30
µΜ)-treated T cells were cultured in 96-well plates
(1×10⁵ cells/well) for 72 h. Krebs' cycle activity was
assessed by colorimetric measurement of the reduction of the yellow
tetrazolium salt sodium 2,3-bis
(2-methoxy-4-nitro-5-sulfo-phenyl)-5-[(phenylamino)-carbonyl]-2H-tetrazolium
(XTT), to an orange formazan product. XTT is reduced in the plasma
membrane by trans-plasma membrane electron transport via the
electron carrier, 1-methoxy-5-methyl-phenazinium methyl sulfate
(1-methoxy-PMS), in which case the cellular reductant is reduced
NADH. NADH is derived primarily from the Krebs' cycle in the
mitochondria (12). For this
purpose, a TACS XTT assay kit (Trevigen, Gaithersburg, MD, USA) was
used according to the instructions provided by the manufacturer. An
ELISA reader (Microplate Reader PR2100; Sanofi Diagnostics Pasteur
Inc., Redmond, WA, USA) was used to determine the results of the
XTT assay. Experiments were performed in T cells derived from the
blood of 8 individuals. In each experiment three measurements were
made for each of the 8 individuals and the results are expressed as
the mean of the three measurements.
Statistical analysis
The normality of the evaluated variables was
assessed and confirmed by the one-sample Kolmogorov-Smirnov test.
For comparison of mean values between two conditions, a paired
t-test was used. For comparison of mean values among more
than two conditions, the sphericity assumption was evaluated using
Mauchly's test and, if violated, degrees of freedom were corrected
using Greenhouse-Geisser or Huynh-Feldt estimates of sphericity.
Comparison of mean values was assessed by one-way repeated-measures
analysis of variance, followed by the Bonferroni's correction test.
SPSS 13.0 software for Windows (SPSS Inc., Chicago, IL, USA) was
used for the statistical analysis. Results are expressed as the
mean ± standard deviation (SD) and P<0.05 was considered to
indicate a statistically significant difference.
For the western blot analysis, results are expressed
as optical densities (OD) derived from analysis of the bands using
Image J software (National Institute of Health). P-values were
calculated by comparing the mean values of OD. Statistical analysis
after adjustment to the control OD values was avoided to prevent
violation of the prerequisite for normal distribution of the
compared variables when applying parametric statistical tests.
Results are presented according to the OD, and the error bars
correspond to the SD. For convenience, in the text the results are
expressed after the normalization of mean values for the control
group. Similarly, the results of the XTT assay are expressed as the
OD values derived using the ELISA reader.
Representative western blotting results of two out
of the eight experiments performed are displayed in Fig. 1.
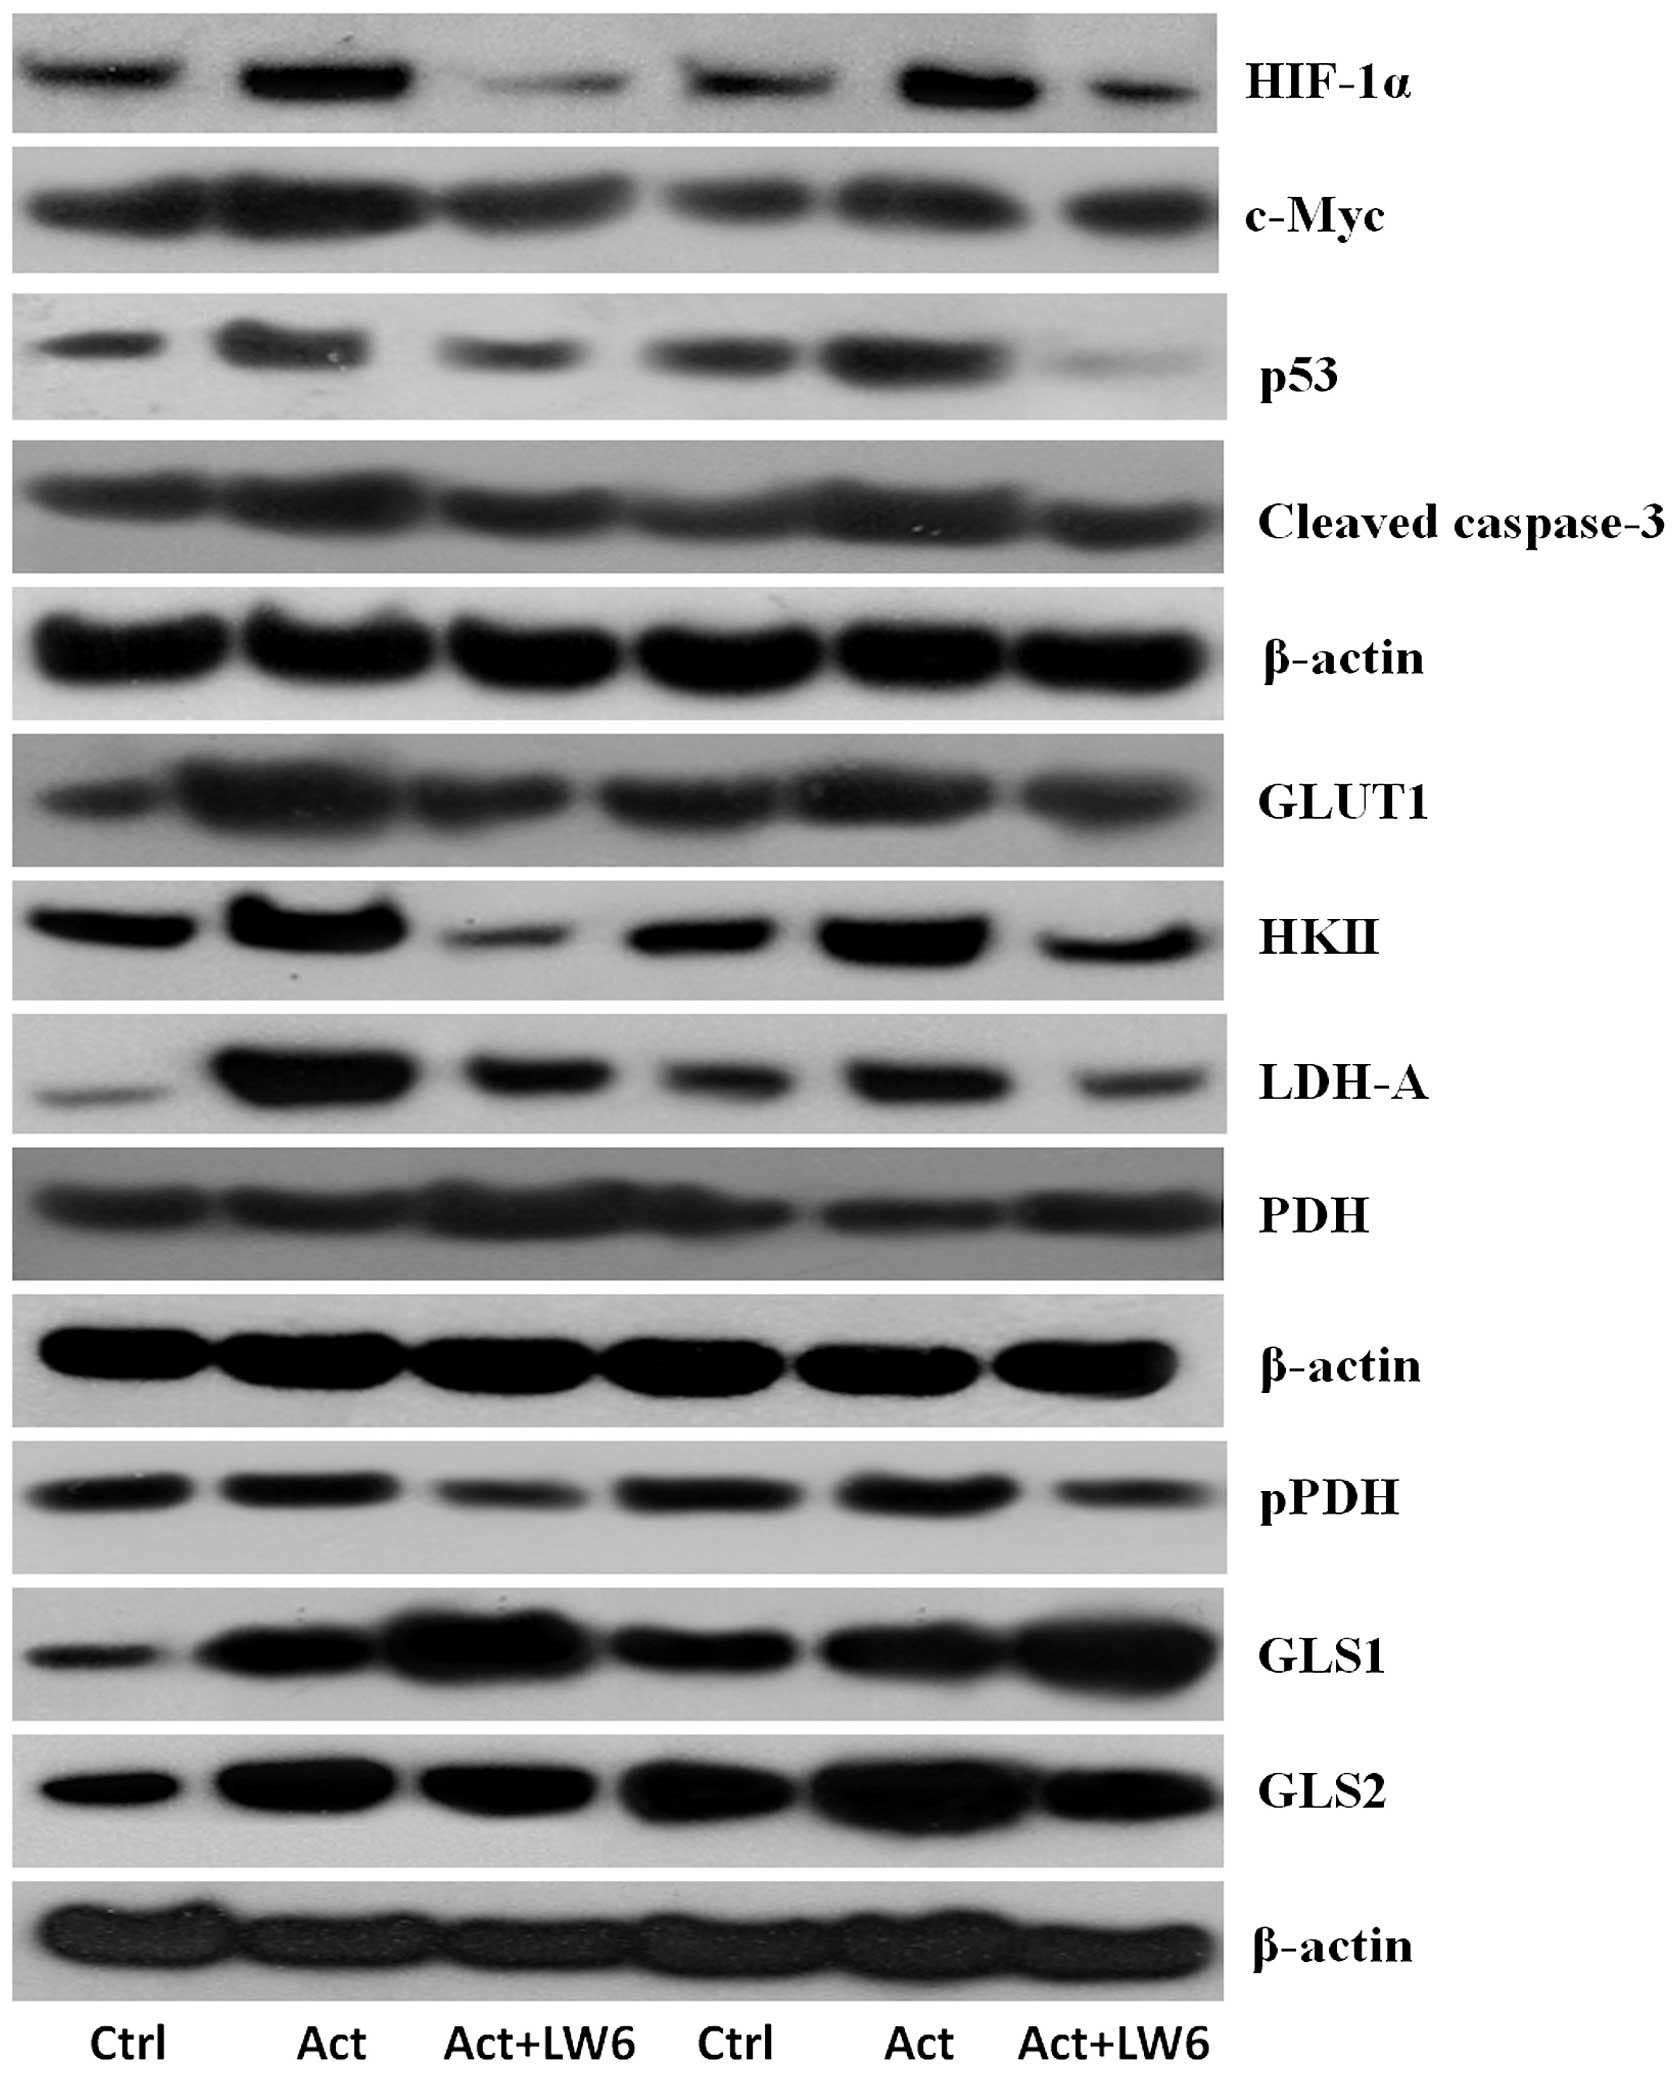 | Figure 1.Effects of the malate dehydrogenase-2
inhibitor LW6 on the levels of evaluated proteins. Western blot
lanes correspond to two of the eight performed experiments. HIF-1α,
hypoxia inducible factor-1α; GLUT1, glucose transporter-1; HKII,
hexokinase II; LDH-A, lactate dehydrogenase-A; PDH, pyruvate
dehydrogenase; pPDH, PDH phosphorylated at serine 393; GLS1,
glutaminase-1; GLS2, glutaminase-2; Ctrl, resting control T-cells;
Act, activated T-cells; Act + LW6, LW6-treated activated T
cells. |
Results
Western blotting
Representative western blotting results of two of
the eight performed experiments are displayed in Fig. 1.
LW6 is not toxic and decreases the
levels of the pro-apoptotic protein p53 and activated cleaved
caspase-3
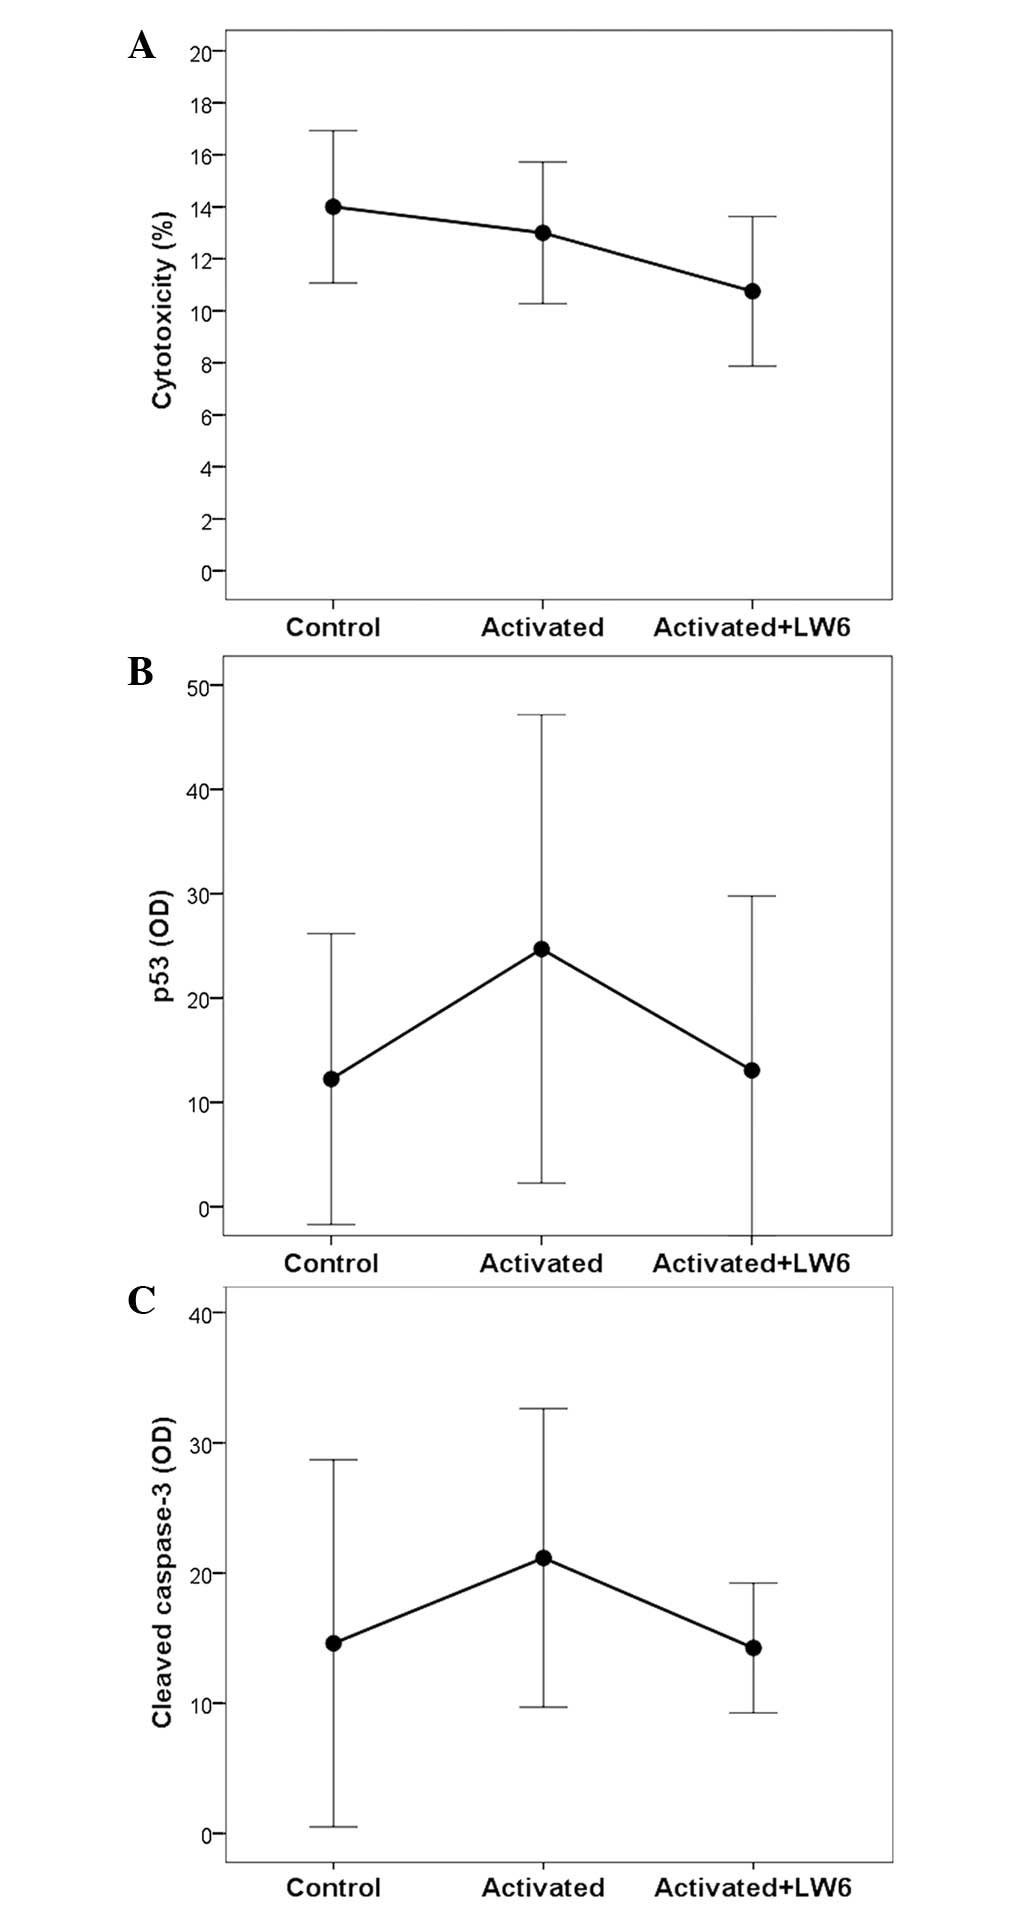
LDH release assay revealed a cytotoxicity of
14.0±1.46% in unstimulated T cells, 13±1.36% in stimulated T cells
and 10.75±1.44% in stimulated T cells treated with LW6. Comparison
of the control and stimulated T cells indicated that stimulation
was not cytotoxic (P=0.534). Concurrent treatment of T cells with
stimulation and LW6 decreased the cytotoxicity compared with that
of the stimulated T cells (P=0.034; Fig.
2A).
When compared with the unstimulated T cells,
stimulation increased the level of the pro-apoptotic transcription
factor p53 by a factor of 2.31±0.64 (P<0.001), whereas
stimulation combined with LW6 treatment increased the level of p53
by a factor of 1.42±0.86, which was not statistically significant
(P=1.000). In stimulated LW6-treated T cells, the level of p53
decreased significantly compared with that of the stimulated T
cells (P=0.039; Figs. 1 and 2B).
The level of activated caspase-3, which is central
to the execution phase of cell apoptosis, was increased by T-cell
stimulation by a factor of 1.58±0.41 compared with that of the
unstimulated T cells (P=0.026), whereas T-cell stimulation combined
with LW6 treatment increased the level of cleaved caspase-3 by a
factor of 1.09±0.29, which was not statistically significant
(P=1.000). Consistent with p53, LW6-treated stimulated T cells
exhibited a significant reduction in the levels of cleaved
caspase-3 (P=0.008) compared with those of stimulated T cells
(Figs. 1 and 2C).
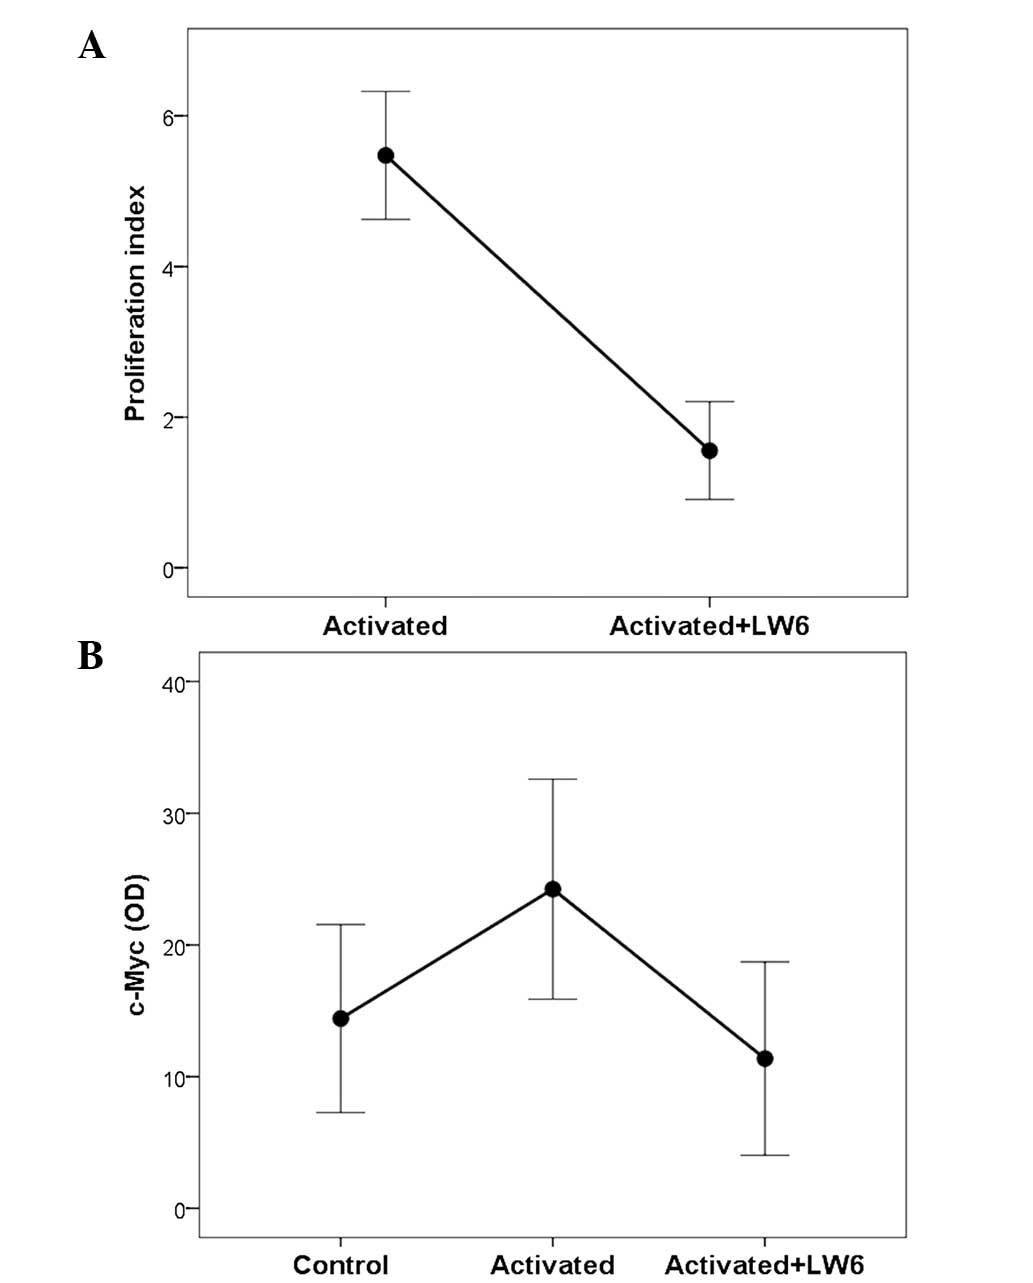
LW6 inhibits the proliferation of
activated T cells and decreases the level of c-Myc
The BrdU assay revealed a proliferation index of
5.47±0.42 for stimulated T cells. Concurrent treatment with LW6
decreased the proliferation index significantly to 1.56±0.32
(P<0.001; Fig. 3A).
The level of c-Myc, a transcription factor required
for cell proliferation, was significantly increased by stimulation,
rising by a factor of 1.73±0.36 compared with that of unstimulated
T cells (P<0.001). Concurrent treatment of T cells with
stimulation and LW6 decreased c-Myc levels by a factor of
0.84±0.33, which was statistically insignificant (P=0.527). When
the stimulated T cells and LW6-treated stimulated T cells were
compared, the c-Myc levels were decreased significantly in the
latter cells (P=0.002; Figs. 1 and
3B).
LW6 decreases the levels of HIF1α,
GLUT1, HKII, LDH-A and pPDH, while increasing those of PDH
As shown in Figs. 1
and 4A, stimulation increased the
level of the transcription factor HIF-1α significantly by a factor
of 2.06±0.99 compared with that in the unstimulated T cells
(P<0.001). However, concurrent stimulation and treatment of the
T cells with LW6 decreased the level of HIF-1α by a factor of
0.59±0.19 (P=0.005). Regarding the levels of HIF-1α in stimulated T
cells compared with stimulated LW6-treated T cells, a significant
reduction was attained in the latter case (P<0.001).
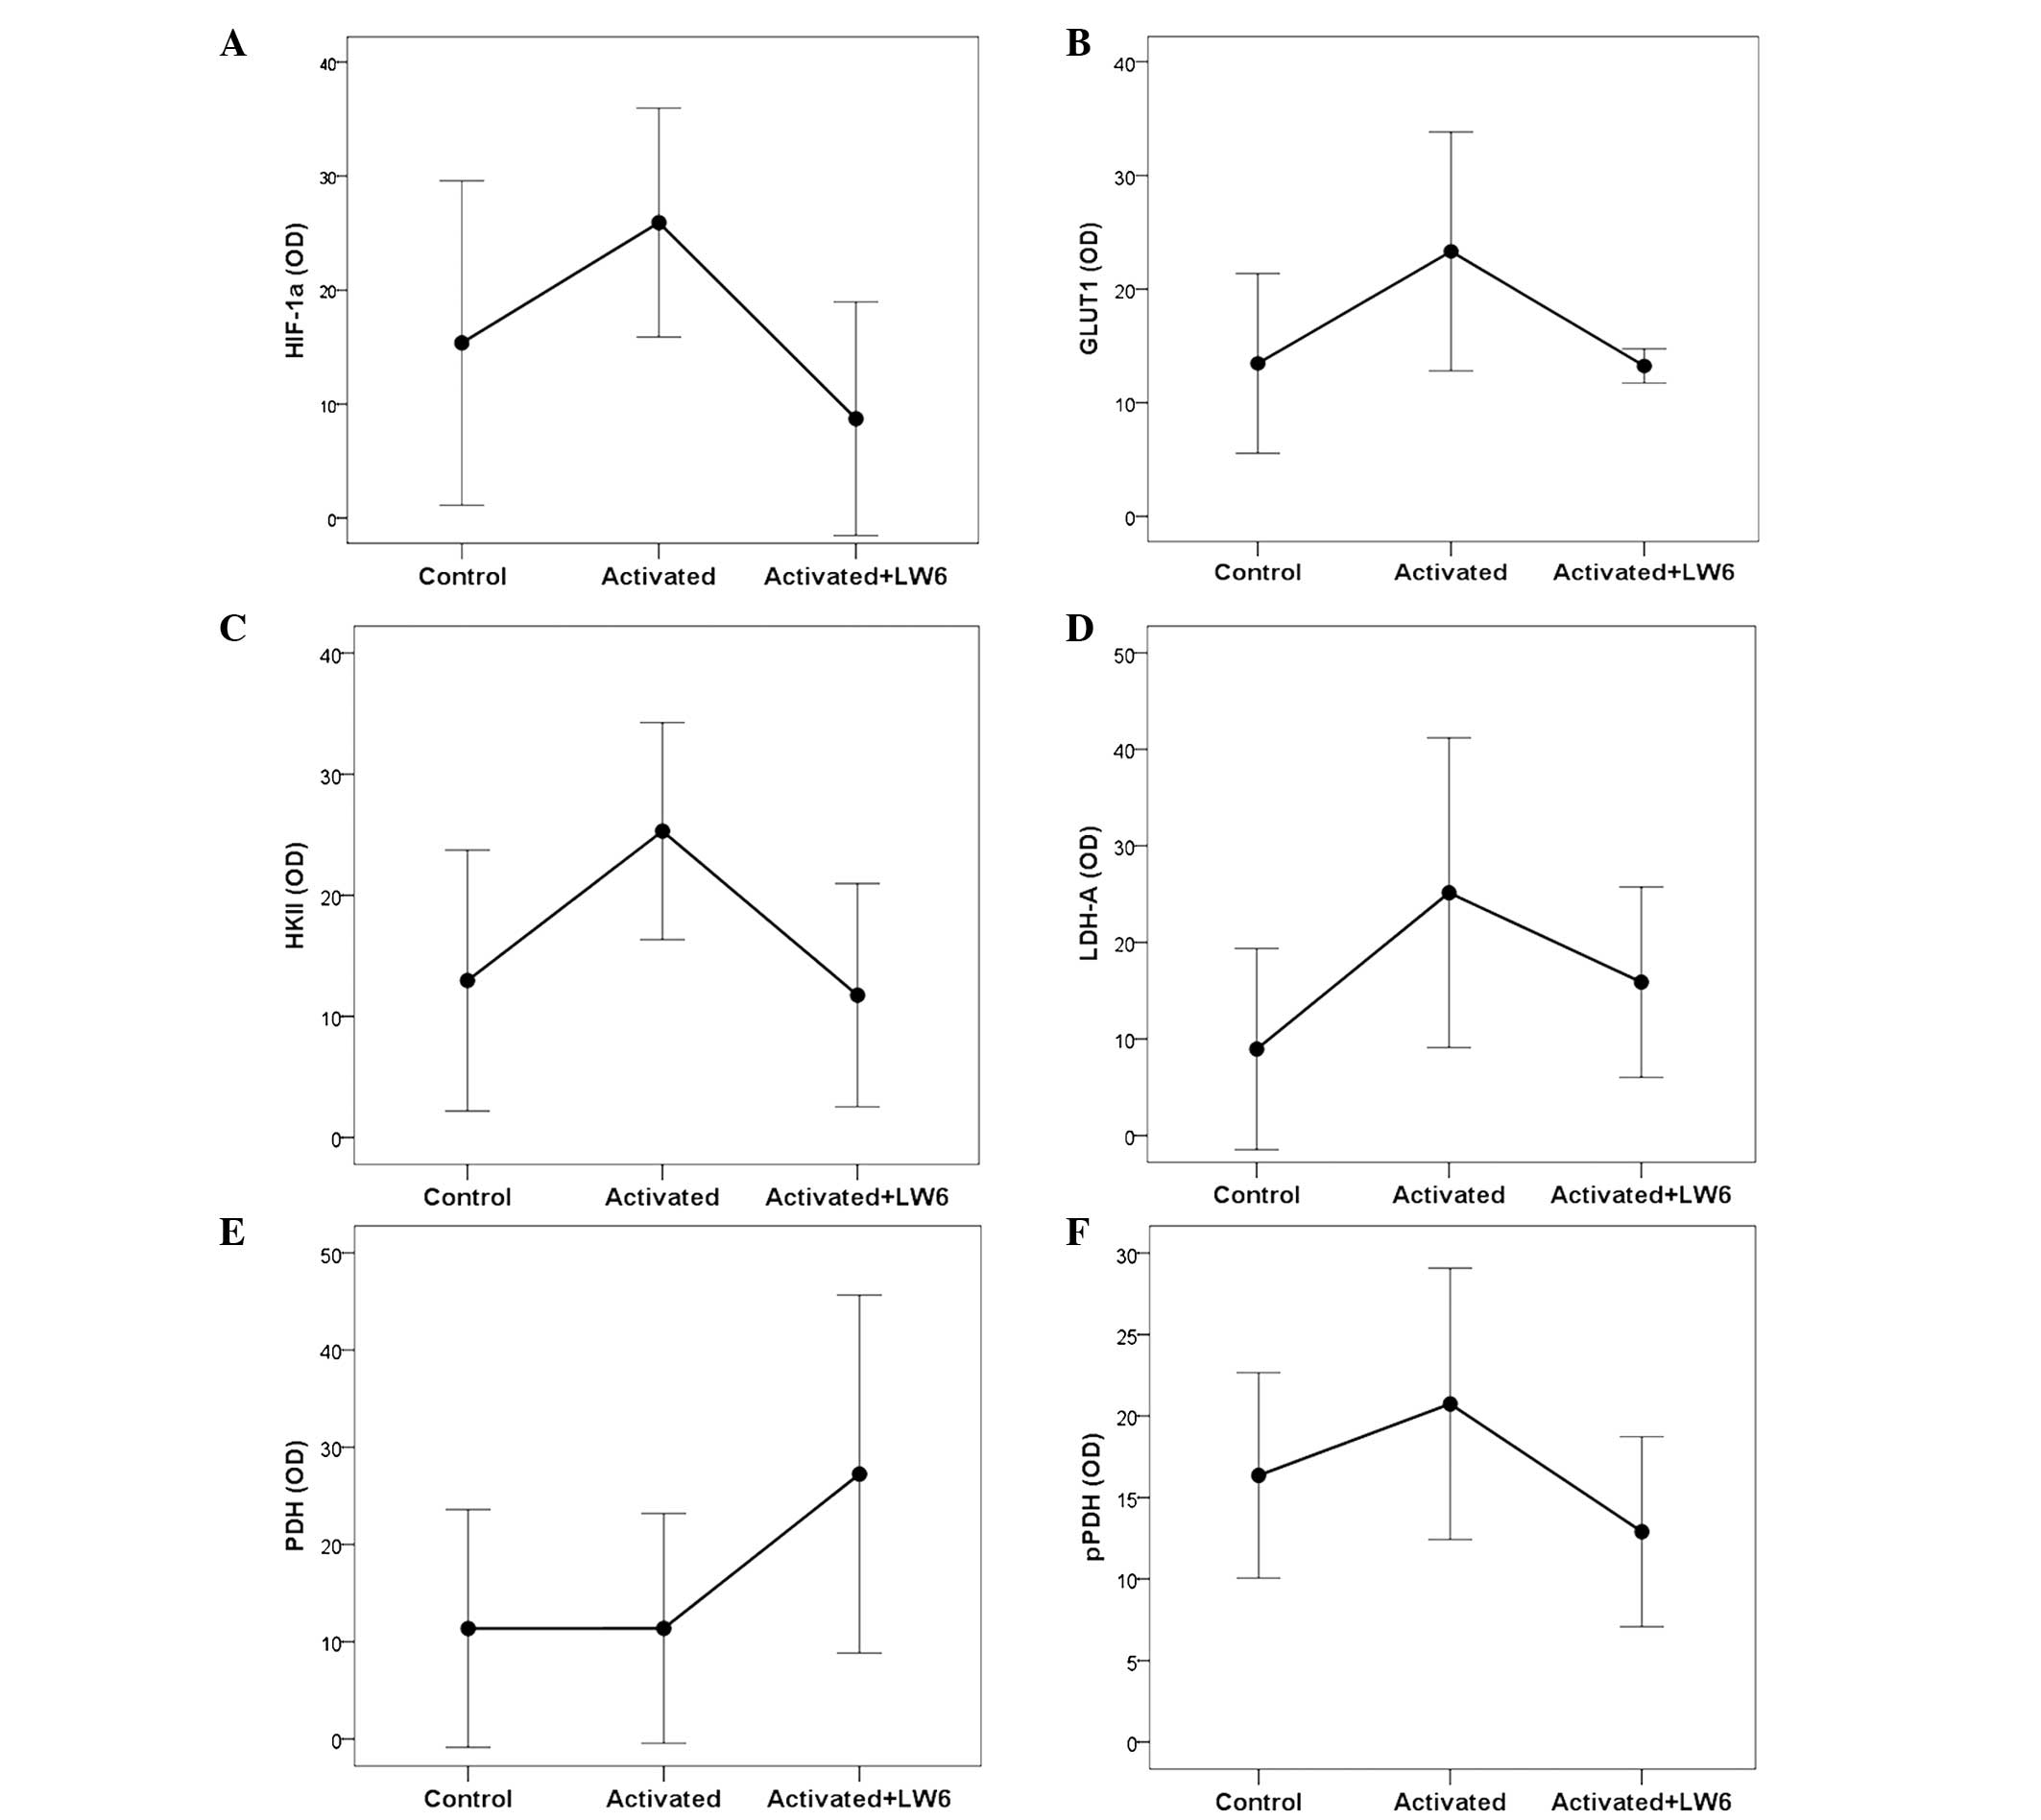 | Figure 4.Effect of LW6 on HIF-1α, GLUT1 and
certain enzymes involved in glucose metabolism in activated T
cells. (A) Stimulation of T cells increased the levels of the
transcription factor HIF-1α, whereas treatment with LW6 decreased
HIF-1α levels. A similar pattern was observed in the case of (B)
GLUT1, (C) HKII and (D) LDH-A. (E) Stimulation of T-cells did not
affect the level of PDH, whereas treatment with LW6 increased PDH
levels. (F) Stimulation of T-cells did not affect the level of pPDH
phosphorylated at serine 393, whereas treatment with LW6 returned
pPDH to its basal level. HIF-1α, hypoxia-inducible factor-1α; OD,
optical density; GLUT1, glucose transporter-1; HKII, hexokinase II;
LDH-A, lactate dehydrogenase-A; PDH, pyruvate dehydrogenase; pPDH,
PDH phosphorylated at serine 393. Assays were conducted in control
(resting), activated and LW6-treated activated T cells. |
With regard to the pathway of glycolysis, the
stimulation of T cells significantly increased the levels of GLUT1
and HKII by factors of 2.08±1.39 (P<0.048) and 2.43±1.32
(P<0.001), respectively, compared with the respective levels in
the unstimulated T cells. Treatment of T cells with stimulation and
LW6 resulted in a moderate increase in GLUT1 and HKII levels, by
factors of 1.11±0.51 and 1.19±0.84, respectively, neither of which
was statistically significant (P=1.000). However, the comparison of
stimulated T cells with LW6-treated stimulated T cells indicated
that the addition of LW6 markedly reduced GLUT1 and HK2 levels
(P=0.002 and P<0.001, respectively; Figs. 1, 4B and
C).
With regard to the pathway of glucose conversion,
stimulation of T cells increased the levels of LDH-A significantly,
by a factor of 4.01±2.92 (P=0.007) compared with those of the
unstimulated T cells, while stimulation combined with LW6 exerted a
2.53±1.56-fold increase in LDH-A, which did not reach statistical
significance (P=0.085). In the LW6-treated stimulated T cells, the
LDH-A levels were significantly decreased compared with those in
the stimulated T cells (P=0.026; Figs.
1 and 4D).
In addition to LDH-A, which is responsible for
pyruvate conversion to lactate, PDH, which converts pyruvate to
acetyl-CoA, was also assessed. No significant difference was
observed in the levels of PDH between stimulated and unstimulated
cells (1.15±0.36, P=1.000). However, treatment with stimulation and
LW6 induced a 5-fold increase in PDH levels (5.34±6.39, P=0.006).
In LW6-treated stimulated T cells, the PDH levels were
significantly increased compared with those in the stimulated T
cells (P=0.002; Figs. 1 and 4E).
Stimulation increased the levels of pPDH
significantly by a factor of 1.28±0.19 (P=0.015) compared with
those of the unstimulated cells, whereas concurrent treatment of T
cells with LW6 and stimulation decreased pPDH levels by a factor of
0.81±0.21, which was statistically insignificant (P=0.137). In the
LW6-treated stimulated T cells, the pPDH levels were decreased
significantly compared with those in the stimulated T cells
(P<0.001; Figs. 1 and 4F).
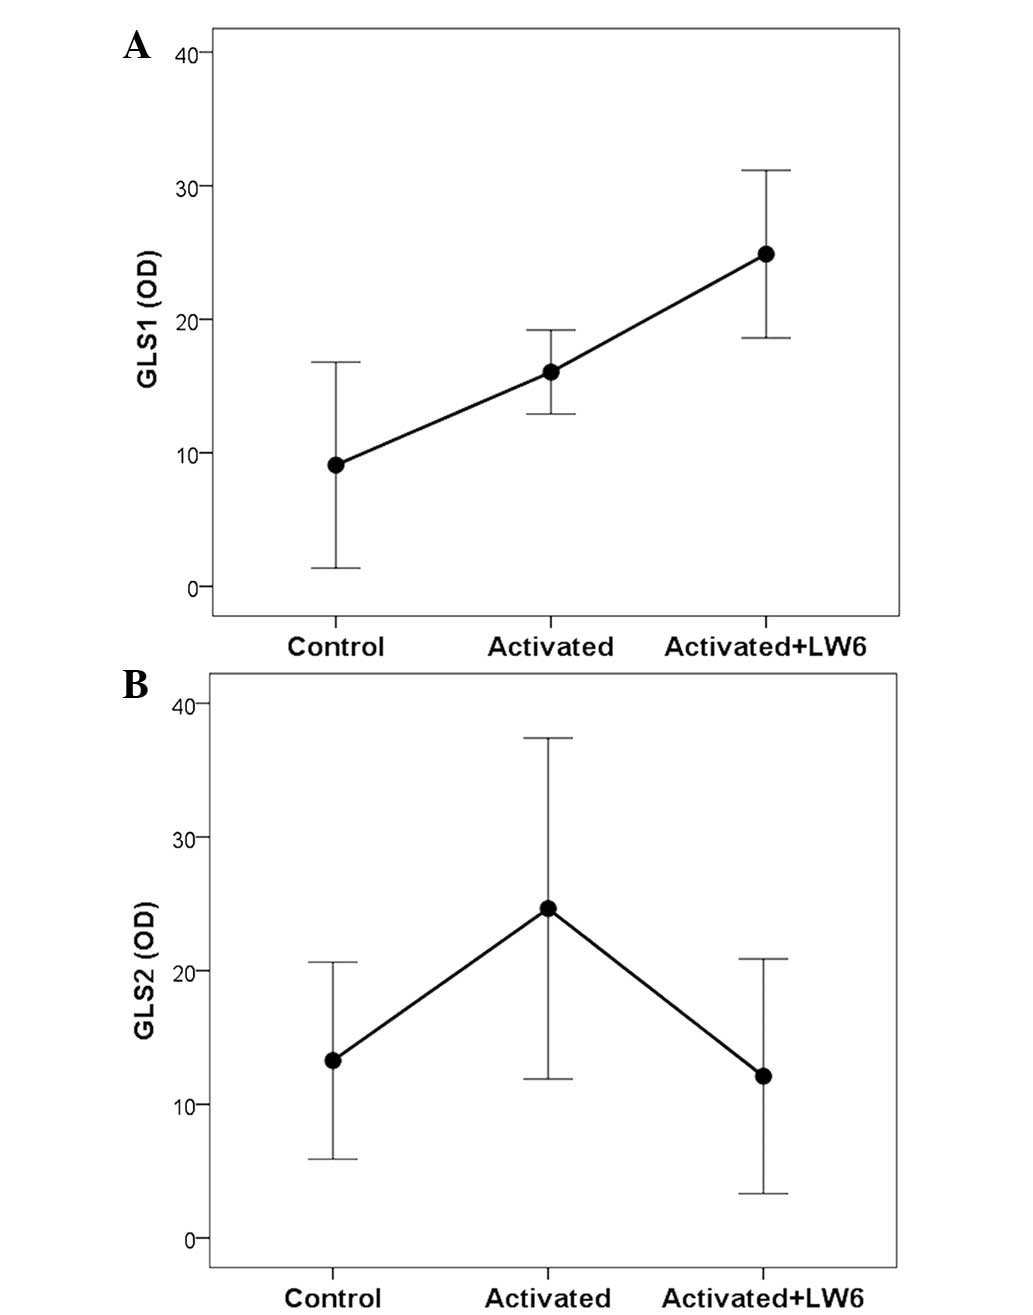
LW6 decreases the levels of GLS2,
while markedly increasing those of GLS1
The effect of T-cell stimulation on the two isoforms
of glutaminase, GLS1 and GLS2, was investigated. Stimulation
increased the levels of both isoforms 2-fold compared with those of
the unstimulated cells (2.03±0.74, P=0.001 and 1.89±0.27,
P<0.001, respectively). In the stimulated T cells treated with
LW6, GLS1 levels were increased 3-fold (3.25±1.55, P<0.001),
whereas GLS2 levels remained comparable to those observed in the
unstimulated cells (1.04±0.62, P=1.000). Furthermore, by comparing
glutaminase expression in the cell groups that were stimulated in
the presence and absence of LW6, it was revealed that LW6 further
increased the levels of the GLS1 enzyme (P<0.001; Figs. 1 and 5A), while the expression of the GLS2
isoform significantly declined in the presence of LW6 (P=0.029;
Figs. 1 and 5B).
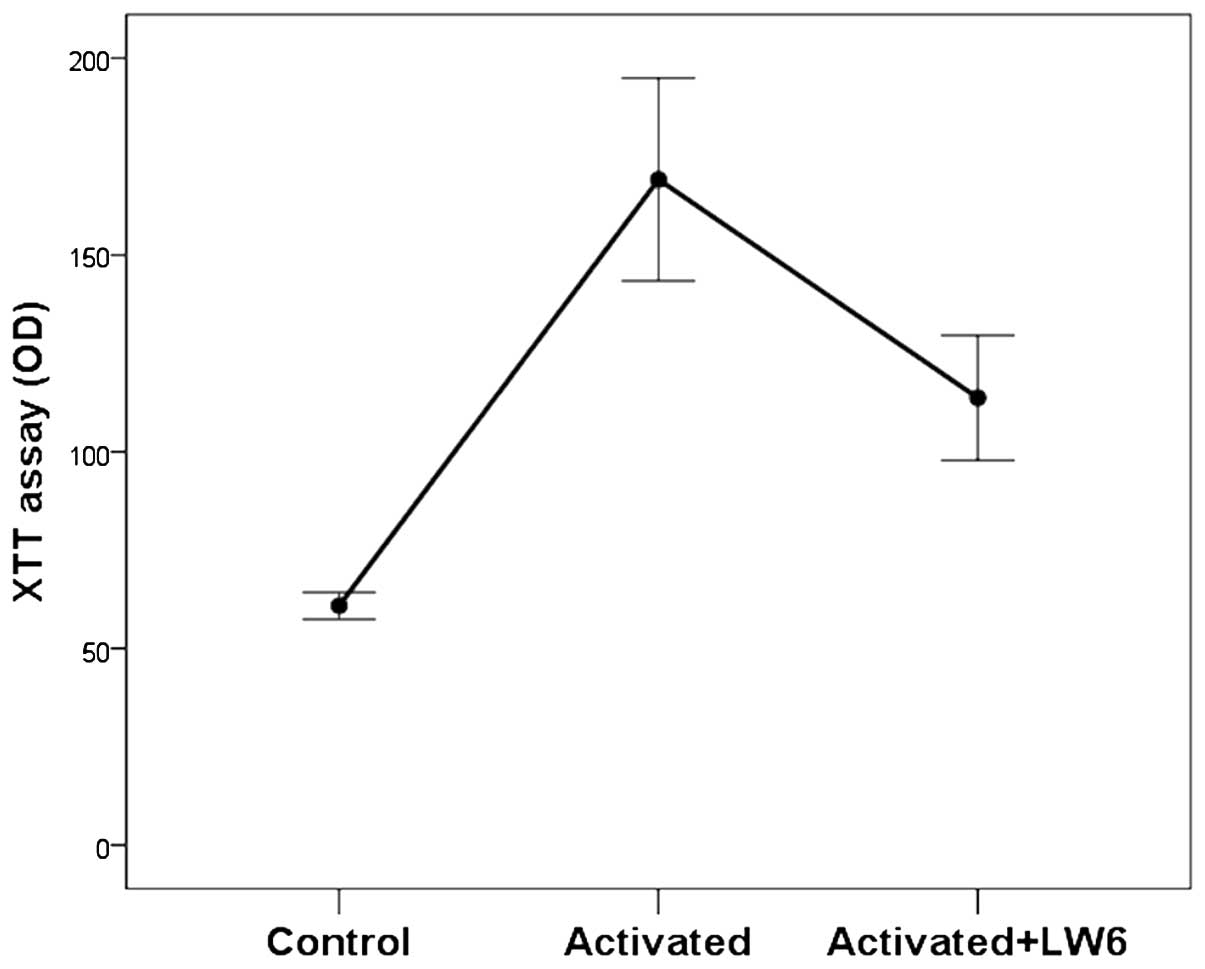
LW6 significantly decreases, but does
not completely prevent, Krebs' cycle activity in activated T
cells
The XTT assay determined an OD of 60.83±1.72 for the
unstimulated control T cells. Activation of the T cells increased
the OD significantly to 169.17±12.89 (P<0.001). Adding LW6 to
the activated T cells decreased the OD to 113.67±7.94 (P=0.001);
however, the value remained significantly higher than that for the
control T cells (P<0.001). Hence, in activated T cells LW6
suppresses significantly, but not absolutely, the production of
NADH by the Krebs' cycle (Fig.
6).
Discussion
In the present study, the effects of the MDH2
inhibitor LW6 on proliferation, apoptosis and the expression levels
of certain enzymes of glucose metabolism and glutaminolysis were
evaluated in the context of activated T cells. Specific enzyme and
glucose transporter isoforms that are known to be upregulated upon
T-cell activation were selected for evaluation (1) and Krebs' cycle activity was
assessed.
It is known that following stimulation of T cells
their proliferation and differentiation to effector cells are
coincident with an increase of HIF-1α (1,13). In
the present study, the treatment of stimulated T cells with LW6
decreased HIF-1α levels. It has been demonstrated in a cell type
other than that employed in the present study that the inhibition
of the Krebs' cycle and consequently of oxidative phosphorylation
by LW6 results in decreased intracellular O2 consumption
and increased HIF-1α degradation (10).
The proliferation of stimulated T cells in the
present study was accompanied by increased levels of c-Myc, which
is expected because c-Myc is upregulated once T-cell receptor
activation is initiated and is required for cell proliferation
(1,14). Treatment of stimulated T cells with
LW6 decreased c-Myc levels and proliferation. Although it is known
that c-Myc may increase HIF-1α levels, whether HIF-1α has a
reciprocal effect has not yet been confirmed (15–17). In
cell types other than that employed in the present study, it has
been demonstrated that HIF-1α decreases c-Myc expression or
function (18–20). The mechanisms involved in the
observed LW6-induced reduction of c-Myc activity remain to be
elucidated.
Treatment of stimulated T cells with LW6 revealed no
signs of toxicity, suggesting that this compound may possess
pharmacological potential. Notably, stimulation of T cells
increased the expression of the pro-apoptotic transcription factor
p53. Increased HIF-1α may contribute to p53 upregulation via a
number of pathways (21), and may be
an intrinsic cell mechanism for controlling proliferation. In
primary embryo fibroblasts c-Myc activates the
p19ARF-Mdm2-p53 tumor suppressor pathway (22). The reduction of p53 levels in
stimulated LW6-treated T cells may be explained by the reductions
in the HIF-1α and c-Myc levels that LW6 induces. Activated cleaved
caspase-3 is the central caspase in the execution phase of cell
apoptosis and consequently its level may be used as a marker of
apoptosis. The fluctuation of cleaved caspase-3 levels, which
occurs concurrently and with the same trend as the changes in
pro-apoptotic p53 levels indicates that decreased p53 levels may be
responsible for reduced apoptosis in LW6-treated stimulated T cells
(23,24).
Regarding glucose metabolism, stimulation of T cells
increased GLUT1 and HKII levels, increasing glucose influx into the
cells and accelerating glycolysis, which is required for these
rapidly proliferating cells. Treatment of stimulated T cells with
LW6 decreased GLUT1 and HKII levels and thus inhibited glucose
influx and decelerated glycolysis. The decreased levels of HIF-1α
and c-Myc in LW6-treated T cells may be responsible for the reduced
GLUT1 and HKII levels, as these transcription factors control their
expression (1,25–27).
Once formed, pyruvate may be further converted to
lactate by LDH-A. In the stimulated T cells in the present study,
LDH-A levels increased markedly; the effect of this would be to
enhance the conversion of pyruvate to lactate, the aerobic
glycolysis that characterizes activated T cells. Increased HIF-1α
and c-Myc levels may be responsible for LDH-A upregulation, as
these transcription factors control the expression of this enzyme
(1,25,28,29).
Treatment of stimulated T cells with LW6 decreased the levels of
LDH-A, which may be attributable to the reduced levels of HIF-1α
and c-Myc in the LW6-treated T cells.
An alternative pathway that pyruvate formed by
glycolysis may take is conversion to acetyl-CoA by PDH and entry
into the more energetically efficient Krebs' cycle. PDH activity is
controlled by PDK, which phosphorylates and inactivates it
(30). In the stimulated T cells in
the present study, the PDH levels remained unaffected. Although it
is known that HIF-1α upregulates PDK and inactivates PDH (31), T-cell stimulation moderately
increased pPDH levels. The increased influx of glucose and the
consequently increased pyruvate production in stimulated T cells,
in addition to the moderate increase of pPDH, may explain the
increased Krebs' cycle activity observed in activated T cells in
the present study. Treatment of stimulated T cells with LW6
moderately decreased pPDH levels, while increasing the levels of
PDH. The reduction of HIF-1α levels observed in LW6-treated T cells
may be responsible for the reduced pPDH levels (30), whereas the cause of the observed PDH
upregulation remains to be elucidated. Notably, the XTT assay
revealed that treatment of stimulated T cells with LW6 decreased
Krebs' cycle activity, apparently as a result of the direct
inhibition of a single step of the cycle, although decreased
glucose influx may contribute. However, Krebs' cycle activity in
LW6-treated stimulated T cells was not completely abrogated, and
remained markedly increased compared with that of unstimulated T
cells. It is possible that by increasing PDH expression, LW6
facilitates the entry of pyruvate into the Krebs' cycle, which is
energetically more effective compared with the conversion of
pyruvate to lactate. This may be useful in the context of the low
intracellular glucose conditions induced by LW6.
The process by which sufficient Krebs' cycle
activity is maintained to prevent energy collapse in LW6-treated T
cells remains unclear. In addition, the mechanism by which the
obstacle set by the MDH2 inhibitor is bypassed requires
clarification. A potential explanation involves the stage at which
the Krebs' cycle is inhibited. The accumulated malate resulting
from MDH2 inhibition may be shuttled from the mitochondria into the
cytoplasm, converted to pyruvate by malic enzyme and then re-enter
into the mitochondria and the Krebs' cycle. Pyruvate-malate cycling
was initially described in liver cells (11), and subsequently in various primary
cell types from fibroblasts to B cells, in addition to cancer cells
(32–34). Notably, in activated T cells, malic
enzyme is upregulated (1). Thus, the
pyruvate-malate cycle may prevent total cell energy collapse and
apoptosis following the treatment of stimulated T cells with
LW6.
Another possible source of energy for cells under
conditions of low intracellular glucose is glutaminolysis. The
initial enzymes in this pathway are the two isoforms of
glutaminase, GLS1 and GLS2. Glutaminases convert glutamine to
glutamate. Glutamate is converted to α-ketoglutarate, which may
enter into Krebs' cycle a number of steps prior to the stage at
which MDH2 intervenes (35). In
stimulated T cells in the present study, GLS1 and GLS2 were
upregulated and favor glutaminolysis, which is known to occur in
these rapidly proliferating cells (1,36).
Increased levels of c-Myc may be responsible for GLS1 upregulation
(37), whereas increased c-Myc and
p53 levels may be responsible for enhanced GLS2 expression
(1,38,39).
Treatment of stimulated T cells with LW6 decreased GLS2 levels,
which may be attributed to the reduced levels of c-Myc and p53.
However, glutaminolysis may be preserved in LW6-treated T cells as
a result of the markedly increased GLS1 levels. This is
controversial, as decreased c-Myc is expected to downregulate
GLS1 transcription. Alternative mechanisms, such as
anaphase-promoting complex/cyclosome (APC/c)-cdh1-mediated GLS1
degradation, remain to be evaluated (36). However, it remains possible that the
preservation of glutaminolysis in low intracellular glucose
conditions may rescue the cell from energy collapse.
In conclusion, the inhibition of MDH2 in human
activated T cells abrogates proliferation without adversely
affecting cell survival. Adaptations of cellular glucose and
glutamine metabolism may prevent energy collapse. Further studies
involving interference with T-cell metabolism may reveal novel drug
targets, which could include MDH2.
References
|
1
|
Wang R, Dillon CP, Shi LZ, Milasta S,
Carter R, Finkelstein D, McCormick LL, Fitzgerald P, Chi H, Munger
J and Green DR: The transcription factor Myc controls metabolic
reprogramming upon T lymphocyte activation. Immunity. 35:871–882.
2011. View Article : Google Scholar : PubMed/NCBI
|
|
2
|
Wang R and Green DR: Metabolic
reprogramming and metabolic dependency in T cells. Immunol Rev.
249:14–26. 2012. View Article : Google Scholar : PubMed/NCBI
|
|
3
|
Ostroukhova M, Goplen N, Karim MZ,
Michalec L, Guo L, Liang Q and Alam R: The role of low-level
lactate production in airway inflammation in asthma. Am J Physiol
Lung Cell Mol Physiol. 302:L300–L307. 2012. View Article : Google Scholar : PubMed/NCBI
|
|
4
|
Shi LZ, Wang R, Huang G, Vogel P, Neale G,
Green DR and Chi H: HIF1alpha-dependent glycolytic pathway
orchestrates a metabolic checkpoint for the differentiation of TH17
and Treg cells. J Exp Med. 208:1367–1376. 2011. View Article : Google Scholar : PubMed/NCBI
|
|
5
|
Eleftheriadis T, Pissas G, Karioti A,
Antoniadi G, Antoniadis N, Liakopoulos V and Stefanidis I:
Dichloroacetate at therapeutic concentration alters glucose
metabolism and induces regulatory T-cell differentiation in
alloreactive human lymphocytes. J Basic Clin Physiol Pharmacol.
24:271–276. 2013. View Article : Google Scholar : PubMed/NCBI
|
|
6
|
Eleftheriadis T, Pissas G, Karioti A,
Antoniadi G, Liakopoulos V, Dafopoulou K, Pournaras S, Koukoulis G
and Stefanidis I: The indoleamine 2,3-dioxygenase inhibitor
1-methyl-tryptophan suppresses mitochondrial function, induces
aerobic glycolysis and decreases interleukin-10 production in human
lymphocytes. Immunol Invest. 41:507–520. 2012. View Article : Google Scholar : PubMed/NCBI
|
|
7
|
Eleftheriadis T, Pissas G, Yiannaki E,
Markala D, Arampatzis S, Antoniadi G, Liakopoulos V and Stefanidis
I: Inhibition of indoleamine 2,3-dioxygenase in mixed lymphocyte
reaction affects glucose influx and enzymes involved in aerobic
glycolysis and glutaminolysis in alloreactive T-cells. Hum Immunol.
74:1501–1509. 2013. View Article : Google Scholar : PubMed/NCBI
|
|
8
|
Eleftheriadis T, Pissas G, Antoniadi G,
Spanoulis A, Liakopoulos V and Stefanidis I: Indoleamine
2,3-dioxygenase increases p53 levels in alloreactive human T cells
and both indoleamine 2,3-dioxygenase and p53 suppress glucose
uptake, glycolysis and proliferation. Int Immunol. 26:673–684.
2014. View Article : Google Scholar : PubMed/NCBI
|
|
9
|
Lee K, Kang JE, Park SK, Jin Y, Chung KS,
Kim HM, Lee K, Kang MR, Lee MK, Song KB, et al: LW6, a novel HIF-1
inhibitor, promotes proteasomal degradation of HIF-1alpha via
upregulation of VHL in a colon cancer cell line. Biochem Pharmacol.
80:982–989. 2010. View Article : Google Scholar : PubMed/NCBI
|
|
10
|
Lee K, Ban HS, Naik R, Hong YS, Son S, Kim
BK, Xia Y, Song KB, Lee HS and Won M: Identification of malate
dehydrogenase 2 as a target protein of the HIF-1 inhibitor LW6
using chemical probes. Angew Chem Int Ed Engl. 52:10286–10289.
2013. View Article : Google Scholar : PubMed/NCBI
|
|
11
|
Friedman B, Goodman EH Jr, Saunders HL,
Kostos V and Weinhouse S: Estimation of pyruvate recycling during
gluconeogenesis in perfused rat liver. Metabolism. 20:2–12. 1971.
View Article : Google Scholar : PubMed/NCBI
|
|
12
|
Berridge MV, Herst PM and Tan AS:
Tetrazolium dyes as tools in cell biology: New insights into their
cellular reduction. Biotechnol Annu Rev. 11:127–152. 2005.
View Article : Google Scholar : PubMed/NCBI
|
|
13
|
Dang EV, Barbi J, Yang HY, Jinasena D, Yu
H, Zheng Y, Bordman Z, Fu J, Kim Y and Yen HR: Control of
T(H)17/T(reg) balance by hypoxia-inducible factor 1. Cell.
146:772–784. 2011. View Article : Google Scholar : PubMed/NCBI
|
|
14
|
Guy CS, Vignali KM, Temirov J, Bettini ML,
Overacre AE, Smeltzer M, Zhang H, Huppa JB, Tsai YH, Lobry C, et
al: Distinct TCR signaling pathways drive proliferation and
cytokine production in T cells. Nat Immunol. 14:262–270. 2013.
View Article : Google Scholar : PubMed/NCBI
|
|
15
|
Doe MR, Ascano JM, Kaur M and Cole MD: Myc
posttranscriptionally induces HIF1 protein and target gene
expression in normal and cancer cells. Cancer Res. 72:949–957.
2012. View Article : Google Scholar : PubMed/NCBI
|
|
16
|
Chen C, Cai S, Wang G, Cao X, Yang X, Luo
X, Feng Y and Hu J: c-Myc enhances colon cancer cell-mediated
angiogenesis through the regulation of HIF-1α. Biochem Biophys Res
Commun. 430:505–511. 2013. View Article : Google Scholar : PubMed/NCBI
|
|
17
|
Podar K and Anderson KC: A therapeutic
role for targeting c-Myc/Hif-1-dependent signaling pathways. Cell
Cycle. 9:1722–1728. 2010. View Article : Google Scholar : PubMed/NCBI
|
|
18
|
Hong KS, Park JI, Kim MJ, Kim HB, Lee JW,
Dao TT, Oh WK, Kang CD and Kim SH: Involvement of SIRT1 in hypoxic
down-regulation of c-Myc and β-catenin and hypoxic preconditioning
effect of polyphenols. Toxicol Appl Pharmacol. 259:210–218. 2012.
View Article : Google Scholar : PubMed/NCBI
|
|
19
|
Huang LE: Carrot and stick: HIF-alpha
engages c-Myc in hypoxic adaptation. Cell Death Differ. 15:672–677.
2008. View Article : Google Scholar : PubMed/NCBI
|
|
20
|
Li Q, Kluz T, Sun H and Costa M:
Mechanisms of c-myc degradation by nickel compounds and hypoxia.
PloS One. 4:e85312009. View Article : Google Scholar : PubMed/NCBI
|
|
21
|
Sermeus A and Michiels C: Reciprocal
influence of the p53 and the hypoxic pathways. Cell Death Dis.
2:e1642011. View Article : Google Scholar : PubMed/NCBI
|
|
22
|
Eischen CM, Weber JD, Roussel MF, Sherr CJ
and Cleveland JL: Disruption of the ARF-Mdm2-p53 tumor suppressor
pathway in Myc-induced lymphomagenesis. Genes Dev. 13:2658–2669.
1999. View Article : Google Scholar : PubMed/NCBI
|
|
23
|
Brady CA and Attardi LD: p53 at a glance.
J Cell Sci. 123:2527–2532. 2010. View Article : Google Scholar : PubMed/NCBI
|
|
24
|
Green DR and Kroemer G: Cytoplasmic
functions of the tumour suppressor p53. Nature. 458:1127–1130.
2009. View Article : Google Scholar : PubMed/NCBI
|
|
25
|
Iyer NV, Kotch LE, Agani F, Leung SW,
Laughner E, Wenger RH, Gassmann M, Gearhart JD, Lawler AM, Yu AY
and Semenza GL: Cellular and developmental control of O2
homeostasis by hypoxia-inducible factor 1 alpha. Genes Dev.
12:149–162. 1998. View Article : Google Scholar : PubMed/NCBI
|
|
26
|
Osthus RC, Shim H, Kim S, Li Q, Reddy R,
Mukherjee M, Xu Y, Wonsey D, Lee LA and Dang CV: Deregulation of
glucose transporter 1 and glycolytic gene expression by c-Myc. J
Biol Chem. 275:21797–21800. 2000. View Article : Google Scholar : PubMed/NCBI
|
|
27
|
Gordan JD, Thompson CB and Simon MC: HIF
and c-Myc: Sibling rivals for control of cancer cell metabolism and
proliferation. Cancer Cell. 12:108–113. 2007. View Article : Google Scholar : PubMed/NCBI
|
|
28
|
Valera A, Pujol A, Gregori X, Riu E, Visa
J and Bosch F: Evidence from transgenic mice that myc regulates
hepatic glycolysis. FASEB J. 9:1067–1078. 1995.PubMed/NCBI
|
|
29
|
Shim H, Dolde C, Lewis BC, Wu CS, Dang G,
Jungmann RA, Dalla-Favera R and Dang CV: c-Myc transactivation of
LDH-A: Implications for tumor metabolism and growth. Proc Natl Acad
Sci USA. 94:6658–6663. 1997. View Article : Google Scholar : PubMed/NCBI
|
|
30
|
Korotchkina LG and Patel MS: Site
specificity of four pyruvate dehydrogenase kinase isoenzymes toward
the three phosphorylation sites of human pyruvate dehydrogenase. J
Biol Chem. 276:37223–37229. 2001. View Article : Google Scholar : PubMed/NCBI
|
|
31
|
Kim JW, Tchernyshyov I, Semenza GL and
Dang CV: HIF-1-mediated expression of pyruvate dehydrogenase
kinase: A metabolic switch required for cellular adaptation to
hypoxia. Cell Metab. 3:177–185. 2006. View Article : Google Scholar : PubMed/NCBI
|
|
32
|
Munger J, Bajad SU, Coller HA, Shenk T and
Rabinowitz JD: Dynamics of the cellular metabolome during human
cytomegalovirus infection. PLoS Pathog. 2:e1322006. View Article : Google Scholar : PubMed/NCBI
|
|
33
|
Le A, Lane AN, Hamaker M, Bose S, Gouw A,
Barbi J, Tsukamoto T, Rojas CJ, Slusher BS, Zhang H, et al:
Glucose-independent glutamine metabolism via TCA cycling for
proliferation and survival in B cells. Cell Metab. 15:110–121.
2012. View Article : Google Scholar : PubMed/NCBI
|
|
34
|
Yang C, Ko B, Hensley CT, Jiang L, Wasti
AT, Kim J, Sudderth J, Calvaruso MA, Lumata L, Mitsche M, et al:
Glutamine oxidation maintains the TCA cycle and cell survival
during impaired mitochondrial pyruvate transport. Mol Cell.
56:414–424. 2014. View Article : Google Scholar : PubMed/NCBI
|
|
35
|
Mates JM, Segura JA, Martin-Rufián M,
Campos-Sandoval JA, Alonso FJ and Marquez J: Glutaminase isoenzymes
as key regulators in metabolic and oxidative stress against cancer.
Curr Mol Med. 13:514–534. 2013. View Article : Google Scholar : PubMed/NCBI
|
|
36
|
Colombo SL, Palacios-Callender M, Frakich
N, De Leon J, Schmitt CA, Boorn L, Davis N and Moncada S:
Anaphase-promoting complex/cyclosome-Cdh1 coordinates glycolysis
and glutaminolysis with transition to S phase in human T
lymphocytes. Proc Natl Acad Sci USA. 107:18868–18873. 2010.
View Article : Google Scholar : PubMed/NCBI
|
|
37
|
Gao P, Tchernyshyov I, Chang TC, Lee YS,
Kita K, Ochi T, Zeller KI, De Marzo AM, Van Eyk JE, Mendell JT and
Dang CV: c-Myc suppression of miR-23a/b enhances mitochondrial
glutaminase expression and glutamine metabolism. Nature.
458:762–765. 2009. View Article : Google Scholar : PubMed/NCBI
|
|
38
|
Suzuki S, Tanaka T, Poyurovsky MV, Nagano
H, Mayama T, Ohkubo S, Lokshin M, Hosokawa H, Nakayama T, Suzuki Y,
et al: Phosphate-activated glutaminase (GLS2), a p53-inducible
regulator of glutamine metabolism and reactive oxygen species. Proc
Natl Acad Sci USA. 107:7461–7466. 2010. View Article : Google Scholar : PubMed/NCBI
|
|
39
|
Hu W, Zhang C, Wu R, Sun Y, Levine A and
Feng Z: Glutaminase 2, a novel p53 target gene regulating energy
metabolism and antioxidant function. Proc Natl Acad Sci USA.
107:7455–7460. 2010. View Article : Google Scholar : PubMed/NCBI
|