Introduction
Microvesicles (MVs) are a heterogeneous group of
membrane vesicles, with a size range of 100–1,000 nm, which are
shed by various cell types in physiological and pathological
conditions (1). MVs have been
identified in a number of body fluids, including the plasma, serum,
urine, saliva, breast milk, amniotic fluid and ascites (2–7). The
counts and contents of MVs in circulation depend on the cells of
origin and the stimuli that trigger MV production. Studies
observing plasma by flow cytometry (FCM) have revealed correlations
between MV counts and other characteristics of human hematologic
disorders (8), cardiovascular
(9) and autoimmune diseases
(10), and cancer (11,12).
Therefore, circulating MVs represent promising biomarkers and may
have diagnostic and prognostic value for diseases.
However, due to different methods used for
collection, storage and isolation, pre-analytical variations in MV
detection are unavoidable (13–16). A
number of anticoagulants are used in blood samples collected for MV
analysis, including heparin (13,17),
acid-citrate-dextrose (18),
ethylenediaminetetraacetic acid (EDTA) (14) and sodium citrate (19). Previous studies have reported that
heparin and EDTA lead to conflicting results of MV count (15,16). In
addition, different centrifugation speeds and times are used to
isolate MVs; however, the effect of different centrifugation
conditions on MV count are unclear (8,20).
Furthermore, storage status, time and temperature may markedly
affect MV counts, as observed in previous studies (13,15).
Recent studies have demonstrated that MV size distribution may
differ in response to various forms of stress in vitro
(20,21), indicating the significance of MV size
in diseases. However, the effects of sample collection procedures
and processing on MV size distribution have not been
well-characterized.
The aim of the present study was to investigate the
impact of pre-analytical sample preparation procedures and
conditions on the counts and size distribution of MVs assessed
using FCM.
Materials and methods
Reagents
Calcein-AM (C1430) was obtained from Life
Technologies (Carlsbad, CA, USA) and used for MV staining as
previously described (20).
Calibration beads of 1 µm (L1030) and 3 µm (LB30) were purchased
from Sigma-Aldrich (St. Louis, MO, USA) to define the MV gate and
calculate MV counts. A submicron bead calibration kit (no. 832) was
obtained from Bangs Laboratories, Inc. (Fishers, IN, USA) to verify
the resolution capabilities of the flow cytometer and define the
size distribution of MVs. Phosphate-buffered saline (PBS) solution
(SH30256.01B) was purchased from HyClone Corporation (Logan, UT,
USA), and filtered through a 0.22-µm filter (EMD Millipore,
Billerica, MA, USA) to minimize interference from particles in
PBS.
Blood sample collection
Optimization of MV detection was performed using
samples from healthy individuals. Written informed consent was
obtained from 13 donors (female, 4; male, 9; age range, 22–33
years; median age, 26 years) under a protocol approved by the local
Institutional Review Board of Tongji Medical College (Wuhan,
China). All participants fasted for 10 h prior to sample
collection. A total of 26 blood samples were collected from the 13
donors and 21-gauge needles were used to place the samples in BD
vacutainers (BD Biosciences, Franklin Lakes, NJ, USA) of which the
inner wall were sprayed with heparin or EDTA. There were 2 samples
from each donor and 2 ml per sample. These samples were used for
the evaluation of the effect of storage conditions and
anticoagulant on MV counts and size distribution. To assess the
impact of centrifugation speed and time, 8 specimens were collected
from healthy individuals (female, 4; male, 4; age range, 24–26
years; median age, 25 years) and placed in BD vacutainer tubes with
heparin sprayed on the inner wall, 2 ml per sample. For all
samples, the first 3 ml of blood collected following venepuncture
was discarded. All samples were centrifuged within 2 h from
collection.
Preparation of platelet-free plasma
(PFP)
PFP was obtained from anticoagulated blood as
previously described (15) with
certain modifications. Briefly, whole blood samples were
centrifuged at 2,500 × g for 30 min at 20°C, and plasma was
collected and centrifuged for an additional 30 min at 2,500 × g.
Next, the supernatant was collected and aliquots of 100 µl PFP were
stored at −80°C for 1 or 4 week until use, or MVs were isolated
immediately.
Isolation of MVs
MVs were isolated from PFP, that was stored at −80°C
and thawed rapidly to 37°C prior to use (13). The PFP was centrifuged at 20,500 × g
for 60 min at 4°C to obtain a MV pellet, as described by Ghosh
et al (8). The centrifuge
tube was tipped to discard the supernatant, leaving the pellet at
the bottom undisturbed. The MV pellet was resuspended in 100 µl PBS
by gentle vortexing for 20 sec for immediate analysis using FCM, or
storage at 4°C for 3–4 days or 1 week or or −80°C for 1 or 4 week
prior to analysis. Unless otherwise indicated, MVs freshly obtained
from PFP without any storage were used as controls.
In order to investigate the effects of
centrifugation speed and duration on MV analysis, PFP from
heparin-anticoagulated blood was immediately centrifuged at 4°C and
16,000 or 20,500 × g, for 15, 30 or 60 min to isolate MVs. MVs
obtained at 20,500 × g were regarded as the control in this
section. The workflow is outlined in Fig. 1.
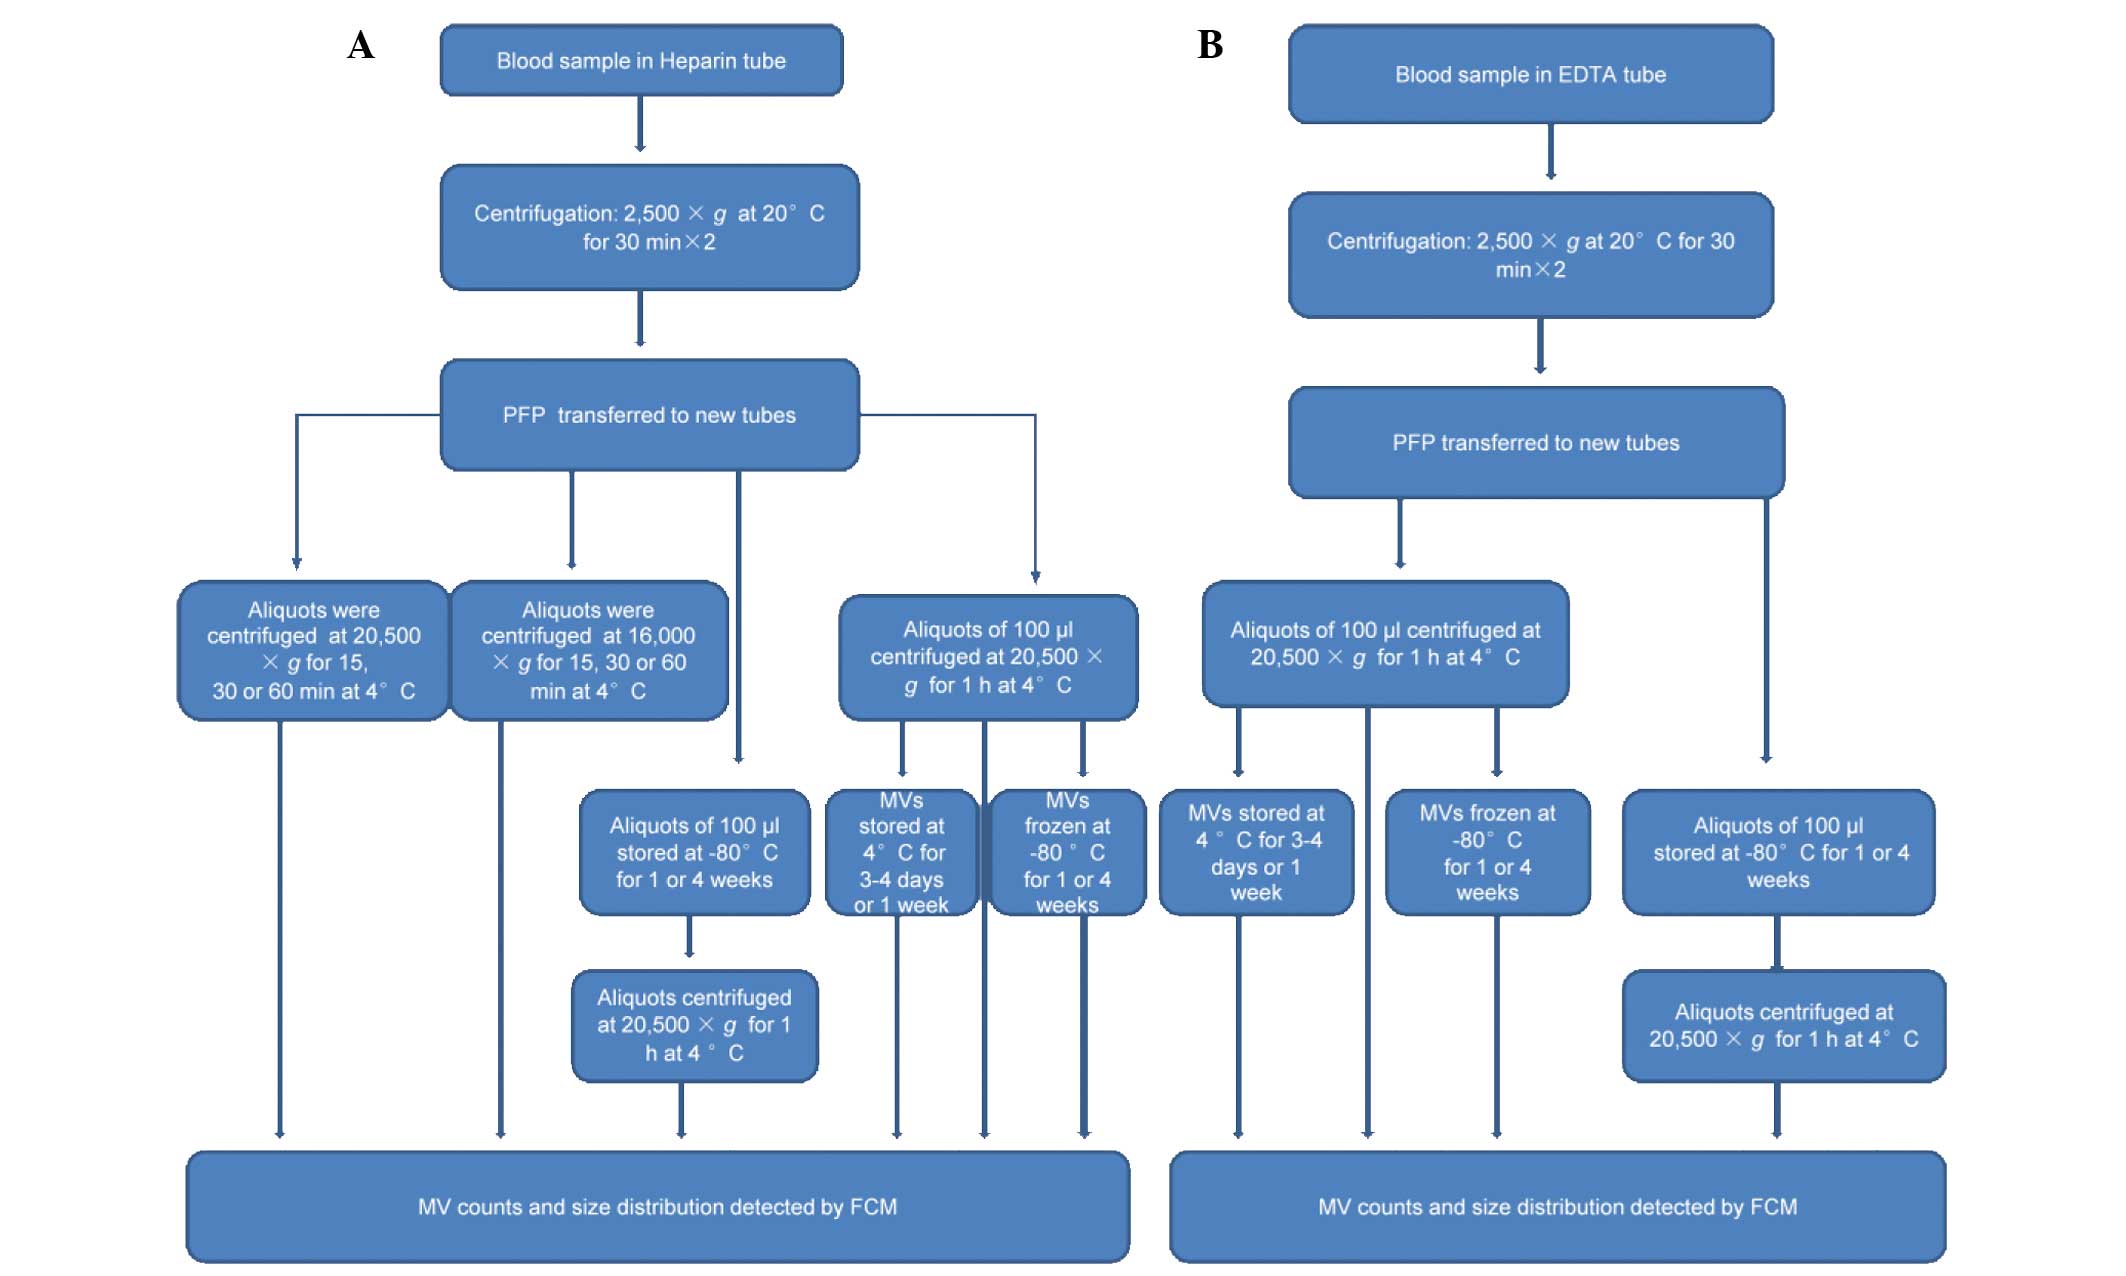 | Figure 1.Sample treatment flowchart showing
the experimental strategy for evaluating variables of collection,
storage and isolation for MV counts and size distribution using FCM
detection. (A) Blood samples were collected in BD Vacutainers tubes
with heparin sprayed on the inner wall and centrifuged twice at
2,500 × g for 30 min to obtain PFP. A number of aliquots were
centrifuged at 16,000 or 20,500 × g for 15, 30 or 60 min at 4°C to
obtain MVs, which were analyzed immediately to evaluate the
influences of centrifugation speed and time on MV count and size
distribution. Other PFP aliquots were centrifuged at 20,500xg for 1
h at 4°C to obtain MVs, or stored at −80°C for various periods
prior to isolation of the MVs. Subsequently, these MVs were
analyzed immediately or stored at 4 or −80°C for various periods
until required for analysis using FCM. (B) Blood samples were
collected in BD Vacutainers tubes with EDTA sprayed on the inner
wall. Following double centrifugation at 2,500 × g for 30 min the
supernatants were transferred to other tubes. Aliquots of 100 µl
were centrifuged at 20,500 × g for 1 h at 4°C to obtain MVs, or
stored at −80°C for various periods prior to isolation of the MVs.
MVs were analyzed immediately, or stored at 4 or −80°C for various
periods prior to analysis by FCM. EDTA, ethylenediaminetetraacetic
acid; PFP, platelet-free plasma; MV, microvesicle; FCM, flow
cytometry. |
FCM analysis of MVs
Data were acquired and analyzed using a BD LSR II
flow cytometer (BD Biosciences) equipped with FACSDiva software.
Forward scatter (FSC) and side scatter (SSC) of light were set in a
logarithmic scale, and the fluorescence channels were set at
logarithmic gain. Calibration beads were used to set the MV gate
and to calculate the MV counts.
In order to distinguish true events from electronic
noise and increase the specificity of MV detection, events in the
MV gate were further discriminated by labeling with calcein-AM
(20). MVs were defined as particles
<1.0 µm in diameter that exhibited positive staining for
calcein-AM. Individual MV samples were labeled with 0.5 µl
calcein-AM (5 µmol/l) for 25–30 min in the dark and diluted to a
final volume of 300 µl. The time and concentration employed was
optimized by titration. MV samples prepared in PBS without
calcein-AM were used as negative controls.
For calculation of MV counts, 3-µm calibration beads
(0.5 µl) were added immediately prior to analysis. Gain settings
were adjusted to place the beads in the top right corner for
scatter. The equation MV=GMV × TC/(GTC × V)
was used to calculate the absolute counts of MVs in single
staining, where GMV is the number of events in the MV
gate, GTC is the number of events in the 3-µm
calibration bead gate and TC is the number of beads added to the
sample of volume V (15,22,23).
Data acquisition stopped when the number of events in
GTC reached 100,000. The original data analysis was
performed using FACSDiva software (version 6.1.2; BD Biosciences),
and FlowJo software (version 7.6.2; Treestar, Inc., Palo Alto, CA,
USA) was applied to analyze the size distribution.
Statistical analysis. Statistically significant
differences were compared among groups using the
independent-samples t-test. Analysis was performed using SPSS
statistical software (version 16.0; SPSS, Inc., Chicago, IL, USA).
Two-sided P-values were used throughout. P<0.05 was considered
to indicate a statistically significant difference.
Results
Data acquisition, gating and counting
strategy
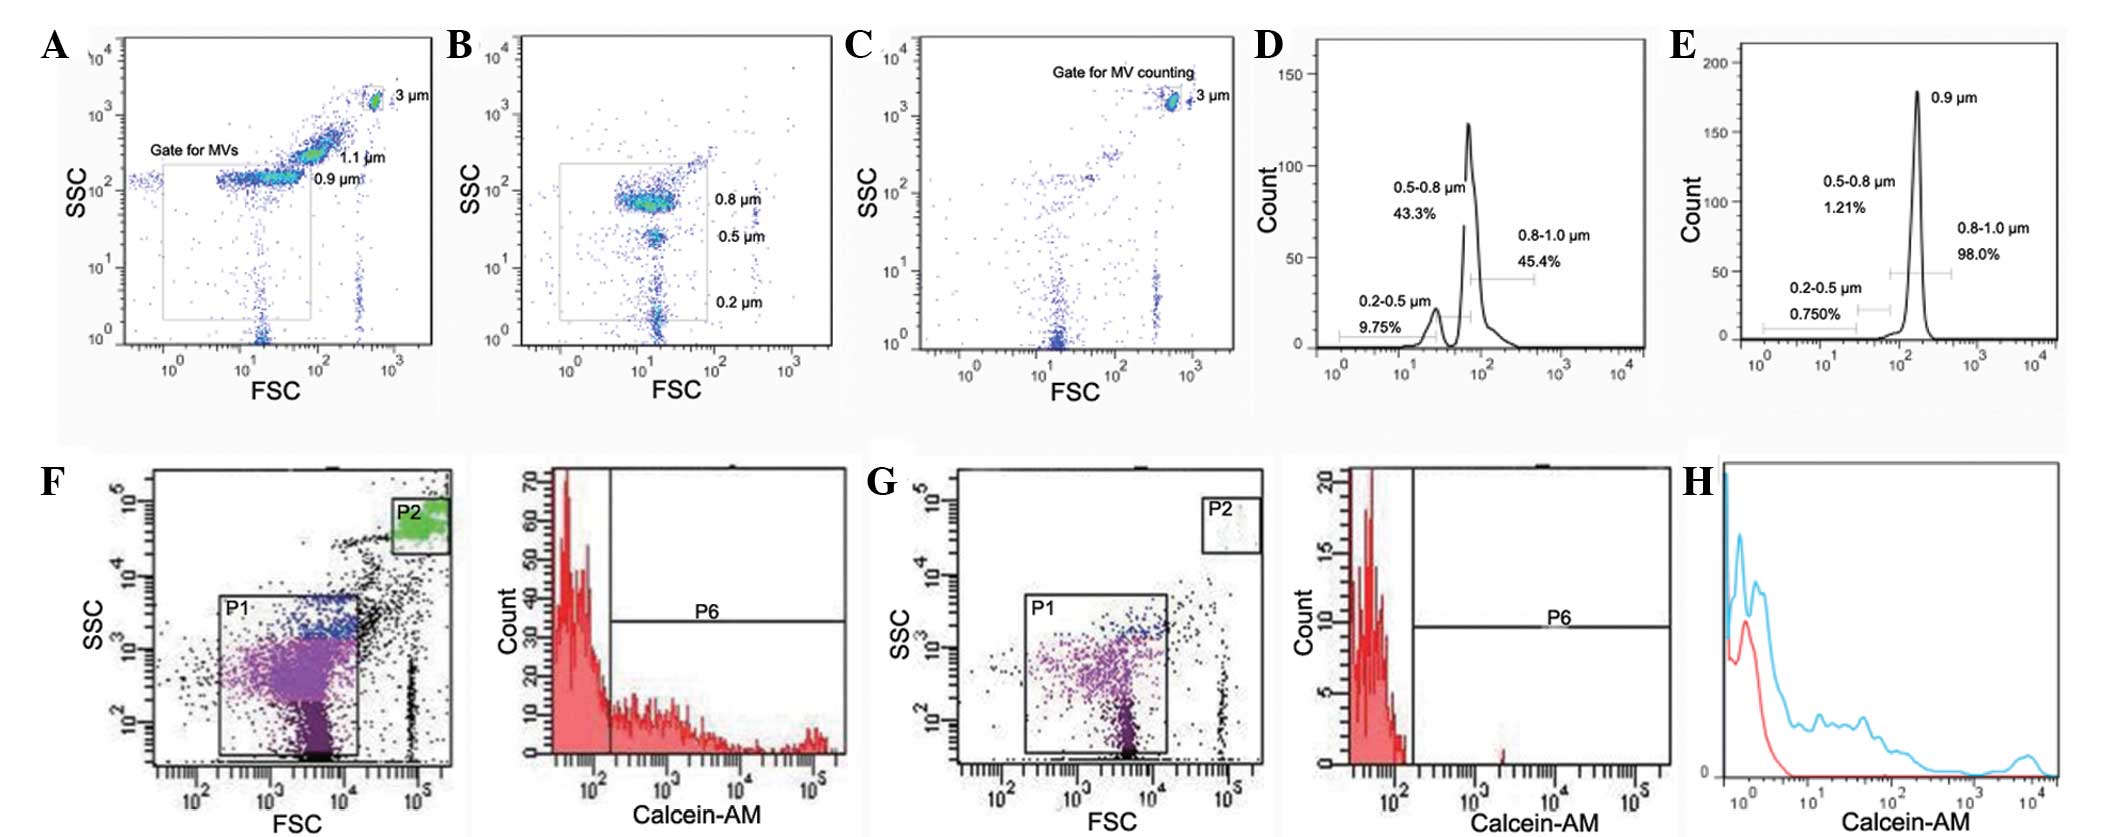
Scatter events from size calibration beads of 0.2,
0.5, 0.8, 1 and 3 µm were resolved from instrument noise using the
BD LSR II flow cytometer (Fig. 2).
Inspection of the scatter plot indicates that 0.2 µm is the lower
limit for bead detection (Fig. 2B).
Calibration beads of 0.2, 0.5 and 0.8 µm were additionally used to
define the size distribution of MVs. As shown in Fig. 2D, MVs may be divided into three size
ranges of 0.2–0.5, 0.5–0.8 and 0.8–1.0 µm in diameter. Fig. 2E is the histogram of the data
presented in Fig. 2A, verifying the
applicability of size distribution defined by the small beads.
In the present study, MVs were defined as particles
that were <1.0 µm in diameter and positive for calcein-AM
staining. As shown in Fig. 2F,
events in the P6 gate were regarded as MVs from plasma. MV counts
were calculated by reference to added 3-µm calibration beads.
According to the product information from Sigma-Aldrich, the number
of particles per microliter of these beads is 6.8×10⁶,
and 0.5 µl beads were added per experimental sample. Thus, the
number of particles added per sample was 3.4×10⁶. Data
acquisition stopped when events in the P2 gate (3-µm calibration
beads gate) reached 100,000; events in the P6 (MV) gate were
recorded simultaneously. The number of MVs was calculated according
to the formula described in the methods section.
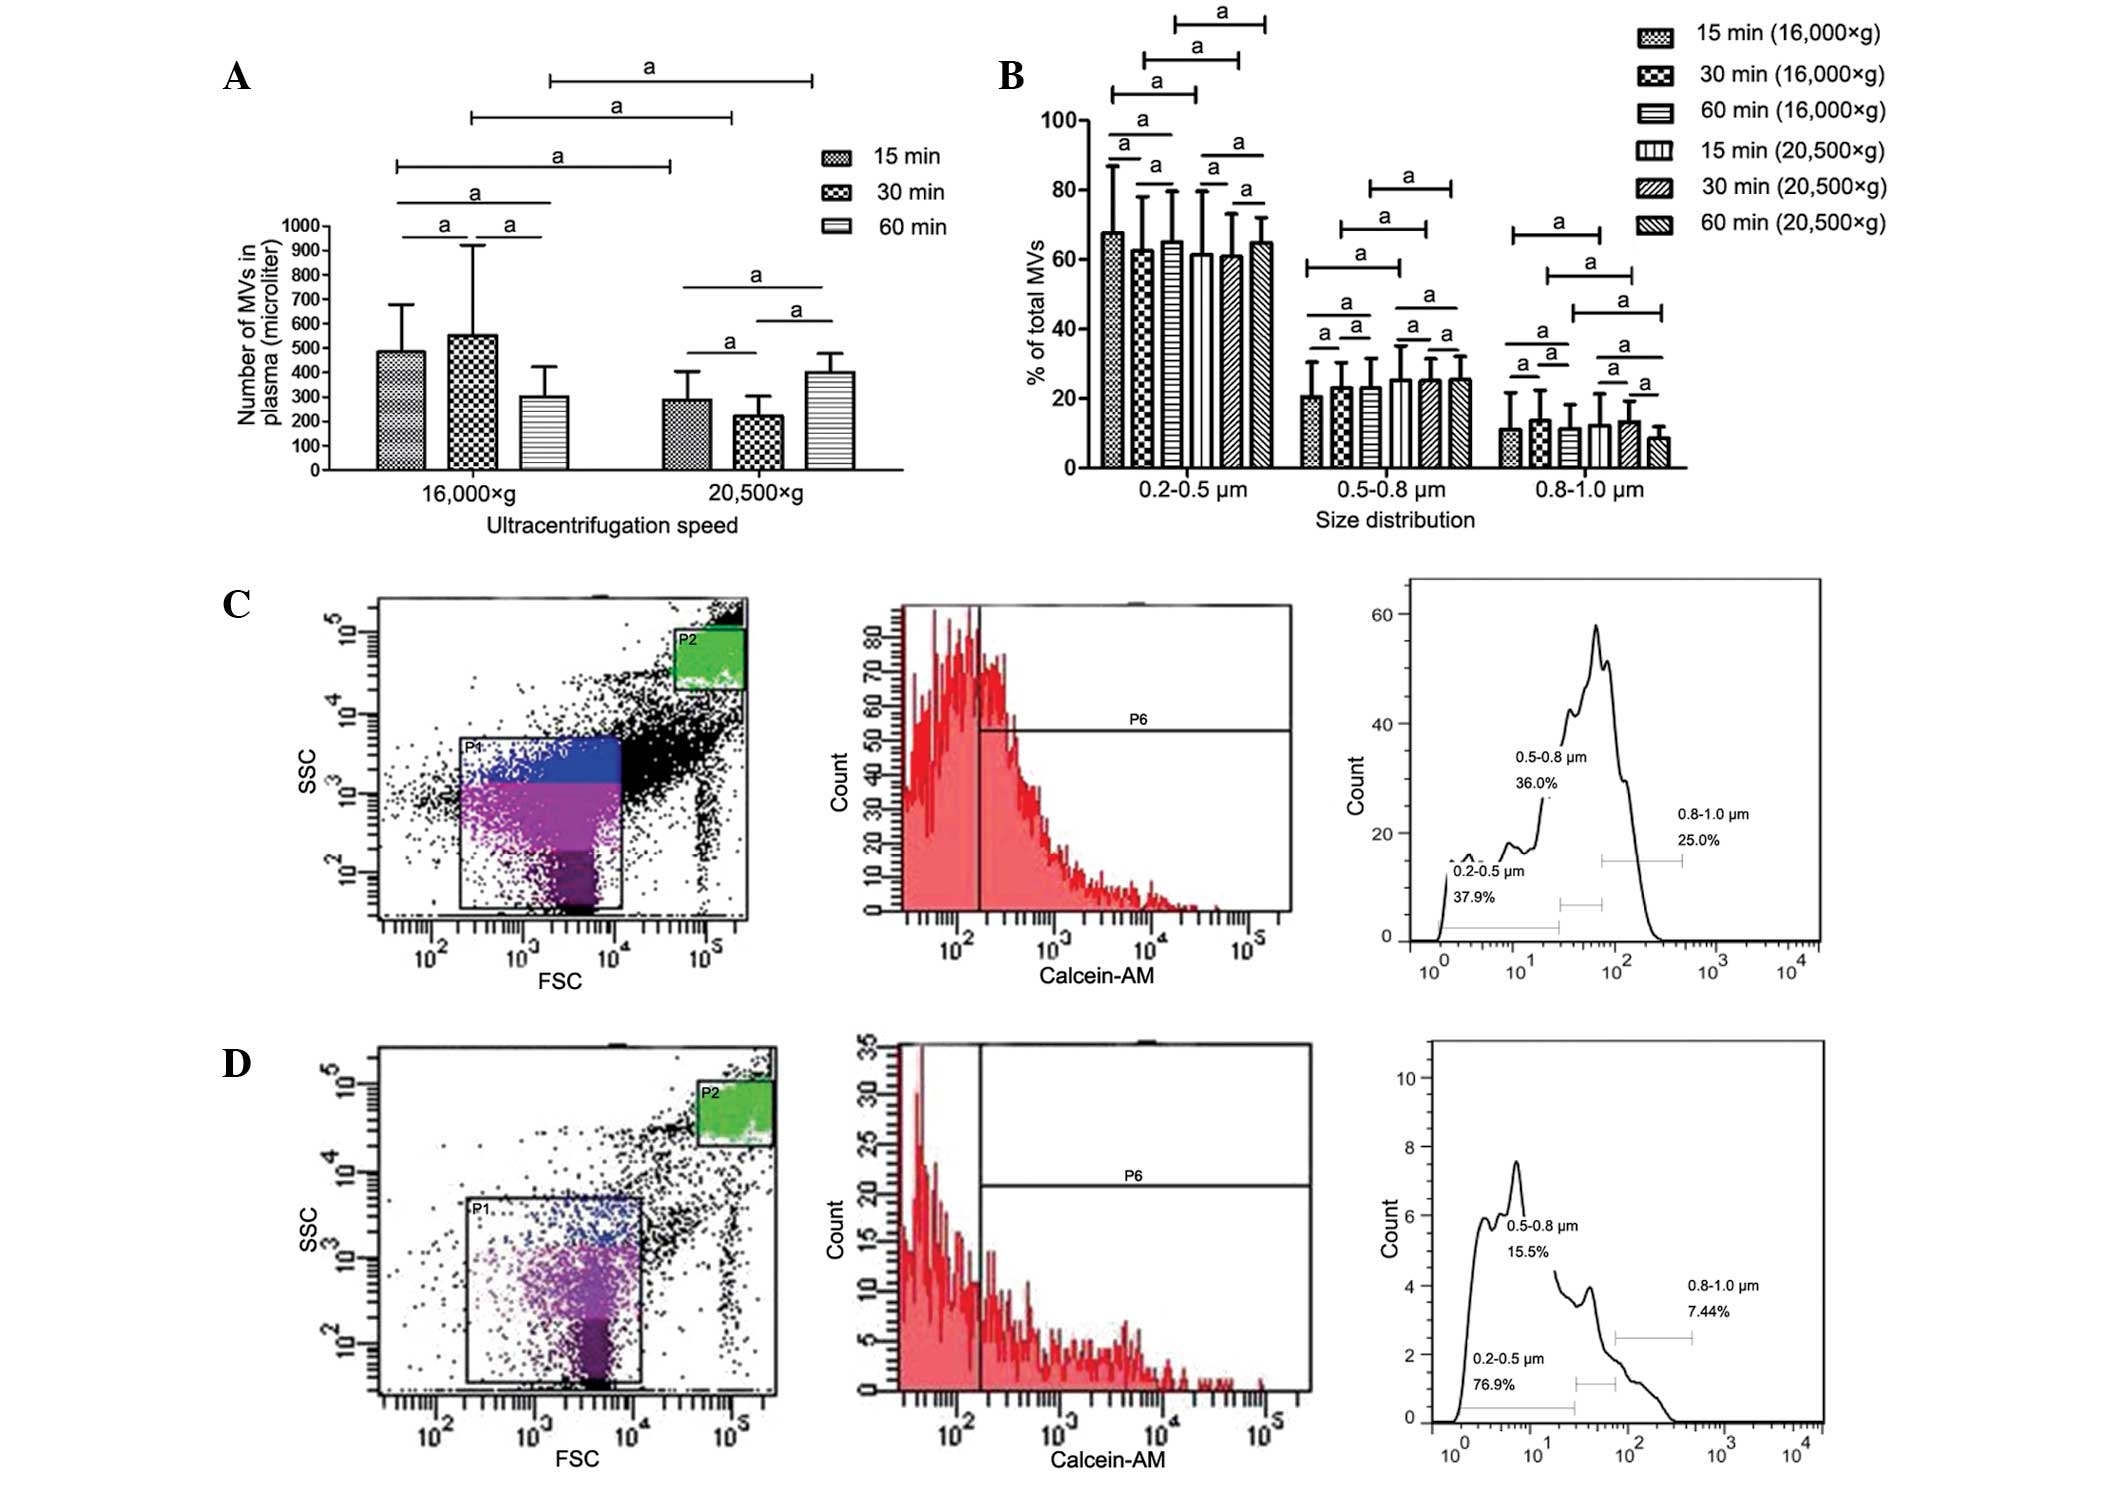
MV counts and size distribution are
not affected by centrifugation speed or time
Various centrifugation speeds and times have been
used in previous studies for MV isolation (8,13,20);
however, the effect of these variations in the parameters on MV
counts and size distribution is unclear. In the present study, the
differences arising from the various methods used for MV isolation
were investigated. MVs isolated by centrifugation at 16,000 or
20,500 × g for 15, 30 or 60 min were analyzed using FCM. No
statistically significant differences were detected in MV counts or
size distribution between samples prepared at different
centrifugation speeds, or among samples centrifuged for different
times at identical speeds (Fig.
3).
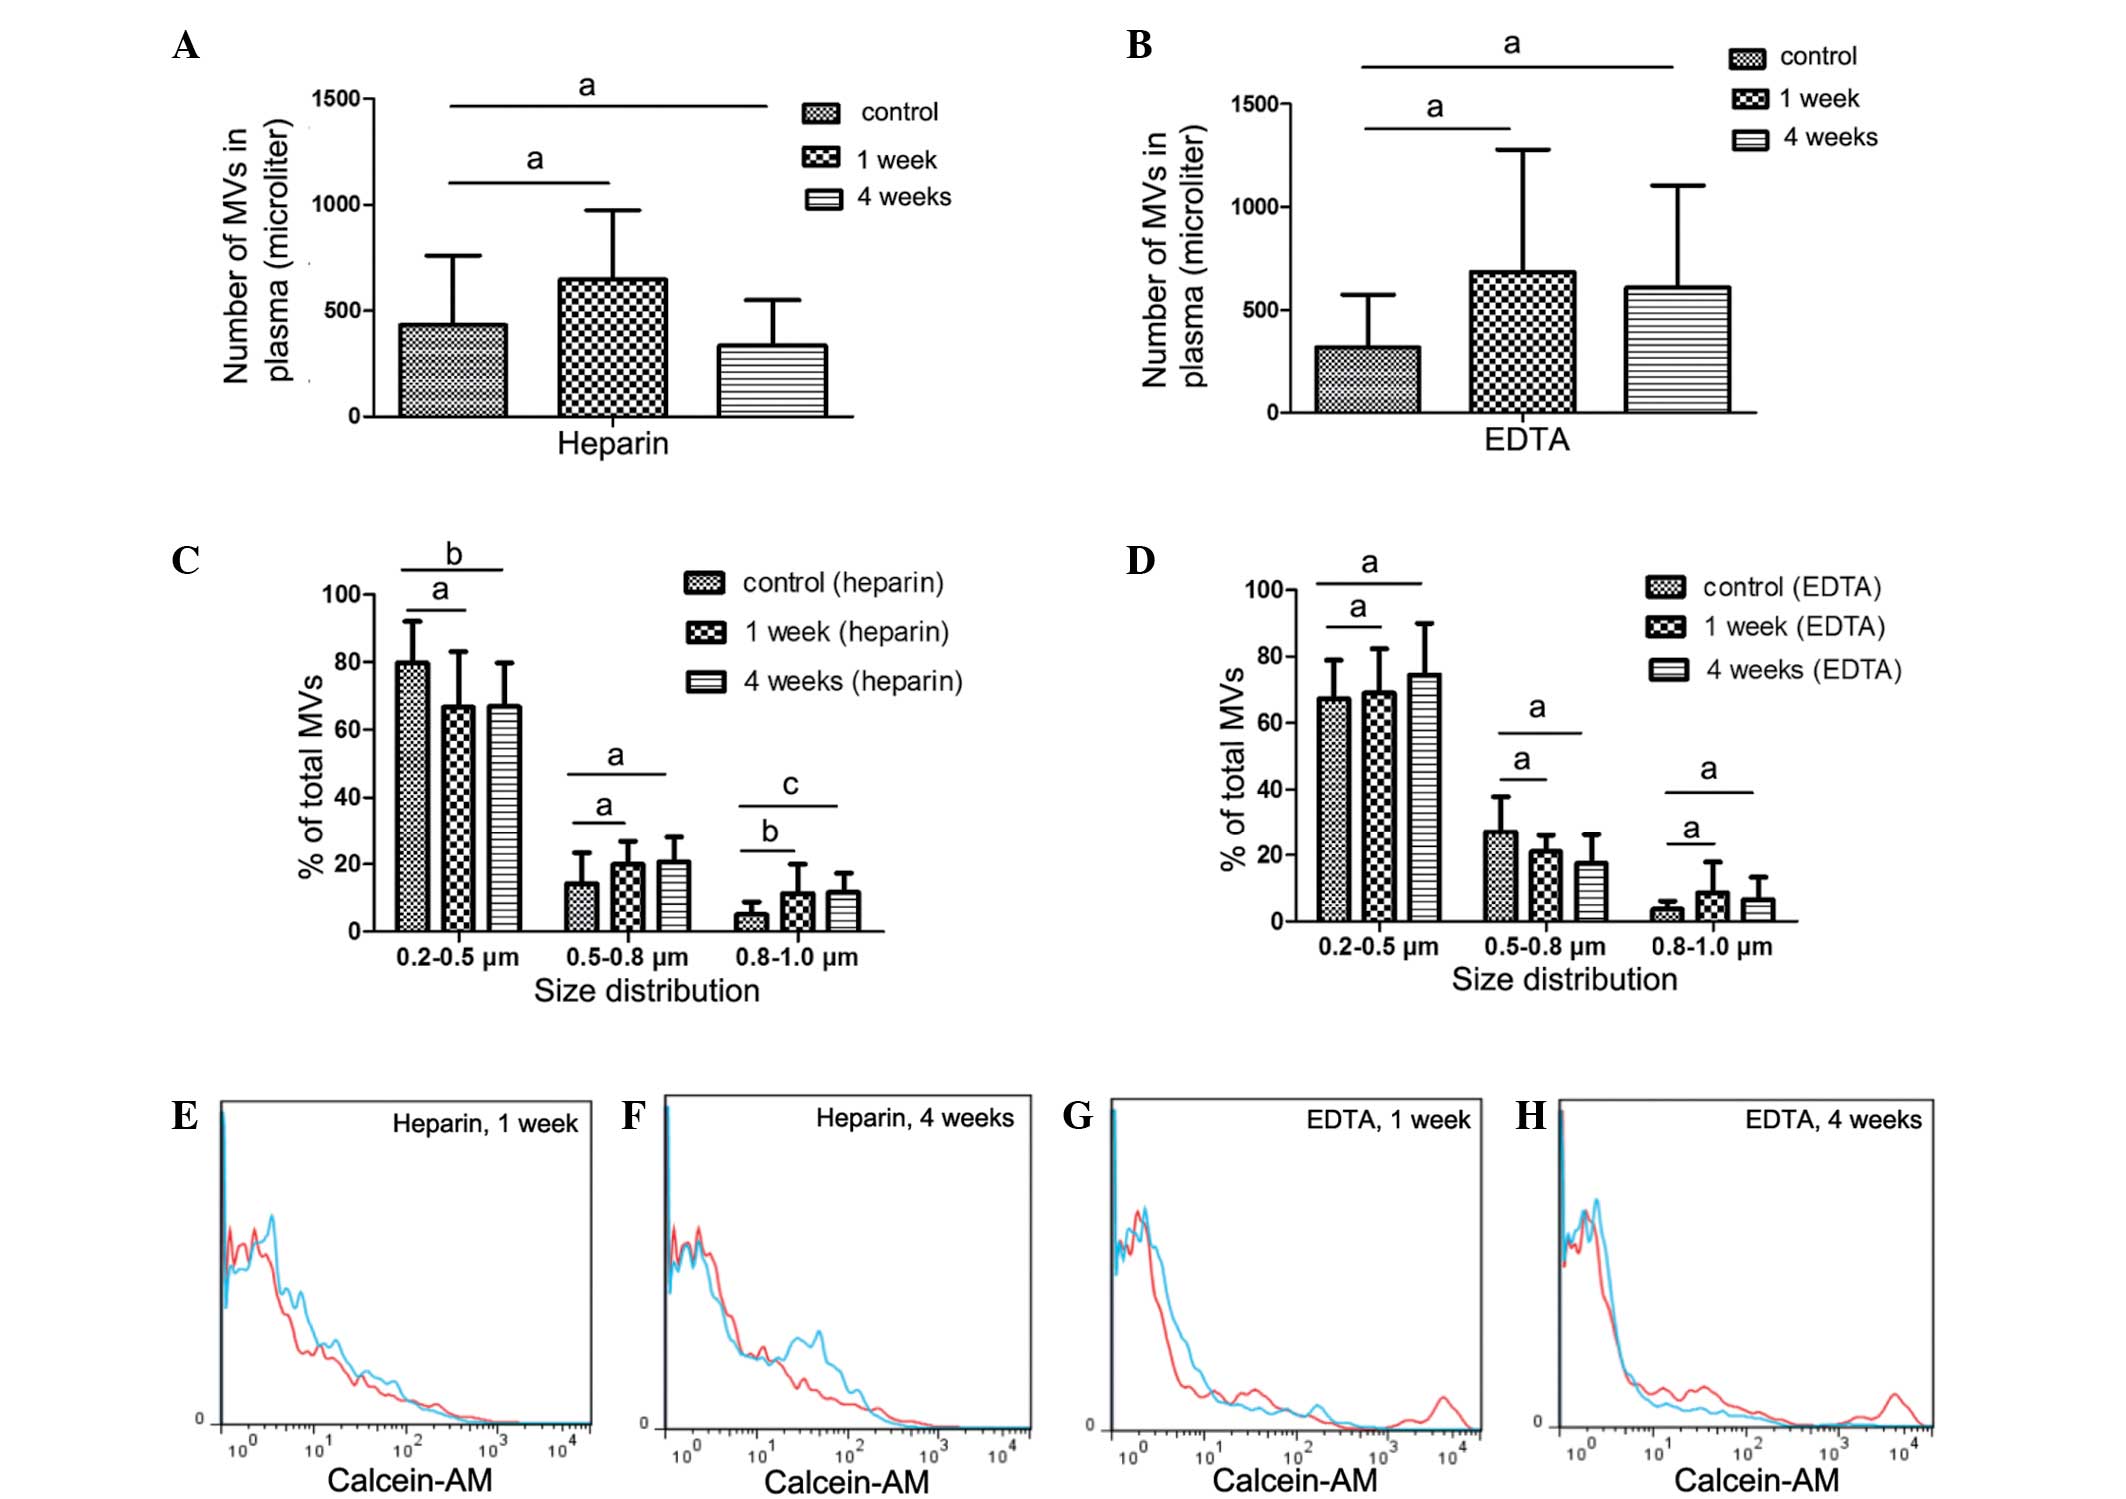
Counts and size of MVs from
heparin-anticoagulated samples vary with storage conditions
A number of studies have reported that heparin is
able to preserve MV counts (15,16).
Therefore, in the present study, heparin was used as the primary
anticoagulant in collected samples. In order to investigate the
effect of storage conditions on MV counts and size distribution,
the PFP or MVs were stored for different periods at various
temperatures until analysis (Fig. 4A, C,
E and F).
Counts and size of MVs from PFP stored at −80°C for
1 or 4 weeks were compared with the control samples (MVs that were
isolated immediately). Fig. 4C
demonstrates that MV size, but not count, was significantly
affected. After 1 week of storage of PFP, MV size was larger
compared with that of the control samples, with an increased
percentage of 0.8–1.0 µm MVs observed compared with the control
(P=0.025). After 4 weeks, the percentage of MVs distributed in the
0.8–1.0 µm group significantly increased (P=0.006), while the
percentage in the 0.2–0.5 µm group decreased compared with the
control (P=0.038).
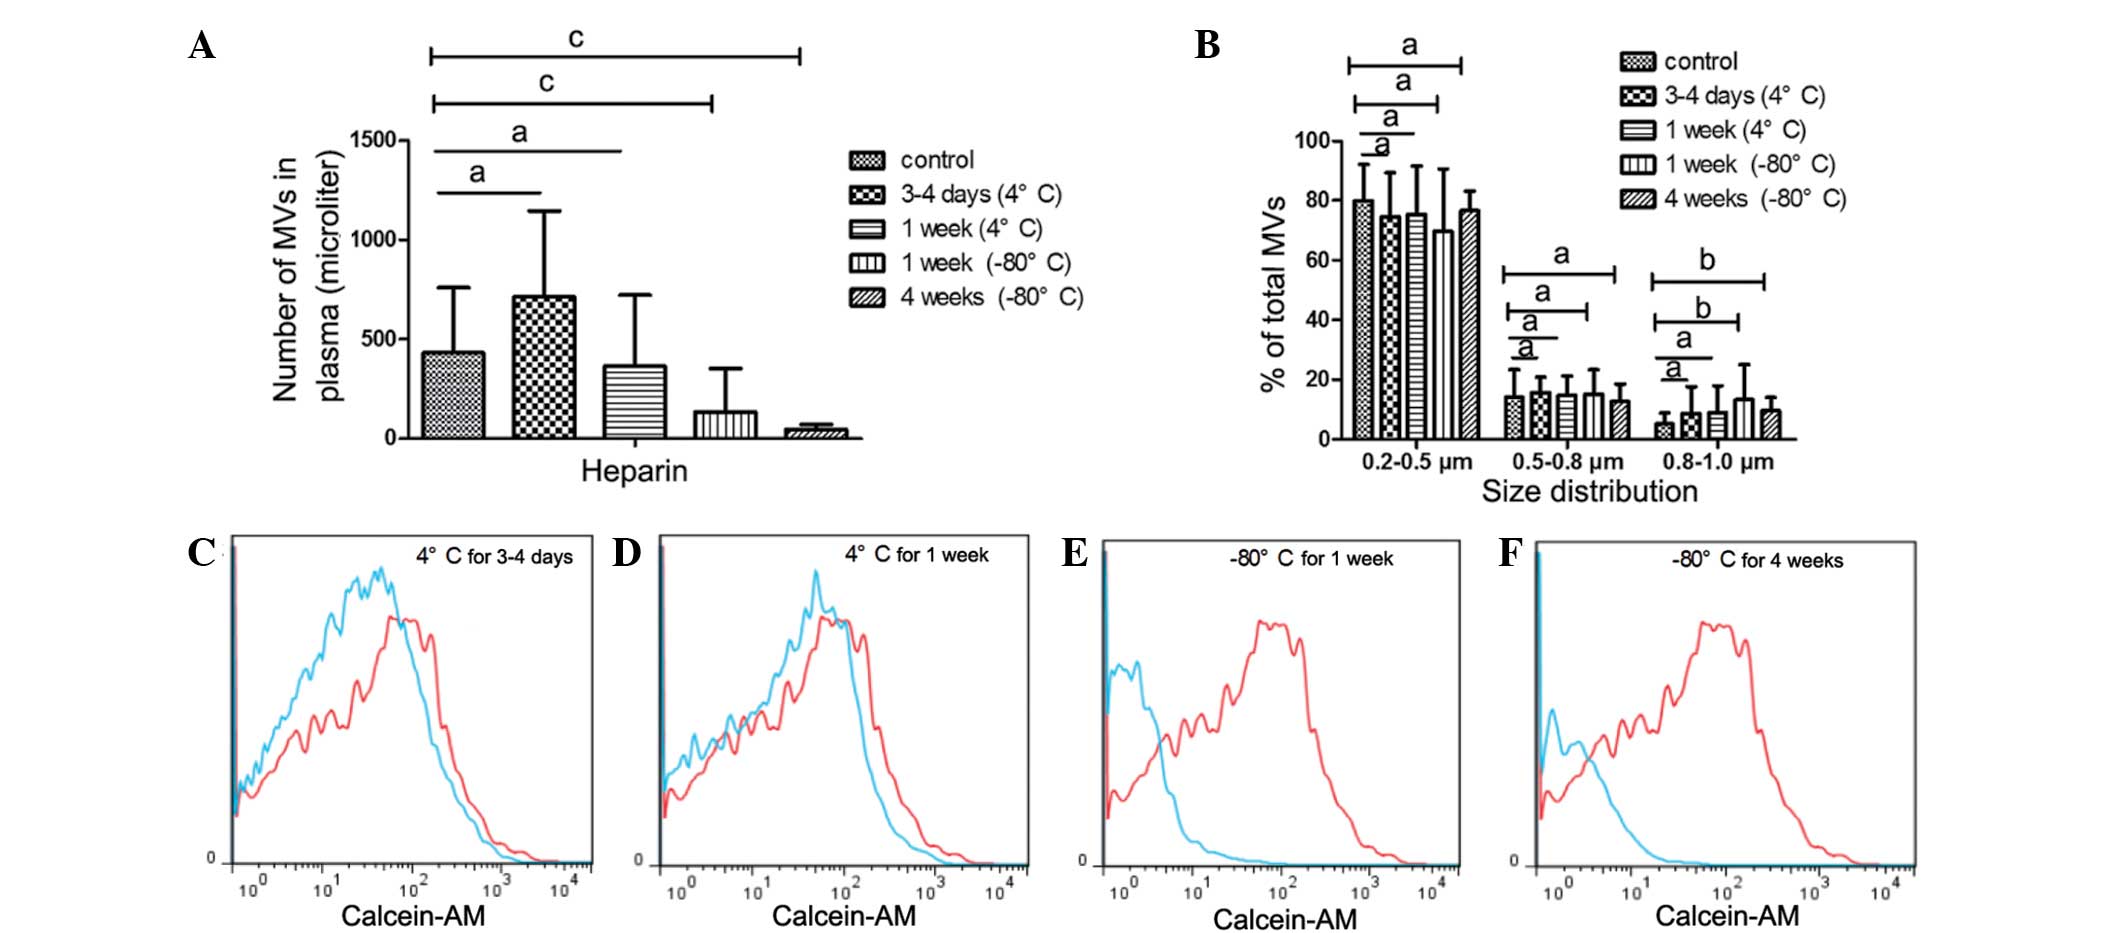
In addition to PFP, MVs is another mode of storage.
It was observed that freezing MVs at −80°C markedly affected the MV
count and size (Fig. 5). MV counts
significantly reduced after MVs were stored for 1 or 4 weeks at
−80°C (1 week, P=0.006; 4 weeks, P<0.001) compared with the
control, whereas the percentage of MVs in the 0.8–1.0 µm bead size
group increased (1 week, P=0.018; 4 weeks, P=0.014). By contrast,
MV counts and size distribution did not change after MVs were
stored at 4°C for 3–4 days or 1 week (Fig. 5A and B).
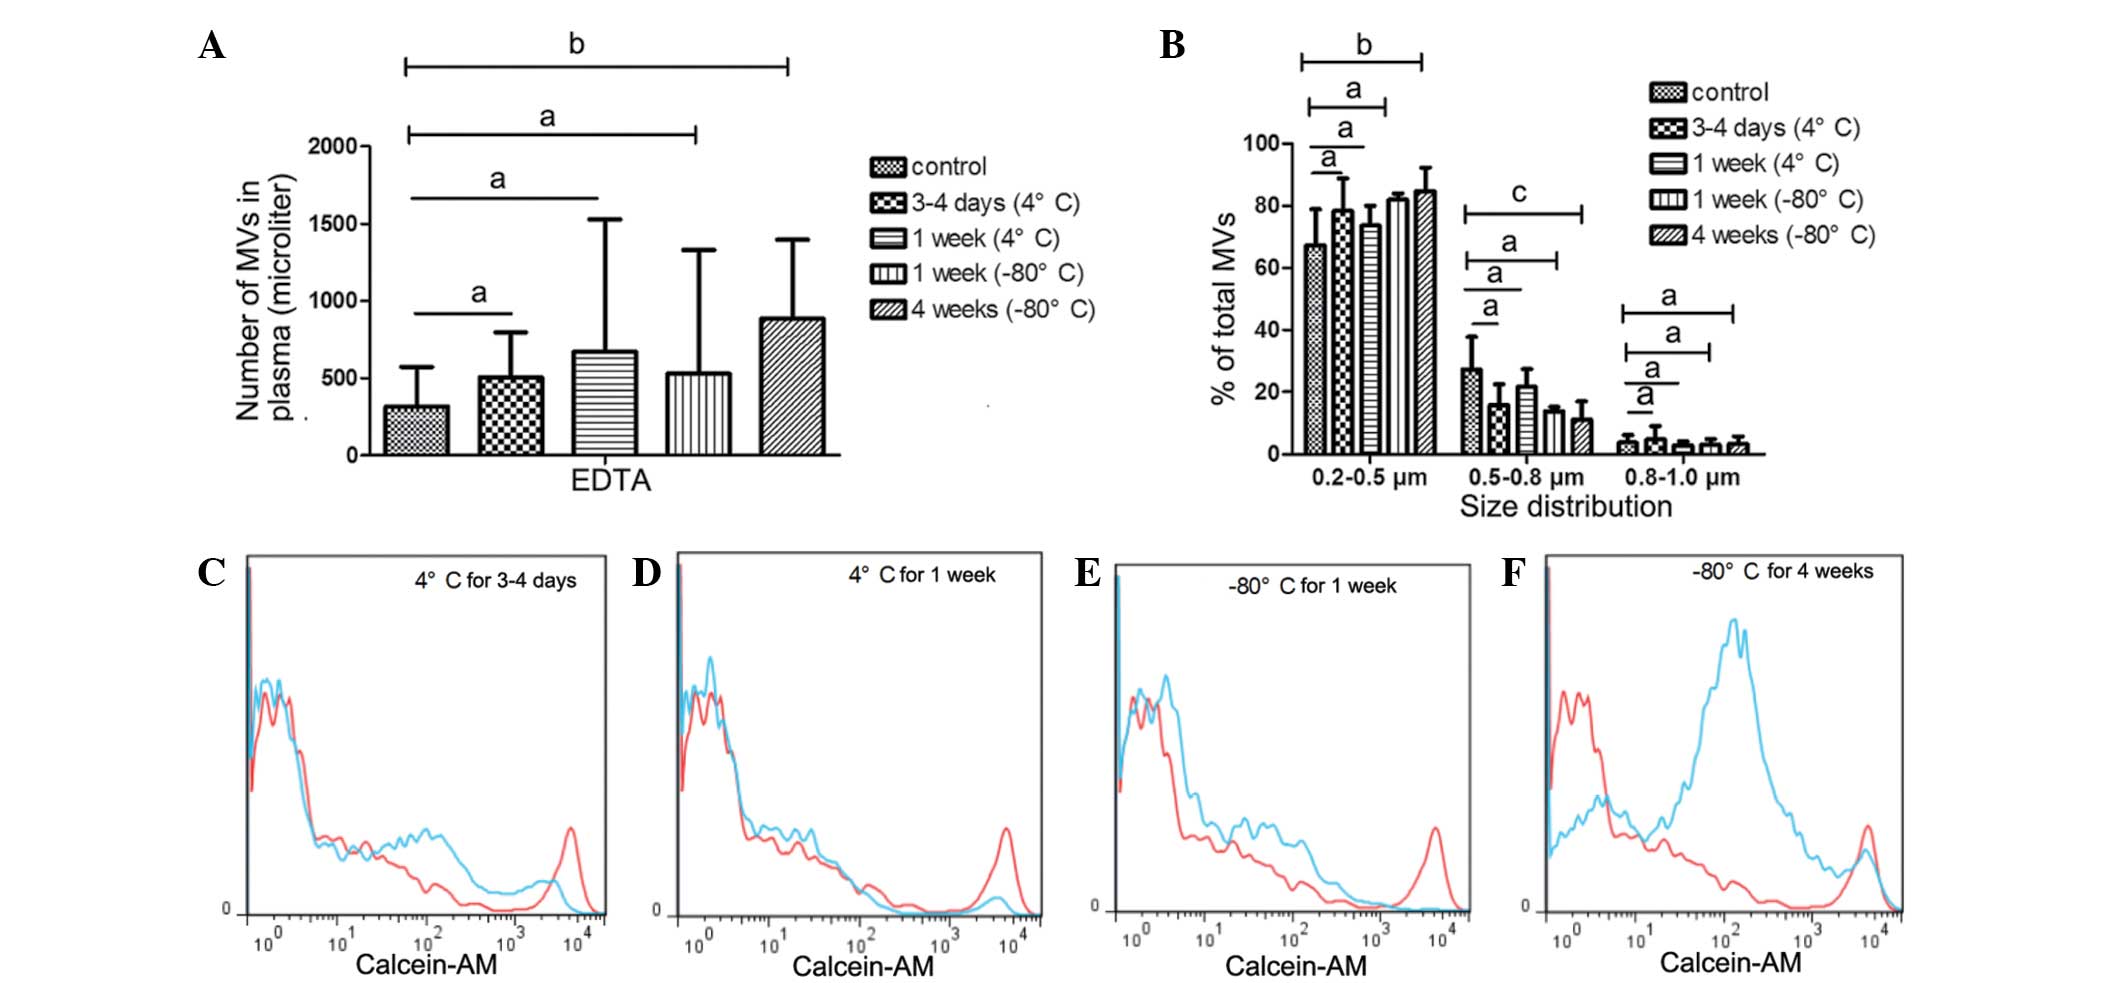
MVs from EDTA-anticoagulated
samples
Although a number of studies (15,16) have
indicated that MVs from EDTA-anticoagulated plasma do not
accurately evaluate the level of circulating MVs, EDTA is the most
frequently used anticoagulant in clinical settings. On the basis of
the protective effect of EDTA on blood cells, it was speculated
that EDTA would protect MVs from storage influences and prolong
safe storage time. Furthermore, the present study aimed to
determine whether EDTA was able to function as a feasible
alternative to heparin.
In the EDTA-anticoagulated PFP that was stored at
−80°C for 1 or 4 weeks, no statistically significant increase in MV
count was detected. Similarly, the size distribution of MVs in the
PFP stored at −80°C for 1 or 4 weeks was comparable with that in
the control samples, as shown in Fig.
4B, D, G and H.
MVs from EDTA-anticoagulated plasma stored at 4°C
for 0 days (control), 3–4 days or 1 week exhibited no statistically
significant differences in MV counts. Similarly, the size
distribution showed no significant differences in the MVs that were
stored at 4°C for up to 1 week (Fig.
6A–D), or those frozen at −80°C for 1 week (Fig. 6A, B and E). However, MV counts and
size were significantly influenced by freezing at −80°C for 4 weeks
(Fig. 6A, B and F). The number of
MVs increased (P=0.041 vs. control; Fig.
6A and F), whereas MV size gradually decreased. The percentage
of MVs in the 0.5–0.8 µm size distribution group significantly
decreased (P=0.008 vs. control) and the 0.2–0.5 µm group increased
(P=0.014 vs. control; Fig. 6B).
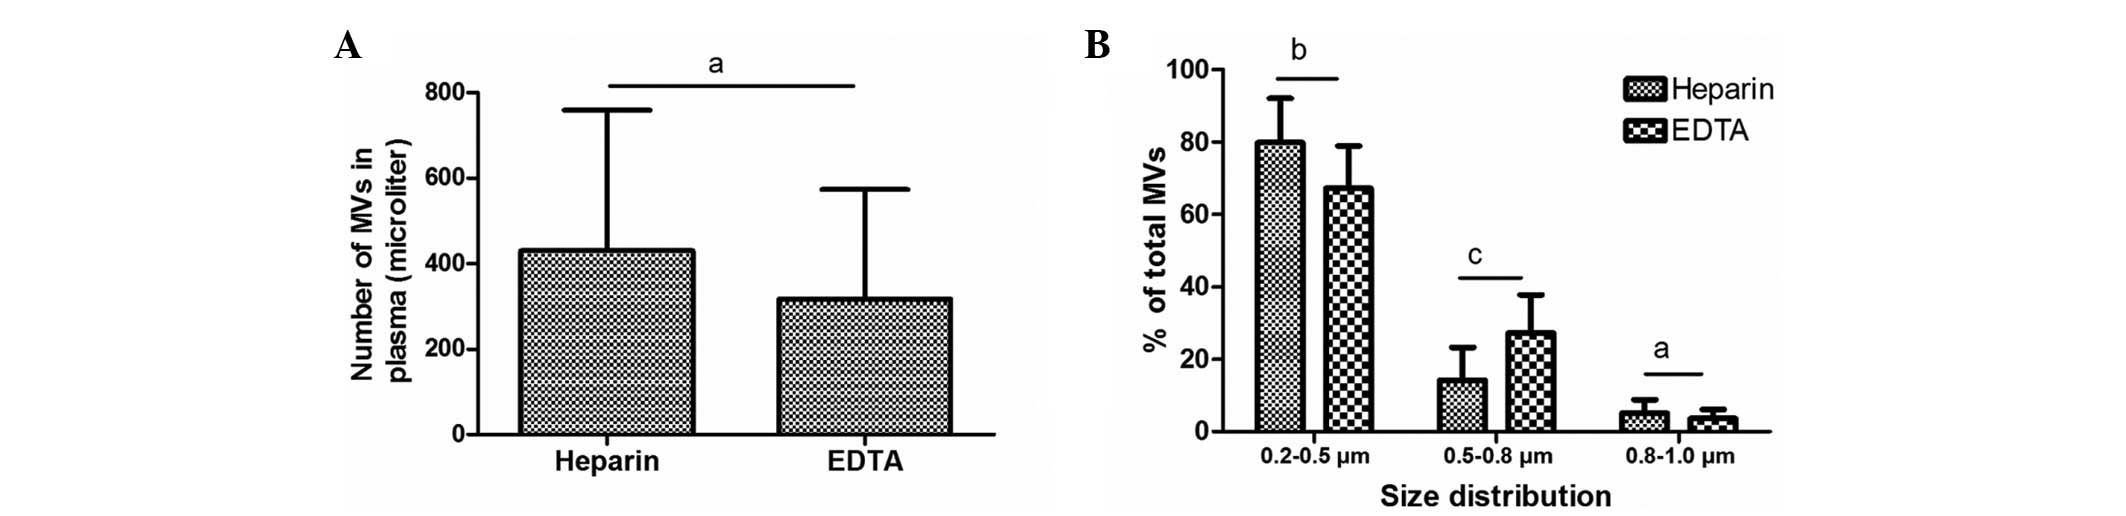
MV size distribution is affected by
the anticoagulant used, but MV count is not
Previous studies have reported differences in MV
counts between heparin- and EDTA-anticoagulated plasma using
Annexin V staining (13,15); however, no data has been published to
elucidate the impact of anticoagulant on MV counts following
calcein-AM labeling. Therefore, the present study compared the
counts and size distribution of MVs freshly isolated from plasma
anticoagulated with heparin and EDTA. Notably, no statistically
significant differences in the number of MVs were detected between
the samples treated with these two anticoagulants. In the EDTA and
heparin groups, MVs were predominantly distributed in the 0.2–0.5
µm size group, to a reduced degree in the 0.5–0.8 µm group and
minimally in the 0.8–1.0 µm group. However, the size of MVs in the
EDTA-anticoagulated plasma was increased compared with that in the
heparin-anticoagulated plasma: The percentage increased in the
0.5–0.8 µm size distribution range (P=0.002) and decreased in the
0.2–0.5 µm group (P=0.032), compared with the size of MVs isolated
from heparin-anticoagulated plasma (Fig.
7).
Discussion
In the present study, the effects of pre-analytical
variables, including centrifugation speed and duration, and storage
conditions on MV measurement using FCM with calcein-AM staining
were evaluated. In addition, the impact of heparin and EDTA
anticoagulants on MV counts and size distribution were compared.
The data indicated that MV counts are independent of anticoagulant,
centrifugation speed and duration, but are affected by storage
conditions, while the size of MVs varied with plasma anticoagulant
and storage conditions.
The profile of circulating MVs released by cells
correlates with the development, progression and metastasis of a
variety of cancers (24–26). According to the widely accepted
principle that phosphatidylserine (PS) exposure on the cell surface
is a common feature of MV release, Annexin V, a specific ligand to
PS, is used for MV detection by FCM in the majority of experiments
(13,15,16).
However, reports of the existence of Annexin V-negative MVs
(22,27,28)
challenge the basis of this detection approach. Furthermore, PS
exposure occurs in apoptosis and necrosis, which may lead to
false-positive results using FCM. Thus, it is essential to identify
a novel reagent for the detection of MVs. In the present study,
calcein-AM was used to identify MVs, primarily due to the fact that
it is colorless and nonfluorescent until hydrolyzed in cells by
nonspecific esterases, and the leakage of the hydrolyzed compound
out of cells is markedly slower compared with its parent compound,
referred to the product introduction of calcein-AM. In addition,
calcein-AM staining is independent of PS content and calcium
concentration. The latter is a major drawback of Annexin V, leading
to different results in MV counts between heparin- and
EDTA-anticoagulated plasma. Therefore, calcein-AM may be suitable
and relatively specific for intact MV labeling. To the best of our
knowledge, the present study is the first to apply the calcein-AM
staining method to label clinical circulating MVs. Further
investigations are required to compare the differences in MV counts
and size distribution between calcein-AM and Annexin V labeling in
different conditions.
Previous studies have reported (13,15) that
MV counts are substantially reduced in blood when using EDTA
compared with heparin; however, in the present study, no
statistically significant differences in MV count were detected
between EDTA and heparin using calcein-AM staining. A previous
study suggested that calcium chelation by EDTA contributed to the
decreased MV counts (15), while a
different study attributed this difference to microvesiculation
in vitro with heparin (16).
The present data support the former explanation, indicating that
the primary distinction between calcein-AM and Annexin V is the
effect of calcium. In the present experiments that employed an MV
staining reagent independent of calcium, no differences were
observed in MV counts between samples treated with EDTA and
heparin. EDTA has been recommended as the first line anticoagulant
for hematological testing as it allows the optimal preservation of
cellular components and morphology of blood cells (29). The results of the present study
indicate that EDTA may be more suitable than heparin for MV
detection by FCM, as EDTA preserves MV counts and size more
effectively compared with heparin. Connor et al (30) suggested that, for blood samples that
are not immediately processed, MV measurement should be performed
using EDTA-anticoagulated samples (31), which is consistent with the results
of the present study.
Isolation of MVs is a time-consuming process which
increased the difficulty of large-scale sample preparation and
detection. For this reason, it may be more practical and convenient
if MVs could be obtained in a shorter time. The results of the
present study comparing different centrifugation speeds and times
may meet this requirement, thus assisting in batch processing of
samples and promoting the development of MV detection. An excessive
centrifugation speed may lead to fragment contamination of the MV
pellet, so proper speed is critical for intact MV isolation. The
present data indicated that centrifugation of PFP at 16,000 × g for
15 min was sufficient to achieve the requirements of MV
isolation.
It may be optimal to proceed to isolation and
detection of MVs immediately after plasma preparation. However, in
certain cases, samples from different patients cannot be processed
immediately and sample storage is necessary, which is usually as
PFP or MVs (13,15). Ayers et al (13) reported that MV counts were
significantly reduced in MVs that were stored at −80°C for an
extended duration, which is consistent with the present results.
This may be due to the adsorption of MVs to sample tubes, or MVs
shrinking to a size that is below the detection limit of FCM for
samples frozen at a low temperature for a long period. However, it
appears that this explanation only applies to MVs from
heparin-anticoagulated plasma, as the counts of MVs from
EDTA-anticoagulated plasma increased in the MVs that were frozen at
−80°C for 4 weeks. The underlying mechanism remains unknown;
however, it is plausible that this phenomenon may be associated
with the calcium-chelating properties of the anticoagulant. PFP,
rather than MVs, appears to be the preferable mode of sample
storage, on the basis of the present results and the findings of
previous experiments (15).
A number of studies have reported that MV size
distribution modulates according to diverse stimuli in vitro
(20,21), indicating that MV size may be
associated with disease condition or cause. Although previous
studies have demonstrated the utility of electron microscopy,
atomic force microscopy (AFM), dynamic light scattering (DLS) and
microfluidics in measuring the size of circulating MVs (2,32,33),
these detection methods are relatively time-consuming and
complicated. Compared with the aforementioned methods, FCM is
user-friendly and is widely used in MV detection. However, little
is known about MV size distribution as determined by FCM in samples
from healthy tissues, or the effects of sample preparation methods.
In the present study, calibration beads were used to define MV size
and assess the impact of various preparation conditions on sample
size distribution. MV size was predominantly 0.2–0.5 µm in
diameter, as observed using transmission electron microscopy (TEM),
AFM or DLS (32,33). However, MVs isolated from different
anticoagulants exhibited diverse size distributions under different
conditions. MVs from heparin-anticoagulated plasma frozen at low
temperature were enlarged over time and presented with reduced
counts, whereas the opposite was observed in the MVs stored in
EDTA-anticoagulated plasma. For MVs from heparin-anticoagulated
plasma, this may be a result of the aggregation of MVs into a
reduced number of larger vesicles. For MVs from EDTA-anticoagulated
plasma, larger MVs may have reduced to a size that is detectable
using FCM. Notably, the average size of freshly isolated (i.e.
never stored) MVs from EDTA-anticoagulated plasma is increased
compared with that of MVs from heparin-anticoagulated plasma.
Future investigations may be required in order to further elucidate
these findings.
In conclusion, the present study evaluated the
impact of pre-analytical variables including anticoagulant,
centrifugation speed and time, and storage conditions on MV
measurements using FCM with calcein-AM staining. Analysis of these
factors is essential for the development of MVs as diagnostic and
prognostic biomarkers for disease.
Acknowledgements
The authors would like to thank Yong Xu and Zhihui
Liang from the Institute of Biochemistry (School of Basic Medicine,
Huazhong University of Science and Technology, Wuhan, China) for
their assistance in FCM detection and data analysis. In addition,
the authors thank the healthy volunteers for their cooperation in
providing blood specimens for the present study. This study was
supported by grants from the National Natural Science Foundation of
China (nos. 81272624, 81300259 and 81170497).
Abbreviations:
|
MVs
|
microvesicles
|
|
FCM
|
flow cytometry
|
|
EDTA
|
ethylenediaminetetraacetic acid
|
|
PBS
|
phosphate-buffered saline
|
|
PFP
|
platelet-free plasma
|
|
PS
|
phosphatidylserine
|
|
AFM
|
atomic force microscopy
|
|
DLS
|
dynamic light scattering
|
|
TEM
|
transmission electron microscopy
|
References
|
1
|
Théry C, Ostrowski M and Segura E:
Membrane vesicles as conveyors of immune responses. Nat Rev
Immunol. 9:581–593. 2009. View
Article : Google Scholar : PubMed/NCBI
|
|
2
|
Ashcroft BA, de Sonneville J, Yuana Y,
Osanto S, Bertina R, Kuil ME and Oosterkamp TH: Determination of
the size distribution of blood microparticles directly in plasma
using atomic force microscopy and microfluidics. Biomed
Microdevices. 14:641–649. 2012. View Article : Google Scholar : PubMed/NCBI
|
|
3
|
Dalton AJ: Microvesicles and vesicles of
multivesicular bodies versus ‘virus-like’ particles. J Natl Cancer
Inst. 54:1137–1148. 1975.PubMed/NCBI
|
|
4
|
Keller S, Ridinger J, Rupp AK, Janssen JW
and Altevogt P: Body fluid derived exosomes as a novel template for
clinical diagnostics. J Transl Med. 9:862011. View Article : Google Scholar : PubMed/NCBI
|
|
5
|
Hata T, Murakami K, Nakatani H, Yamamoto
Y, Matsuda T and Aoki N: Isolation of bovine milk-derived
microvesicles carrying mRNAs and microRNAs. Biochem Biophys Res
Commun. 396:528–533. 2010. View Article : Google Scholar : PubMed/NCBI
|
|
6
|
Pisitkun T, Shen RF and Knepper MA:
Identification and proteomic profiling of exosomes in human urine.
Proc Natl Acad Sci USA. 101:13368–13373. 2004. View Article : Google Scholar : PubMed/NCBI
|
|
7
|
Runz S, Keller S, Rupp C, Stoeck A, Issa
Y, Koensgen D, Mustea A, Sehouli J, Kristiansen G and Altevogt P:
Malignant ascites-derived exosomes of ovarian carcinoma patients
contain CD24 and EpCAM. Gynecol Oncol. 107:563–571. 2007.
View Article : Google Scholar : PubMed/NCBI
|
|
8
|
Ghosh AK, Secreto CR, Knox TR, Ding W,
Mukhopadhyay D and Kay NE: Circulating microvesicles in B-cell
chronic lymphocytic leukemia can stimulate marrow stromal cells:
Implications for disease progression. Blood. 115:1755–1764. 2010.
View Article : Google Scholar : PubMed/NCBI
|
|
9
|
Bernal-Mizrachi L, Jy W, Jimenez JJ,
Pastor J, Mauro LM, Horstman LL, de Marchena E and Ahn YS: High
levels of circulating endothelial microparticles in patients with
acute coronary syndromes. Am Heart J. 145:962–970. 2003. View Article : Google Scholar : PubMed/NCBI
|
|
10
|
Sellam J, Proulle V, Jüngel A, Ittah M,
Richard Miceli C, Gottenberg JE, Toti F, Benessiano J, Gay S,
Freyssinet JM and Mariette X: Increased levels of circulating
microparticles in primary Sjögren's syndrome, systemic lupus
erythematosus and rheumatoid arthritis and relation with disease
activity. Arthritis Res Ther. 11:R1562009. View Article : Google Scholar : PubMed/NCBI
|
|
11
|
Toth B, Liebhardt S, Steinig K, Ditsch N,
Rank A, Bauerfeind I, Spannagl M, Friese K and Reininger AJ:
Platelet-derived microparticles and coagulation activation in
breast cancer patients. Thromb Haemost. 100:663–669.
2008.PubMed/NCBI
|
|
12
|
Galindo-Hernandez O, Villegas-Comonfort S,
Candanedo F, González-Vázquez MC, Chavez-Ocana S,
Jimenez-Villanueva X, Sierra-Martinez M and Salazar EP: Elevated
concentration of microvesicles isolated from peripheral blood in
breast cancer patients. Arch Med Res. 44:208–214. 2013. View Article : Google Scholar : PubMed/NCBI
|
|
13
|
Ayers L, Kohler M, Harrison P, Sargent I,
Dragovic R, Schaap M, Nieuwland R, Brooks SA and Ferry B:
Measurement of circulating cell-derived microparticles by flow
cytometry: Sources of variability within the assay. Thromb Res.
127:370–377. 2011. View Article : Google Scholar : PubMed/NCBI
|
|
14
|
Ueba T, Haze T, Sugiyama M, Higuchi M,
Asayama H, Karitani Y, Nishikawa T, Yamashita K, Nagami S, Nakayama
T, et al: Level, distribution and correlates of platelet-derived
microparticles in healthy individuals with special reference to the
metabolic syndrome. Thromb Haemost. 100:280–285. 2008.PubMed/NCBI
|
|
15
|
Jayachandran M, Miller VM, Heit JA and
Owen WG: Methodology for isolation, identification and
characterization of microvesicles in peripheral blood. J Immunol
Methods. 375:207–214. 2012. View Article : Google Scholar : PubMed/NCBI
|
|
16
|
Shah MD, Bergeron AL, Dong JF and López
JA: Flow cytometric measurement of microparticles: Pitfalls and
protocol modifications. Platelets. 19:365–372. 2008. View Article : Google Scholar : PubMed/NCBI
|
|
17
|
Breimo ES and Østerud B: Generation of
tissue factor-rich microparticles in an ex vivo whole blood model.
Blood Coagul Fibrinolysis. 16:399–405. 2005. View Article : Google Scholar : PubMed/NCBI
|
|
18
|
Piersma SR, Broxterman HJ, Kapci M, de
Haas RR, Hoekman K, Verheul HM and Jiménez CR: Proteomics of the
TRAP-induced platelet releasate. J Proteomics. 72:91–109. 2009.
View Article : Google Scholar : PubMed/NCBI
|
|
19
|
Jy W, Horstman LL, Jimenez JJ, Ahn YS,
Biró E, Nieuwland R, Sturk A, Dignat-George F, Sabatier F,
Camoin-Jau L, et al: Measuring circulating cell-derived
microparticles. J Thromb Haemost. 2:1842–1851. 2004. View Article : Google Scholar : PubMed/NCBI
|
|
20
|
Bernimoulin M, Waters EK, Foy M, Steele
BM, Sullivan M, Falet H, Walsh MT, Barteneva N, Geng JG, Hartwig
JH, et al: Differential stimulation of monocytic cells results in
distinct populations of microparticles. J Thromb Haemost.
7:1019–1028. 2009. View Article : Google Scholar : PubMed/NCBI
|
|
21
|
Sun L, Wang HX, Zhu XJ, Wu PH, Chen WQ,
Zou P, Li QB and Chen ZC: Serum deprivation elevates the levels of
microvesicles with different size distributions and selectively
enriched proteins in human myeloma cells in vitro. Acta Pharmacol
Sin. 35:381–393. 2014. View Article : Google Scholar : PubMed/NCBI
|
|
22
|
Shet AS, Aras O, Gupta K, Hass MJ, Rausch
DJ, Saba N, Koopmeiners L, Key NS and Hebbel RP: Sickle blood
contains tissue factor-positive microparticles derived from
endothelial cells and monocytes. Blood. 102:2678–2683. 2003.
View Article : Google Scholar : PubMed/NCBI
|
|
23
|
Jayachandran M, Litwiller RD, Owen WG,
Heit JA, Behrenbeck T, Mulvagh SL, Araoz PA, Budoff MJ, Harman SM
and Miller VM: Characterization of blood borne microparticles as
markers of premature coronary calcification in newly menopausal
women. Am J Physiol Heart Circ Physiol. 295:H931–H938. 2008.
View Article : Google Scholar : PubMed/NCBI
|
|
24
|
Yamada N, Tsujimura N, Kumazaki M,
Shinohara H, Taniguchi K, Nakagawa Y, Naoe T and Akao Y: Colorectal
cancer cell-derived microvesicles containing microRNA-1246 promote
angiogenesis by activating Smad 1/5/8 signaling elicited by PML
down-regulation in endothelial cells. Biochim Biophys Acta.
1839:1256–1272. 2014. View Article : Google Scholar : PubMed/NCBI
|
|
25
|
Zhang W, Zhao P, Xu XL, Cai L, Song ZS,
Cao DY, Tao KS, Zhou WP, Chen ZN and Dou KF: Annexin A2 promotes
the migration and invasion of human hepatocellular carcinoma cells
in vitro by regulating the shedding of CD147-harboring
microvesicles from tumor cells. PLoS One. 8:e672682013. View Article : Google Scholar : PubMed/NCBI
|
|
26
|
Al-Nedawi K, Meehan B, Micallef J, Lhotak
V, May L, Guha A and Rak J: Intercellular transfer of the oncogenic
receptor EGFRvIII by microvesicles derived from tumour cells. Nat
Cell Biol. 10:619–624. 2008. View
Article : Google Scholar : PubMed/NCBI
|
|
27
|
Nielsen CT, Østergaard O, Johnsen C,
Jacobsen S and Heegaard NH: Distinct features of circulating
microparticles and their relationship to clinical manifestations in
systemic lupus erythematosus. Arthritis Rheum. 63:3067–3077. 2011.
View Article : Google Scholar : PubMed/NCBI
|
|
28
|
Joop K, Berckmans RJ, Nieuwland R,
Berkhout J, Romijn FP, Hack CE and Sturk A: Microparticles from
patients with multiple organ dysfunction syndrome and sepsis
support coagulation through multiple mechanisms. Thromb Haemost.
85:810–820. 2001.PubMed/NCBI
|
|
29
|
Banfi G, Salvagno GL and Lippi G: The role
of ethylenediamine tetraacetic acid (EDTA) as in vitro
anticoagulant for diagnostic purposes. Clin Chem Lab Med.
45:565–576. 2007. View Article : Google Scholar : PubMed/NCBI
|
|
30
|
Connor DE, Exner T, Ma DD and Joseph JE:
Detection of the procoagulant activity of microparticle-associated
phosphatidylserine using XACT. Blood Coagul Fibrinolysis.
20:558–564. 2009. View Article : Google Scholar : PubMed/NCBI
|
|
31
|
Yuana Y, Bertina RM and Osanto S:
Pre-analytical and analytical issues in the analysis of blood
microparticles. Thromb Haemost. 105:396–408. 2011. View Article : Google Scholar : PubMed/NCBI
|
|
32
|
György B, Módos K, Pállinger E, Pálóczi K,
Pásztói M, Misják P, Deli MA, Sipos A, Szalai A, Voszka I, et al:
Detection and isolation of cell-derived microparticles are
compromised by protein complexes resulting from shared biophysical
parameters. Blood. 117:e39–e48. 2011. View Article : Google Scholar : PubMed/NCBI
|
|
33
|
Lawrie AS, Albanyan A, Cardigan RA, Mackie
IJ and Harrison P: Microparticle sizing by dynamic light scattering
in fresh-frozen plasma. Vox Sang. 96:206–212. 2009. View Article : Google Scholar : PubMed/NCBI
|