Introduction
Acute pancreatitis (AP) is a severe inflammatory
disease that accounts for >220,000 hospital admissions in the
United States each year (1).
Although there has been recent progress in the diagnosis and
treatment of AP, the incidence of AP has not decreased and its
serious systemic complications are a worldwide health issue
(2). In certain cases, severe AP
(SAP) may lead to multiple organ failure, and thus the mortality
rate among patients with SAP may approach 30% (3). Therefore, it is crucial to identify
effective early diagnostic markers for AP, and particularly for
SAP. The level of serum amylase is a commonly-used clinical
indicator for the severity of AP; however, this level not
particularly sensitive and it is often difficult to obtain a
pancreatic specimen from patients with AP for pathological analysis
(4,5).
E-cadherin is a calcium-dependent cell-cell adhesion
molecule that has been linked to cancer development and
inflammatory disorders (6,7). During the inflammatory process,
cell-cell contacts tend to dissolve, which permits the unregulated
movement of fluids and electrolytes into the interstitial space,
resulting in tissue edema (8). Once
AP has been initiated, the appearance of inflammatory infiltration
and interstitial edema are common features (9). Therefore, it is hypothesized that the
expression levels of E-cadherin fluctuate during the progression of
AP. The aim of the present study was to establish an animal model
of pancreatitis and evaluate the levels of soluble E-cadherin, in
order to assess its efficacy as a marker of AP severity.
Materials and methods
Pancreatitic animal model and
experimental design
Animal experiments were authorized according to the
Guidance Suggestions for the Care and Use of Laboratory Animals
issued by the Ministry of Science and Technology of the People's
Republic of China, and were approved by the Ethics Committee of the
Nanjing Medical University Affiliated Wuxi Second Hospital (Wuxi,
China). Sprague Dawley (SD) rats were supplied by the Sino-British
SIPPR/BK Laboratory Animal Co., Ltd., (Shanghai, China). Animal
experiments were conducted as described in previous studies
(10,11) at Nanjing Medical University
Affiliated Wuxi No. 2 People's Hospital between June 2013 and July
2014. In brief, 24 healthy adult male Sprague Dawley (SD) rats,
weighing 170±15.5 g, were randomly assigned into two treatment
groups (n=12 per group). In the high concentration L-arginine
(HCLa) group, each SD rat received two intraperitoneal injections
of 20% L-arginine (Sinopharm Chemical Reagent Co., Ltd., Shanghai,
China; 2.5 g/kg body weight), at an interval of 1 h. In the low
concentration L-arginine (LCLa) group, each SD rat received two
intraperitoneal injections of 6% L-arginine (2.5 g/kg body weight),
at an interval of 1 h. At 24 h after the induction of pancreatitis
using L-arginine, all SD rats were sacrificed under ether
anesthesia. The pancreas of each rat was then rapidly removed, and
separated from the surrounding lymph nodes and fat. Each pancreatic
tissue sample was divided into two parts: One part was fixed in 10%
buffered formaldehyde for histological evaluation and the second
part was reserved for protein extraction. The severity of the
pancreatitis was determined based on the histological scoring,
including the degrees of edema, inflammation, vacuolization and
necrosis, and by measurement of serum amylase levels. Furthermore,
8 additional rats received intraperitoneal injections of an equal
quantity of 0.9% NaCl solution, and were designated as the control
group.
Histological evaluation
Pancreatic samples were fixed in 10% buffered
formaldehyde, cut into 5 µm sections, and stained with hematoxylin
and eosin (H&E; Maixin Biotech Co., Ltd., Fuzhou, China) and
assessed blindly by two senior pathologists (Qi Pan and Guochang
Chen). The tissue sections were graded as described previously
(12). A total of 10 high-power
fields (HPF) of each section were selected at random and were
visualized under a CX31 microscope (Olympus America Inc., Center
Valley, PA, USA). Samples were scored on a scale of 0–4, according
to the degree of edema, necrosis, vacuolization and inflammation.
The degree of edema was scored as follows: 0, No edema; 1, diffuse
expansion of interlobar septa; 2, severe diffuse expansion of
interlobar septa; 3, diffuse expansion of interacinar septa; and 4,
diffuse expansion of intercellular septa. The degree of
inflammation was scored as follows: 0, No inflammation; 1,
inflammation around ductal margin; 2, inflammation in parenchyma
(<50% of lobules); 3, inflammation in parenchyma (50–75% of
lobules); and 4, inflammation in parenchyma (>75% of lobules).
The degree of vacuolization was scored as follows: 0, No
vacuolization; 1, peroductal vacuolization (<5%); 2, focal
vacuolization (5–20%); 3, diffused vacuolization (21–50%); and 4,
severe vacuolization (>50%). The degree of necrosis was scored
as follows: 0, No necrosis; 1, 1–4 necrotic cells/HPF; 2, 5–10
necrotic cells/HPF; 3, 11–15 necrotic cells/HPF; and 4, >16
necrotic cells/HPF. The final score was calculated as the sum of
the results of all parameters (including degrees of edema,
necrosis, vascularization and inflammation). The final score was
between 0 and 16.
Serum levels of amylase
During the animal experiments, a 2-ml blood sample
was extracted from each rat following anesthetization. The blood
samples were centrifuged at 1,509 × g for 15 min, and stored at
−80°C until further use. The levels of serum amylase were measured
using a Hitachi 7600-020 automatic biochemical analyzer (Hitachi,
Ltd., Tokyo, Japan) (13).
Serum levels of E-cadherin
A 2-ml blood sample was extracted from each rat
following anesthetization. The levels of E-cadherin were measured
using a commercially available MK117 E-cadherin ELISA kit (Takara
Bio, Inc., Otsu, Japan).
Western blot analysis to determine the
expression of E-cadherin protein
Whole cell lysates were prepared from pancreatic
tissue specimens. Briefly, pancreatic tissue samples were
homogenized using a glass-on-glass tissue homogenizer.
Subsequently, the homogenates were centrifuged (10 min, 4°C, 11,750
× g) and the supernatants were collected. Total protein was
extracted using a Qproteome Mammalian Protein Prep kit (Qiagen
GmbH, Hilden, Germany). The levels of E-cadherin protein in the
pancreatic tissue were measured using Coomassie blue staining
(Maixin Biotech Co., Ltd.). A standard western blot assay was
performed using a primary goat polyclonal antibody against rat
E-cadherin (dilution, 1:1,000; catalog no. ab1416; Abcam,
Cambridge, UK) and an anti-goat IgG antibody, which was a
horseradish peroxidase-linked F (ab')2 fragment obtained
from a rabbit (dilution 1:2,000; catalog no. BA1060; Wuhan Boster
Biological Technology, Ltd., Wuhan, China). The loading of equal
quantities of protein samples was verified using an anti-β-actin
antibody (dilution, 1:1,000; catalog no. sc-47778; Santa Cruz
Biotechnology, Inc., Dallas, TX, USA), with a secondary antibody
(dilution, 1:2,000; cat. no. BA1051; Wuhan Boster Biological
Technology, Ltd.), as a loading control. The proteins under
investigation were detected using the Pierce Enhanced
Chemiluminescence Western Blotting substrate (Thermo Fisher
Scientific, Inc., Waltham, MA, USA). The intensity of the bands was
visualized using an Amersham enhanced chemiluminescence system
(ImageQuant LAS 4000; GE Healthcare Bio-Sciences, Pittsburgh, PA,
USA), according to the manufacturer's instructions.
Statistical analysis
Statistical analysis was performed using SPSS
software, version 18.0 (SPSS Inc., Chicago, IL, USA). The
experimental values were analyzed using the paired-samples
t-test and were expressed as the mean ± standard deviation.
One-way analysis of variance (ANOVA) was calculated to determine
the differences between groups for each parameter at each time
point. Non-parametrical Kruskal-Wallis tests were used when equal
variances were not assumed in one-way ANOVA. P<0.05 was
considered to indicate a statistically significant difference.
Results
Histological analysis
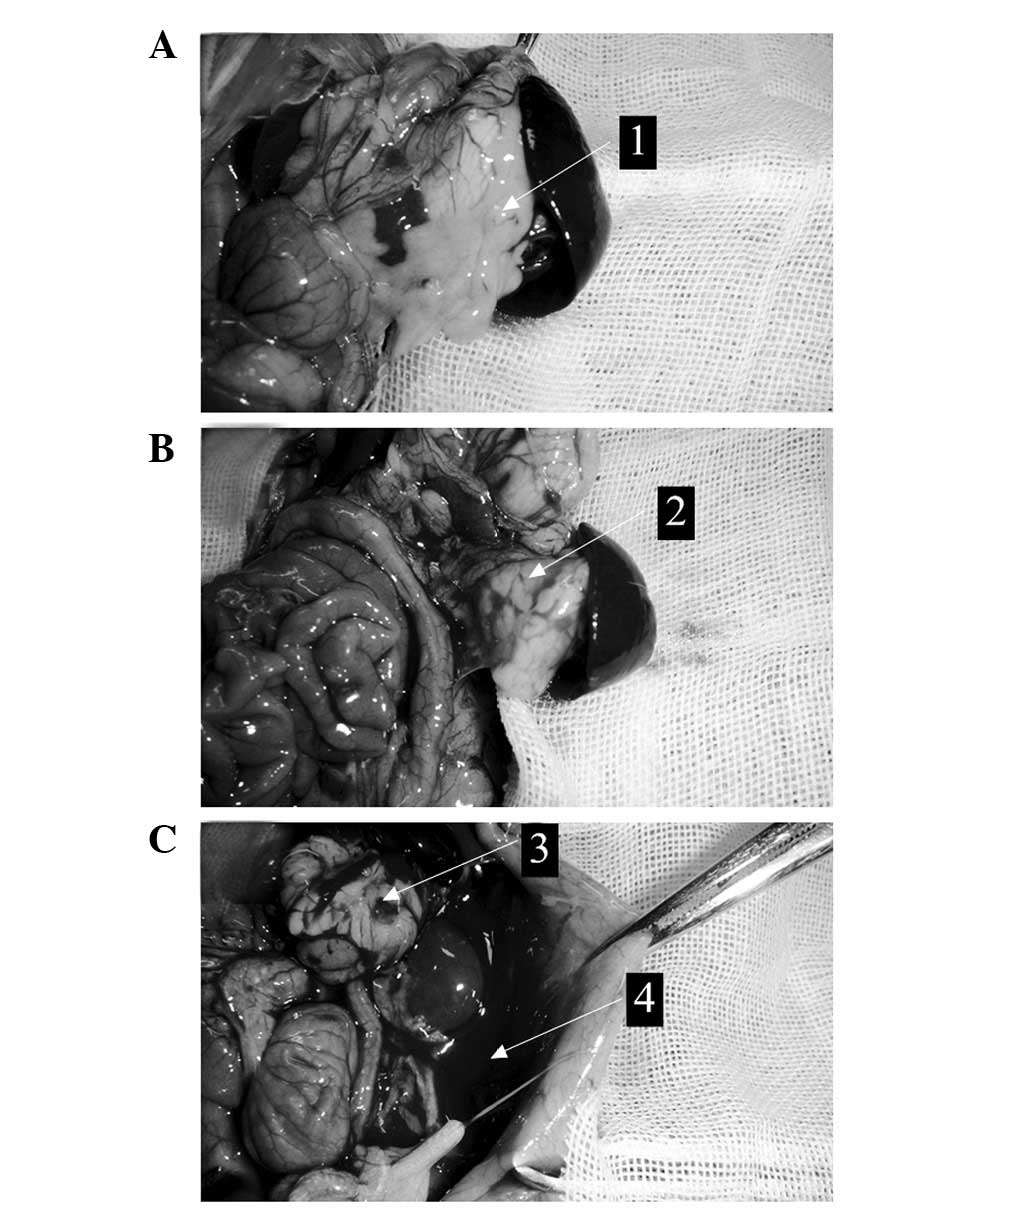
No rats died unexpectedly following the
intraperitoneal injections, and the rats were sacrificed at 24 h
after the injections. In the control group (NaCl-treated), no
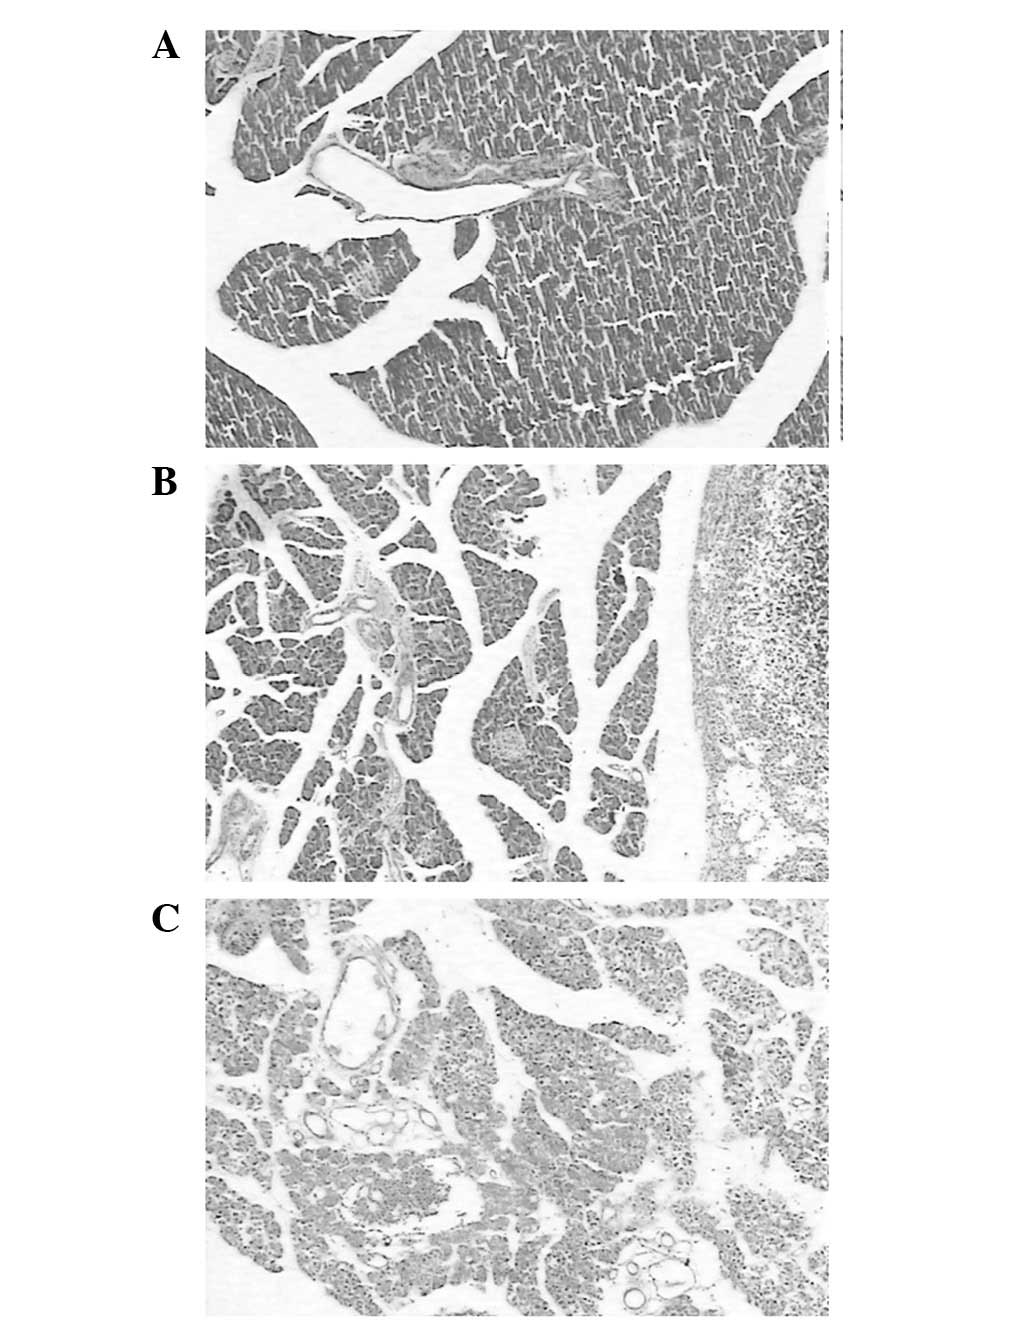
pancreatic edema or peritoneal exudate were detected (Fig. 1A). H&E staining of the control
group pancreatic tissue revealed no significant swelling,
inflammation or necrosis (Fig. 2A).
In the LCLa group, edema of the pancreas and necrosis of the fat
surrounding the pancreas were observed in all rat tissue samples
(Fig. 1B). H&E staining revealed
interlobular edema and inflammatory cell infiltration in the
pancreatic tissue (Fig. 2B). In the
HCLa group, edema, hemorrhage, necrosis of the pancreas and bloody
ascites were observed in all rat tissue samples (Fig. 1C). Furthermore, the destruction of
pancreatic lobules, interstitial edema, vascular congestion and
infiltration of neutrophils and monocytes were observed in the HCLa
group samples (Fig. 2C).
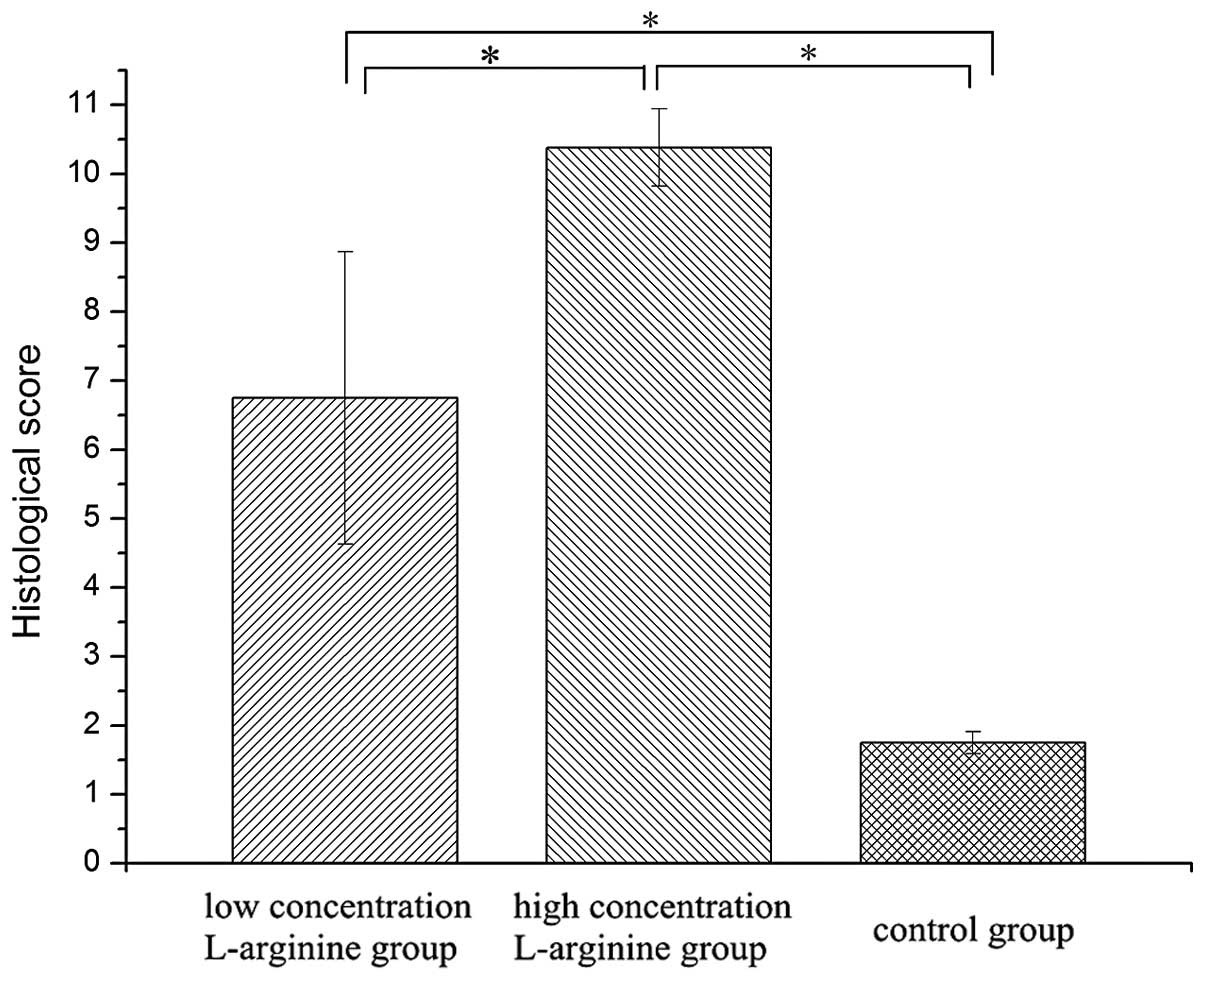
Pathology scores for the HCLa (10.38±0.56) and LCLa
(6.75±2.12) groups were higher compared with the control group
(1.75±0.16). Statistically significant differences were detected in
the HCLa and LCLa groups compared with the control group, and in
the HCLa group compared with the LCLa group (P<0.05). These
results are presented in Table I and
Fig. 3.
 | Table I.Histological scoring for rats with
acute pancreatitis. |
Table I.
Histological scoring for rats with
acute pancreatitis.
| Group | Edema | Inflammation | Vacuolization | Necrosis | Score |
|---|
| Control | 0.65±0.22 | 0.44±0.19 | 0.35±0.06 | 0.31±0.09 | 1.75±0.16 |
| LCLa | 3.52±2.13 | 2.34±1.65 | 0.45±0.07 | 0.44±0.13 |
6.75±2.12a |
| HCLa | 3.08±1.77 | 3.24±1.65 | 1.85±0.92 | 2.21±0.88 |
10.38±0.56a |
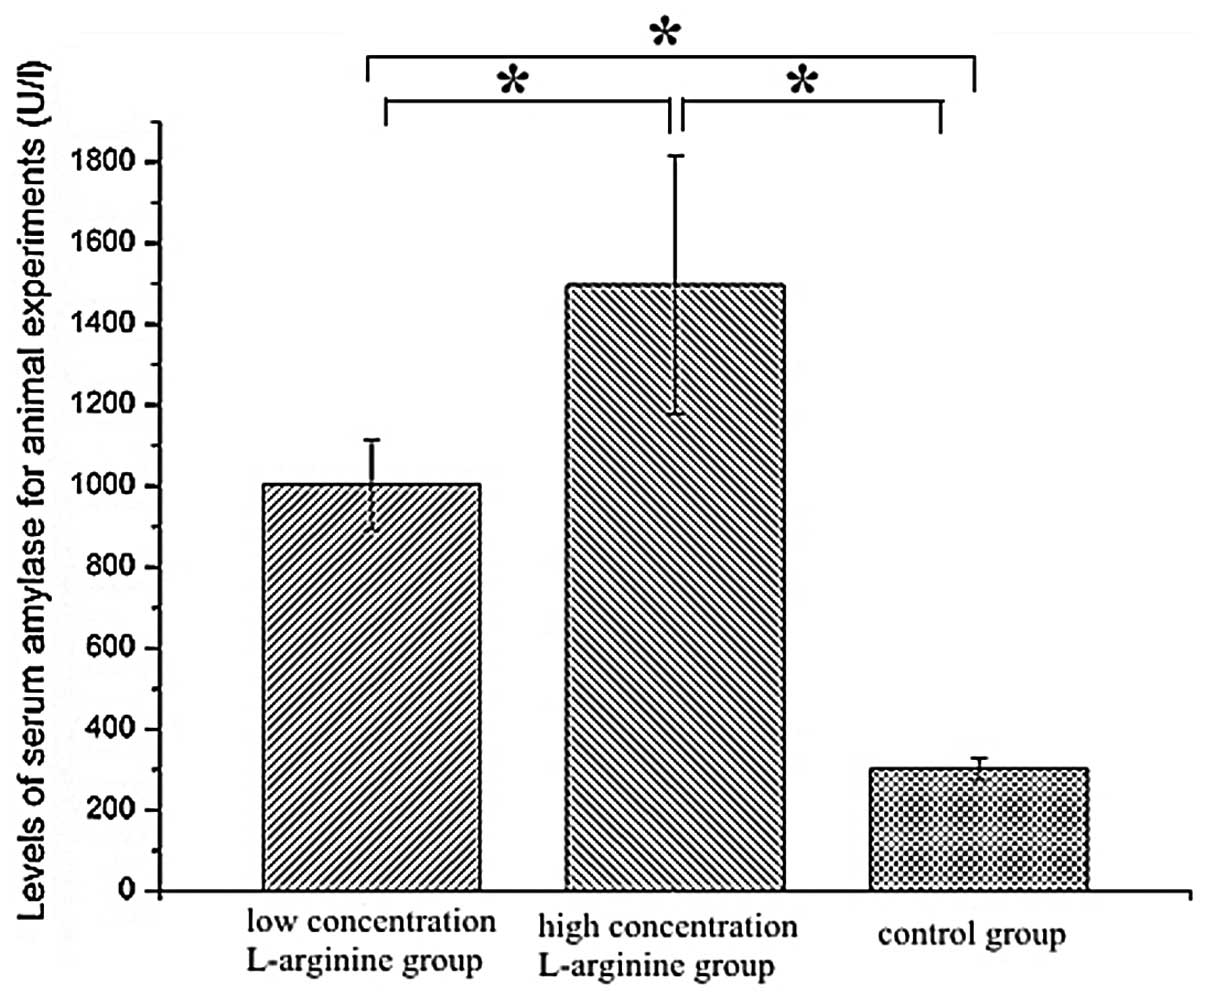
Serum levels of amylase
The levels of serum amylase were higher in the HCLa
(1,497.29±319.57 U/l) and LCLa (1,003.83±111.52 U/l) groups
compared with the control group (301.75±26.89 U/l). Statistically
significant increases in serum amylase were detected in the HCLa
and LCLa groups compared with the control group, and in the HCLa
group compared with the LCLa group (P<0.05). The results are
presented in Fig. 4.
SAP and mild AP (MAP) groups
All the HCLa and LCLa group rats exhibited
inflammation and edema of the pancreas. However, hemorrhage and
bloody ascites were only observed in the HCLa group rats. The most
elevated pancreatitis pathology scores and serum amylase levels
were observed in the HCLa group rats. In addition, the pathology
scores and levels of serum amylase in the HCLa and LCLa group rats
were higher compared with the control group rats. Therefore, the
HCLa rats were assigned as the SAP group, and the LCLa rats were
assigned as the MAP group.
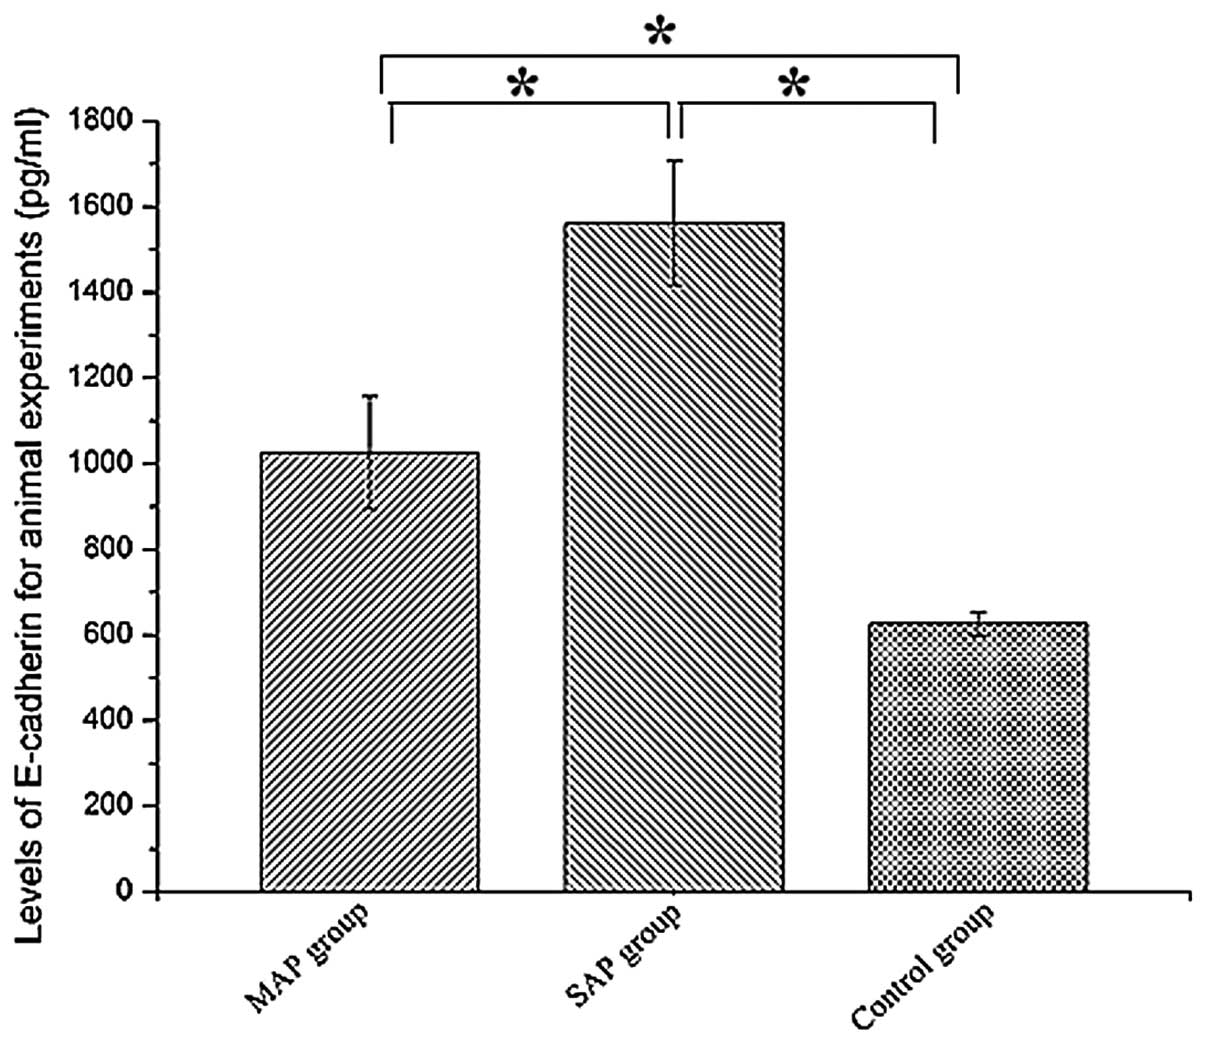
Serum levels of E-cadherin
The levels of E-cadherin were highest in the SAP
group rats. In addition, the levels of E-cadherin were higher in
the SAP (1,561.75±144.82 pg/ml) and MAP (1,025.50±131.33 pg/ml)
groups compared with the control group (626.50±72.12 pg/ml;
P<0.05). Statistically significant elevations in serum
E-cadherin were detected in the MAP and SAP groups compared with
the control group (P<0.05), and in the SAP group compared with
the MAP group (P<0.05). The results are presented in Fig. 5.
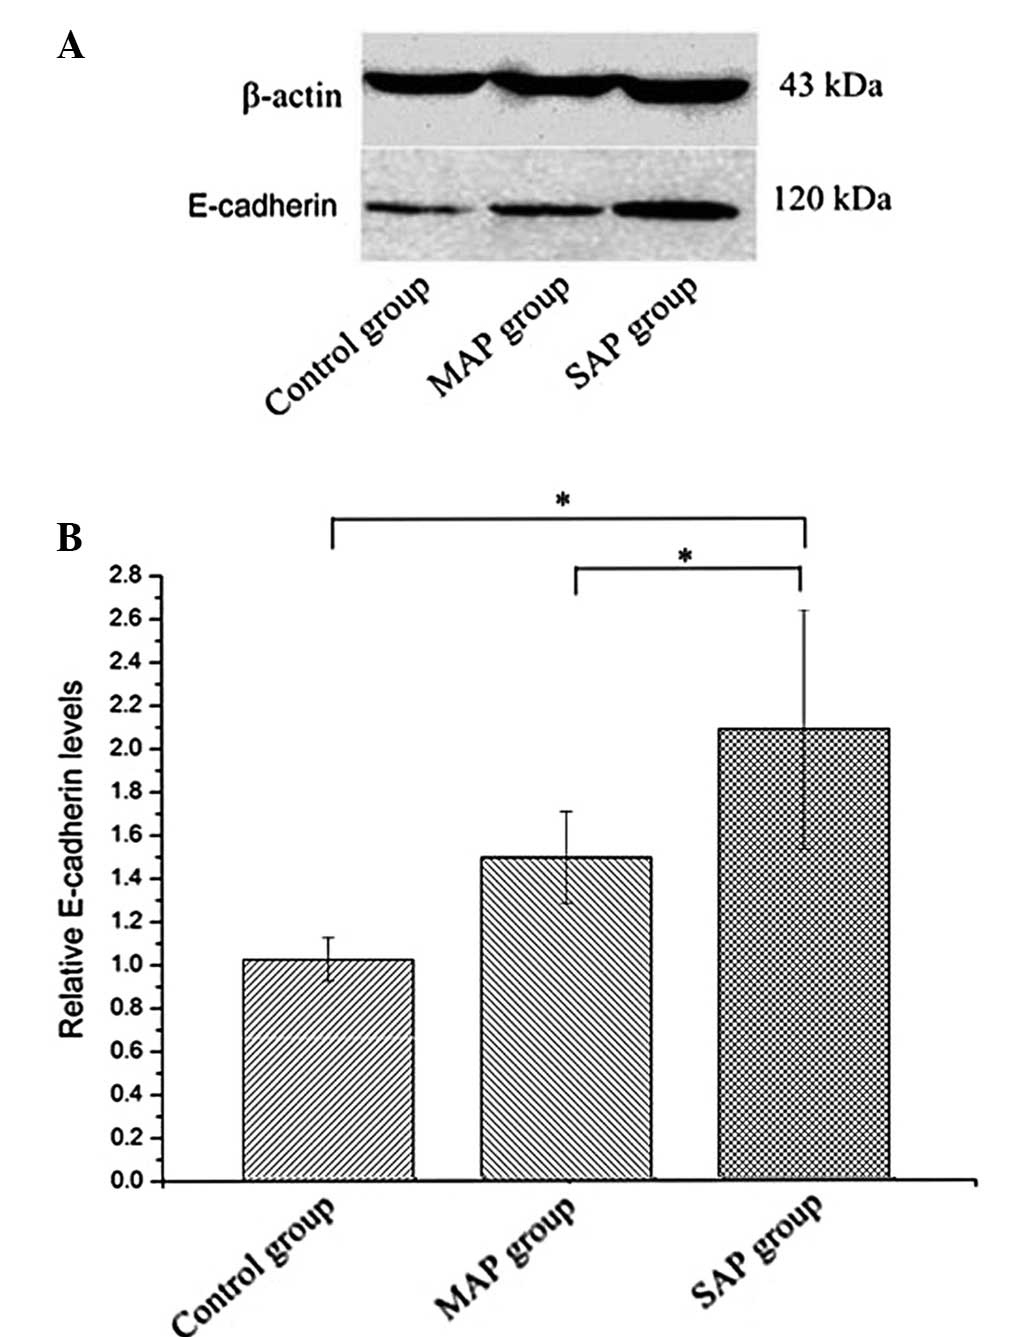
Expression of E-cadherin protein
The expression of E-cadherin protein was evaluated
using western blot analysis. The levels of E-cadherin protein were
higher in the SAP group compared with the MAP and control groups
(Fig. 6). Statistically significant
differences in E-cadherin protein expression were detected between
the SAP and MAP group rats, and between the SAP and control group
rats. No statistically significant differences in E-cadherin
protein expression were detected between the MAP and control group
rats.
Discussion
To date, a number of inflammatory molecules, have
been identified as potential predictive markers of SAP, including
interleukin (IL)-1, IL-6 and IL-10 (14,15).
However, the majority of studies on E-cadherin have focused on the
development and recurrence of cancer (16), and thus, few studies have
investigated the role played by E-cadherin in inflammation. To the
best of our knowledge, the role of E-cadherin in pancreatitis
remains controversial. In 2009, Sewpaul et al observed that
the mean concentration of soluble E-cadherin in patients with SAP
at <12 h was significantly higher compared with that in healthy
volunteers and patients with other gastrointestinal pathologies
(17). However, Pezzilli et
al reported that the serum levels of E-cadherin were not
associated with the severity of AP (18).
In the present study, a rat model of pancreatitis
was successful established using L-arginine. The SAP and MAP groups
were designated according to the results of histological
evaluations and the serum levels of amylase. The levels of serum
E-cadherin and E-cadherin protein were highest in rats in the SAP
group, which were evidently increased compared with the levels
detected in rats in the MAP and control groups. These results
suggest that the expression of E-cadherin is associated with the
severity of AP.
The mechanism underlying E-cadherin overexpression
in rats with SAP remains unclear. It is possible that
E-cadherin-associated apoptosis may serve a crucial function in the
pathogenesis of SAP. Takeyama reported that apoptosis was involved
in the mechanism of infectious complications, in addition to organ
dysfunction, in SAP (19). It is
known that apoptosis is regulated by numerous genes, and E-cadherin
is one among a variety factors that may influence the apoptotic
process (20). During apoptosis,
E-cadherin is efficiently cleaved in epithelial cells, and
fragments with apparent molecular masses of 24, 29 and 84 kDa are
generated following the induction of apoptosis by staurosporine or
camptothecin (21).
Another possible cause of the overexpression of
E-cadherin is that it may contribute to the extravasation of
erythrocytes and leukocytes in the early stages of SAP (8,21). In
the present rat experiments, hemorrhage of the pancreas and bloody
ascites were observed in the SAP group rats. The process of
extravasation into the parenchyma involves a number of molecular
interactions between blood cells and endothelial cells, including
tight adhesions, rolling and diapedesis (22). Vonlaufen et al reported that,
in cerulein-induced AP, the junctional adhesion molecule C is
upregulated (23). In addition,
Mayerle et al demonstrated that a variant that was 15 kDa
smaller than E-cadherin, which was detected in the early stage of
pancreatitis, was the product of E-cadherin cleavage at amino acid
394 in the extracellular domain; this phenomenon was consistent
with E-cadherin cleavage by leukocyte-produced elastase (8). Therefore, previous results suggested
that polymorphonuclear leukocyte-released elastase may be involved
in the dissociation of cell-cell contacts, the extracellular
cleavage of E-cadherin and, ultimately, the transmigration of
leukocytes into the epithelial tissue during the initial phase of
experimental pancreatitis (8).
In conclusion, the role of E-cadherin in
pancreatitis remains unclear. However, the present results indicate
that the expression levels of E-cadherin in SAP rats were higher
compared with those in MAP rats. Therefore, E-cadherin may be
associated with the severity of AP.
Acknowledgements
The present study was supported by grants from the
National Natural Science Foundation of China (nos. 30901422 and
51271117).
References
|
1
|
Talukdar R and Vege SS: Recent
developments in acute pancreatitis. Clin Gastroenterol Hepatol.
7(Suppl 11): 3–9. 2009. View Article : Google Scholar
|
|
2
|
Zeng YB, Zhan XB, Guo XR, et al: Risk
factors for pancreatic infection in patients with severe acute
pancreatitis: An analysis of 163 cases. J Dig Dis. 15:377–385.
2014. View Article : Google Scholar : PubMed/NCBI
|
|
3
|
Granger J and Remick D: Acute
pancreatitis: models, markers and mediators. Shock. 24(Suppl 1):
45–51. 2005. View Article : Google Scholar : PubMed/NCBI
|
|
4
|
Pezzilli R, Billi P, Miglioli M and Gullo
L: Serum amylase and lipase concentrations and lipase/amylase ratio
in assessment of etiology and severity of acute pancreatitis. Dig
Dis Sci. 38:1265–1269. 1993. View Article : Google Scholar : PubMed/NCBI
|
|
5
|
Pooran N, Indaram A, Singh P and Bank S:
Cytokines (IL-6, IL-8, TNF): early and reliable predictors of
severe acute pancreatitis. J Clin Gastroenterol. 37:263–266. 2003.
View Article : Google Scholar : PubMed/NCBI
|
|
6
|
Saito T, Yoshida K, Matsumoto K, et al:
Inflammatory cytokines induce a reduction in E-cadherin expression
and morphological changes in MDCK cells. Res Vet Sci. 96:288–291.
2014. View Article : Google Scholar : PubMed/NCBI
|
|
7
|
Ahmed RA, Shawky Ael-A and Hamed RH:
Prognostic significance of cyclin D1 and E-cadherin expression in
laryngeal squamous cell carcinoma. Pathol Oncol Res. 20:625–633.
2014. View Article : Google Scholar : PubMed/NCBI
|
|
8
|
Mayerle J, Schnekenburger J, Krüger B, et
al: Extracellular cleavage of E-cadherin by leukocyte elastase
during acute experimental pancreatitis in rats. Gastroenterology.
129:1251–1267. 2005. View Article : Google Scholar : PubMed/NCBI
|
|
9
|
Glasbrenner B and Adler G: Pathophysiology
of acute pancreatitis. Hepatogastroenterology. 40:517–521.
1993.PubMed/NCBI
|
|
10
|
Dawra R and Saluja AK: L-arginine-induced
experimental acute pancreatitis. The Pancreapedia: Exocrine
Pancreas Knowledge Base. 2012.
|
|
11
|
Czakó L, Takács T, Varga IS, et al: The
pathogenesis of L-arginine induced acute necrotizing pancreatitis:
inflammatory mediators and endogenous cholecystokinin. J Physiol
Paris. 94:43–50. 2000. View Article : Google Scholar : PubMed/NCBI
|
|
12
|
Rongione AJ, Kusske A, Kwan K, Ashley SW,
Reber HA and McFadden DW: Interleukin 10 reduces the severity of
acute pancreatitis in rats. Gastroenterology. 112:960–967. 1997.
View Article : Google Scholar : PubMed/NCBI
|
|
13
|
Yan S, Ding Y, Sun F, Lu Z, Xue L, Liu X,
Shuai M, Fang C, Wang Y, Cheng H, et al: Pretreatment of cisplatin
in recipients attenuates post-transplantation pancreatitis in
murine model. Int J Biol Sci. 8:298–309. 2012. View Article : Google Scholar : PubMed/NCBI
|
|
14
|
Matull W, Pereira S and O'Donohue J:
Biochemical markers of acute pancreatitis. J Clin Pathol.
59:340–344. 2006. View Article : Google Scholar : PubMed/NCBI
|
|
15
|
Mayer J, Rau B, Gansauge F and Beger HG:
Inflammatory mediators in human acute pancreatitis: clinical and
pathophysiological implications. Gut. 47:546–552. 2000. View Article : Google Scholar : PubMed/NCBI
|
|
16
|
Wijnhoven B, Dinjens W and Pignatelli M:
E-cadherin-catenin cell-cell adhesion complex and human cancer. Br
J Surg. 87:99–1005. 2000. View Article : Google Scholar
|
|
17
|
Sewpaul A, French J, Khoo T, Kernohan M,
Kirby J and Charnley R: Soluble E-cadherin: an early marker of
severity in acute pancreatitis. HPB Surgery. 2009:62009. View Article : Google Scholar
|
|
18
|
Pezzilli R, Corsi MM, Barassi A, et al:
Serum E-cadherin and hepatocyte growth factor in acute
pancreatitis: Exploring time course and severity assessment.
Immunogastroenterology. 2:57–61. 2013. View
Article : Google Scholar
|
|
19
|
Takeyama Y: Significance of apoptotic cell
death in systemic complications with severe acute pancreatitis. J
Gastroenterol. 40:1–10. 2005. View Article : Google Scholar : PubMed/NCBI
|
|
20
|
Steinhusen U, Weiske J, Badock V, Tauber
R, Bommert K and Huber O: Cleavage and shedding of E-cadherin after
induction of apoptosis. J Biol Chem. 276:4972–4980. 2001.
View Article : Google Scholar : PubMed/NCBI
|
|
21
|
Vestweber D: Regulation of endothelial
cell contacts during leukocyte extravasation. Curr Opin Cell Biol.
14:587–593. 2002. View Article : Google Scholar : PubMed/NCBI
|
|
22
|
Imhof BA and Dunon D: Leukocyte migration
and adhesion. Advances in immunology. 58:3451995. View Article : Google Scholar : PubMed/NCBI
|
|
23
|
Vonlaufen A, Aurrand-Lions M, Pastor CM,
et al: The role of junctional adhesion molecule C (JAM-C) in acute
pancreatitis. J Pathol. 209:540–548. 2006. View Article : Google Scholar : PubMed/NCBI
|