Introduction
Chronic obstructive pulmonary disease (COPD) is
ranked as the fourth leading cause of mortality worldwide (1). A diagnosis of COPD is considered in any
patient who has dyspnea, chronic cough or sputum production and a
history of exposure to risk factors, but requires confirmation by
spirometry (1). This technique is,
however, difficult for the patient, not always available, requires
a certain expertise for its interpretation and is poorly correlated
with disease severity (2,3). As an alternative, research has focused
recently on the measurement of a variety of biomarkers that appear
to exhibit prospective utility in the diagnosis and prognosis of
COPD. Serum levels of systemic markers of inflammation such as
C-reactive protein (CRP) and fibrinogen, which are validated in
clinical laboratory assays (4), have
been shown to reflect the degree of severity of airway inflammation
(5–7)
but they are not lung-specific (7–10). In
addition, there is no approved predictive or prognostic biomarker
for COPD reported to date.
Previous studies have described associations between
a pulmonary-specific marker, surfactant protein D (SP-D) and COPD
(11,12). SP-D is a large hydrophilic
glycoprotein that belongs to the collectin family, mainly produced
in the lung by alveolar type II cells and non-ciliated Clara cells
(13). SP-D facilitates the
resolution of lung inflammation (14), is detectable in serum, and has the
advantage of being stable over a period of 6 months (15).
In the present study, it was hypothesized that SP-D
is a more specific biological marker than CRP or fibrinogen for the
differentiation of COPD patients among individuals consulting for
respiratory diseases or symptoms, including those with asthma.
Therefore, the associations of SP-D, CRP and fibrinogen with
patients with COPD or asthma and controls were investigated. The
optimal cut-off point able to discriminate COPD patients from
controls using serum SP-D levels was also sought.
Materials and methods
Study design and subjects
All COPD patients consulting at the outpatient
clinics of the Pulmonary Department of Saint George Hospital
University Medical Center in Beirut, Lebanon between June 2011 and
April 2013 were recruited in this case-control study. COPD
diagnosis was defined as a post bronchodilator ratio of the forced
expiratory volume in 1 sec (FEV1)/forced vital capacity
(FVC) of <70% (1). Ninety COPD
patients were classified into categories based on Global Initiative
for Chronic Obstructive Pulmonary Disease (GOLD) guidelines 2013
(1). There were 35 patients in group
A, 38 in group B, 3 in group C, and 14 in group D. None of the
patients had an exacerbation 1 month prior to inclusion. With
regard to medication, COPD patients were classified as treated when
they were receiving β2-agonists or anti-cholinergic agents (whether
short-acting or long-acting) combined or not with inhaled
corticosteroids (ICS), as suggested previously (16). A total of 46 COPD patients were found
to be on regular medication. Patients with asthma (n=124) were
defined according to Global Initiative for Asthma (GINA) guidelines
2012 (17). A clinical diagnosis
based on symptoms (breathlessness, wheezing, cough and chest
tightness), family history of asthma, worsening symptoms when
exposed to various risk factors was performed and lung function
measurements were assessed (17).
Having another respiratory disease was the exclusion criterion for
COPD or asthma patients. Healthy individuals from the general
population (n=92) and outpatients consulting for a variety of
non-respiratory problems in the same hospital (n=88) were
recruited. Controls had normal lung function test results as
defined by GOLD guidelines (1). The
exclusion criteria were previous or current diagnosis of any
respiratory disease such as asthma, COPD, chronic bronchitis,
fibrosis, tuberculosis or lung cancer. Written informed consent was
provided by all participants.
Questionnaire
A standardized questionnaire, adapted to the local
Arabic language, was filled out by all participants with the
assistance of trained interviewers. The questionnaire included
information on socio-demographic characteristics, exposure to
disease risk factors, clinical assessment of the disease and its
symptoms using the American Thoracic Society Questionnaire
(18) and the Medical Research
Council ‘MRC’ breathlessness scale (19), and smoking history.
Blood collection and pulmonary
function tests
Before conducting pulmonary function tests, venous
blood samples were withdrawn from all participants, immediately
transported at 4°C to the Immunology Laboratory of the Lebanese
University (Fanar, Lebanon) and centrifuged at 4°C within 12 h
after withdrawal. Plasma and serum were then aliquoted and stored
frozen at −20°C until their analysis within 6 months.
All participants underwent baseline spirometry by a
trained physician. Reversibility assessments (post-bronchodilator
spirometry) were performed following the inhalation of two puffs of
Ventolin (albuterol) with 30 min delay from the baseline
spirometry.
Measurement of SP-D, CRP and
fibrinogen
Quantification of SP-D was performed by a
five-layered enzyme-linked immunosorbent assay (ELISA) as
previously described by Leth-Larsen et al (20). Briefly, microtiter plates were coated
with polyclonal F(ab')2 anti-human SP-D antibody
[cat.no., K477; dilution, 1:1500; Grith Sorensen´s laboratory,
Odense, Denmark (20)] in sodium
carbonate buffer (pH 9.6). Following overnight incubation at 4°C,
the plates were washed and left in contact with washing buffer
(Tris-buffered saline, 0.05% Tween 20, 5 mM CaCl2) for 1
h at room temperature. Calibrator, controls and samples were added
at a dilution of 1:10 and incubated overnight at 4°C. This was
followed by successive incubations with biotinylated monoclonal
anti-human SP-D antibody [dilution, 1:2,000; Grith Sorensen´s
laboratory (20)], horseradish
peroxidase-conjugated streptavidin (cat.no., 43–4323; dilution,
1:20,000; Zymed; Thermo Fisher Scientific, Inc., Waltham, MA, USA)
and o-phenylenediamine (Zymed; Thermo Fisher Scientific,
Inc.) in citrate-phosphate buffer pH 5, containing 0.014%
H2O2. Plates were read at 492 nm in a
multichannel spectrophotometer (Bio-Tek ELx800 (BioTek instruments,
Inc., Vermont, USA) after adding H2SO4. Serum
CRP and plasma fibrinogen levels were measured using double
antibody sandwich ELISA kits (Immunology Consultants Laboratory,
Inc., Portland, OR, USA) according to the manufacturer's protocol.
All samples were tested in duplicate. The coefficient of variation
was 4.8% for SP-D, 2.7% for CRP, and 2% for fibrinogen.
Statistical analysis
Fibrinogen was normally distributed, whereas SP-D
and CRP levels were not, even following log transformation. Results
are expressed as the median (interquartile range). Differences
between groups were tested using the t-test or Chi-square test when
appropriate (non-parametric tests gave the same results).
Associations between biomarkers and lung function tests were
estimated using general linear models with adjustment for age,
gender, body mass index (BMI) classes and smoking status. Three
logistic regression models were used to evaluate the association
between SP-D and COPD. In the first and second regressions, COPD
patients vs. controls were used as the dependent variable. The
independent variables were SP-D expressed as above/below the median
value, and all potential confounding variables such as age, gender,
BMI class, and smoking, and all the remaining socio-demographic
characteristics and respiratory symptoms (cough, wheezing and
expectoration) having P<0.2 in the bivariate analysis. As a
sensitivity analysis, the second regression was performed in ever
smokers (smokers and ex-smokers) only. Then, in order to confirm
the ability of SP-D to differentiate patients with COPD from
patients with asthma, a third regression including COPD vs. asthma
patients as the dependent variable was performed. The adjusted odds
ratios (aORs) obtained from the first and second regressions
respectively were then rounded to the nearest unit and used as
coefficients in the calculation of score 1 (for all COPD patients
and controls) and score 2 (for ever-smoker COPD patients and
controls) with the purpose of predicting COPD diagnosis.
Receiver-operating characteristic (ROC) curves were then generated
in order to determine the ability of the scores 1 and 2 to
discriminate between patients with COPD and controls. P<0.05 was
considered to indicate a statistically significant difference. All
analyses were performed using SPSS software, version 17.0 (SPSS,
Inc., Chicago, IL, USA).
According to a previous study on SP-D in COPD
(21), the smallest difference that
could exist between healthy individuals and COPD patients was 56.6
ng/ml, while the standard deviation was 80.2 ng/ml. With an α error
of 5% and a power of 80%, a minimum of 32 patients and 46 controls
was required for the study.
Results
Participants' characteristics
Characteristics of the COPD and asthma patients and
controls are presented in Table I.
The three groups were significantly different regarding age,
gender, smoking, marital status and education. Compared with
controls, patients with COPD were more frequently men, ever smokers
and unmarried (all P≤0.003); while patients with asthma were
younger, more often unmarried, non-smokers and were more likely to
have a university degree (all P≤0.02). Compared with asthma
patients, COPD patients were older, more frequently men, ever
smokers and were less likely to have a university degree (all
P≤0.001). No other significant associations were found.
 | Table I.Characteristics of controls, COPD
patients and asthma patients. |
Table I.
Characteristics of controls, COPD
patients and asthma patients.
| Characteristic | Controls
(n=180) | COPD patients
(n=90) | Asthma patients
(n=124) |
|---|
| Age, years |
55 (51–64) | 62
(50–71) | 46
(32–61) |
| BMI
classesa |
|
|
|
|
Normal | 52
(29.9) | 33 (37.1) | 46 (37.4) |
|
Overweight | 82
(47.1) | 33 (37.1) | 44 (35.8) |
|
Obese | 40
(23.0) | 23 (25.8) | 33 (26.8) |
| Male gender | 65
(36.5) | 52 (57.8) | 39 (32.2) |
| Married | 134 (84.3) | 61 (71.8) | 70 (60.9) |
| University
education | 28
(16.4) | 12 (13.8) | 43 (35.0) |
| In work | 69
(39.9) | 35 (41.7) | 55 (45.8) |
| Ever smoker | 112 (62.2) | 68 (75.6) | 60 (48.4) |
Association of biological markers with
COPD and asthma
The three groups were significantly different
regarding SP-D levels only. Serum SP-D levels were significantly
increased in COPD patients as compared with controls and with
asthma patients. There were no significant differences in SP-D
levels between asthma patients and controls. No other significant
associations were observed (Table
II).
| Table II.Variations of SP-D, CRP and
fibrinogen levels between patients with COPD or asthma and
controls. |
Table II.
Variations of SP-D, CRP and
fibrinogen levels between patients with COPD or asthma and
controls.
|
|
|
|
| P-value |
|---|
|
|
|
|
|
|
|---|
| Analyte | Controls
(n=180) | COPD (n=90) | Asthma (n=124) | COPD vs.
controls | Asthma vs.
controls | COPD vs.
asthma |
|---|
| SP-D (ng/ml) | 1,269
(664–1884) | 1,510
(986–2,174) | 1,130
(676–1,852) |
0.02 | 0.7 |
0.02 |
| CRP (ng/ml) | 9.72
(4.37–15.5) | 8.41
(3.48–14.3) | 8.35
(3.35–15.8) | 0.5 | 0.4 | 0.3 |
| Fibrinogen
(µg/ml) | 3,135
(2,730–3,597) | 2,992
(2,550–3,965) | 3,358
(2,575–4,079) | 0.5 |
0.09 |
0.06 |
SP-D levels were lower in the COPD patients that
were receiving inhaled therapy (ICS and/or bronchodilators)
compared with the COPD patients that were not, but the difference
was not statistically significant [n=46 vs. 42; 1,507±868 vs.
1,830±971 ng/ml, respectively, P=0.1].
No significant associations were identified between
biological markers and FEV1% predicted or FEV1/FVC following the
administration of a bronchodilator to the COPD patients (data not
shown).
Multivariate analyses of the
association between SP-D and COPD
Multivariate analyses performed on all COPD patients
and controls showed that SP-D levels above the median value, male
gender, being unmarried and symptoms such as having a morning
cough, cough during the day and wheezing during the day were
significantly and positively associated with COPD (Table IIIA). The same associations were
observed in ever-smoker COPD patients and controls (Table IIIB).
| Table III.Multivariate analysis of the
association between serum SP-D levels and COPD. |
Table III.
Multivariate analysis of the
association between serum SP-D levels and COPD.
| A, First
regression: COPD patients vs. controls as the dependent variable
(n=221) |
|---|
|
|---|
| Characteristic | aOR | 95% CI | P-value |
|---|
| SP-D above the
median | 3.86 | 1.51; 9.85 |
0.005 |
| Male gender | 2.92 | 1.23; 6.93 |
0.02 |
| Unmarried | 3.07 | 1.19; 7.96 |
0.02 |
| Cough in the
morning | 39.2 | 10.1; 153 |
<0.001 |
| Cough during the
day | 10.9 | 3.25; 36.6 |
<0.001 |
| Wheezing during the
day | 64.9 | 11.8; 356 |
<0.001 |
| Ever smoker | 1.31 | 0.54; 3.18 | 0.5 |
|
| B, Second
regression: COPD patients vs. controls as the dependent variable
for ever smokers (n=141) |
|
| Characteristic | aOR | 95% CI | P-value |
|
| SP-D above the
median | 6.26 | 1.81; 21.65 |
0.004 |
| Male gender | 4.22 | 1.43; 12.5 |
0.009 |
| Unmarried | 3.38 | 1.04; 10.9 | 0.04 |
| Cough in the
morning | 53.8 | 10.7; 272 | <0.001 |
| Cough during the
day | 8.66 | 1.80; 41.8 |
0.007 |
| Wheezing during the
day | 35.8 | 4.82; 267 | <0.001 |
|
| C, Third
regression: COPD patients vs. asthma patients as the dependent
variable (n=201) |
|
| Characteristic | aOR | 95% CI | P-value |
|
| SP-D above the
median | 2.53 | 1.29; 4.96 |
0.007 |
| Male gender | 2.84 | 1.44; 5.62 |
0.003 |
| Age | 1.04 | 1.02; 1.07 | <0.001 |
| Cough in the
morning | 8.70 | 3.29; 23.0 | <0.001 |
In the third regression (Table IIIC) with COPD patients vs. asthma
patients as the dependent variable, SP-D levels above the median
value, older age, male gender and having a morning cough were
significantly and positively associated with COPD.
Construction, properties and
thresholds of scores for COPD diagnosis
Taking into account the aORs from the first
regression (from Table IIIA) and
rounding to the nearest unit, a first score (score 1) for COPD
diagnosis was computed as follows: Score 1 = (SP-D above/below the
median × 4) + (gender × 3) + (marital status × 3) + (cough in the
morning × 39) + (cough during the day × 11) + (wheezing during the
day × 65) + (smoking × 1).
In COPD patients, score 1 had a minimum of 6 and a
maximum of 129. The mean was 47.2, the median was 49 and the
standard deviation was 31.9. In controls, the minimum was 6 and the
maximum was 75, with a mean of 12.6, a median of 10 and a standard
deviation of 10.1.
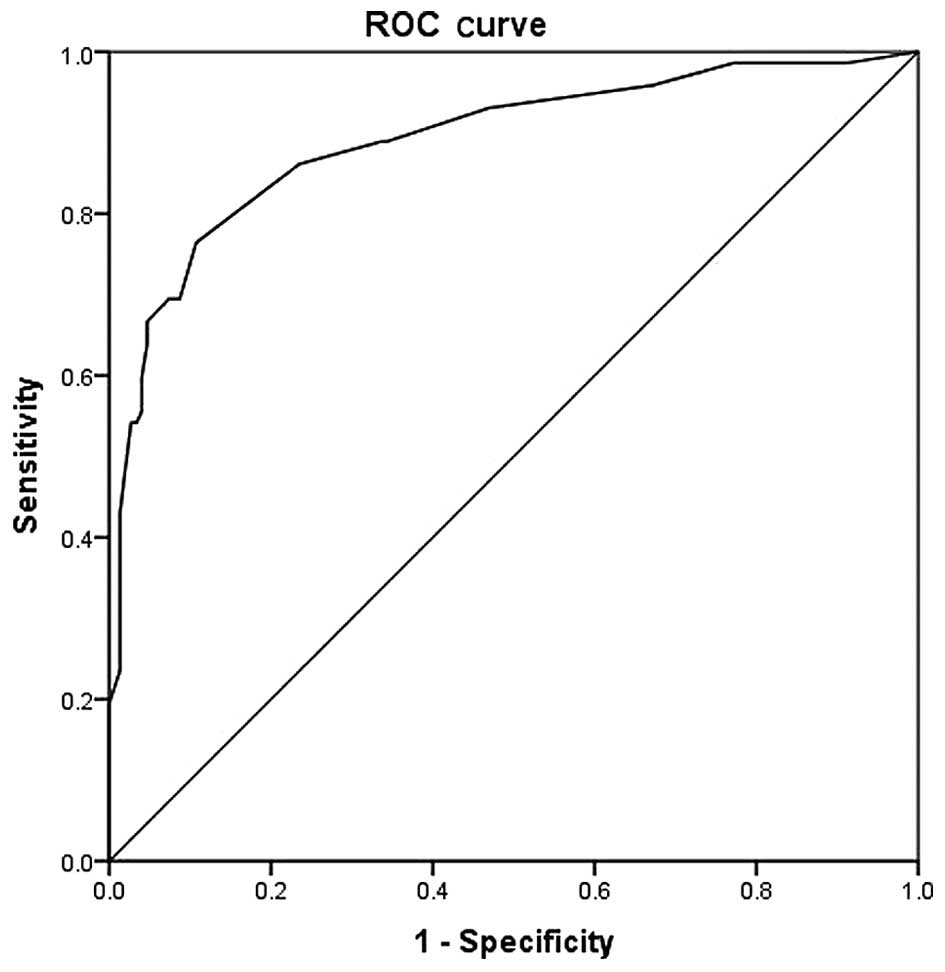
The ROC curve generated for score 1 is shown in
Fig. 1, for the comparison of COPD
patients with controls. The area under the curve was 0.890
(0.841–0.940; P<0.001). The most optimal cut-off point was
calculated to be 15.5 (Table IV) at
which point the sensitivity, specificity, positive predictive value
and negative predictive value were 76.4, 89.3, 81 and 74%,
respectively.
| Table IV.Coordinates of the receiver-operating
characteristic curve for all COPD patients and controls. |
Table IV.
Coordinates of the receiver-operating
characteristic curve for all COPD patients and controls.
| COPD positive if
≥ | Sensitivity | 1-specificity |
|---|
|
5.0000 | 1.000 | 1.000 |
|
6.5000 | 0.986 | 0.913 |
|
8.0000 | 0.986 | 0.772 |
|
9.5000 | 0.958 | 0.671 |
|
10.5000 | 0.931 | 0.470 |
|
11.5000 | 0.889 | 0.342 |
|
12.5000 | 0.889 | 0.336 |
|
13.5000 | 0.861 | 0.235 |
|
15.5000 | 0.764 | 0.107 |
|
17.5000 | 0.694 | 0.087 |
|
19.0000 | 0.694 | 0.074 |
|
20.5000 | 0.681 | 0.060 |
|
22.5000 | 0.667 | 0.047 |
|
24.5000 | 0.639 | 0.047 |
|
26.5000 | 0.597 | 0.040 |
|
36.5000 | 0.569 | 0.040 |
|
45.5000 | 0.556 | 0.040 |
|
47.0000 | 0.542 | 0.034 |
|
48.5000 | 0.542 | 0.027 |
|
49.5000 | 0.486 | 0.020 |
|
51.5000 | 0.431 | 0.013 |
|
56.5000 | 0.403 | 0.013 |
|
62.0000 | 0.306 | 0.013 |
|
67.5000 | 0.278 | 0.013 |
|
71.5000 | 0.264 | 0.013 |
|
73.0000 | 0.250 | 0.013 |
|
74.5000 | 0.236 | 0.013 |
|
75.5000 | 0.194 | 0.000 |
|
77.0000 | 0.181 | 0.000 |
|
78.5000 | 0.153 | 0.000 |
|
80.0000 | 0.125 | 0.000 |
|
81.5000 | 0.111 | 0.000 |
|
83.5000 | 0.097 | 0.000 |
|
85.5000 | 0.083 | 0.000 |
|
87.5000 | 0.069 | 0.000 |
| 101.5000 | 0.056 | 0.000 |
| 119.5000 | 0.042 | 0.000 |
| 127.0000 | 0.028 | 0.000 |
| 130.0000 | 0.000 | 0.000 |
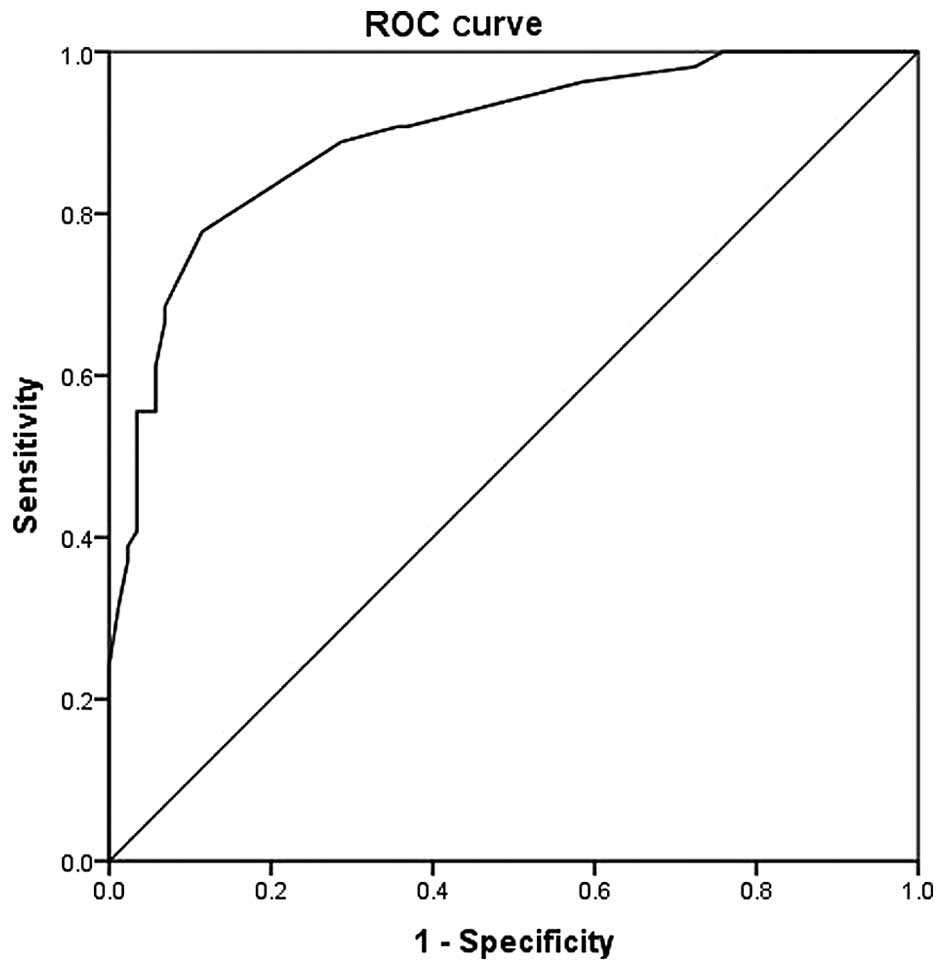
A second score (score 2) was calculated from the
second regression (from Table
IIIB) for ever-smoker COPD patients and controls as follows:
Score 2 = (SP-D above/below the median × 6) + (gender × 4) +
(marital status × 3) + (cough in the morning × 54) + (cough during
the day × 9) + (wheezing during the day × 36).
In ever-smoker COPD patients, score 2 had a minimum
of 10 and a maximum of 116. The mean was 47.7, the median was 51
and the standard deviation of 28.5. In ever-smoker controls, the
minimum was 7 and the maximum was 67, with a mean of 15, a median
of 13 and a standard deviation of 11.4.
A ROC curve was generated from score 2 (Fig. 2). The area under the curve was at
0.895 (0.841–0.950; P<0.001). The most optimal cut-off point was
18.5 at which point the sensitivity, specificity, positive
predictive value and negative predictive value were 77.8, 88.5, 70
and 82% respectively (Table V).
| Table V.Coordinates of the receiver-operating
characteristic curve for ever-smoker COPD patients and
controls. |
Table V.
Coordinates of the receiver-operating
characteristic curve for ever-smoker COPD patients and
controls.
| COPD positive if
≥ | Sensitivity | 1-specificity |
|---|
|
6.0000 | 1.000 | 1.000 |
|
8.5000 | 1.000 | 0.759 |
|
10.5000 | 0.981 | 0.724 |
|
12.0000 | 0.963 | 0.586 |
|
13.5000 | 0.907 | 0.368 |
|
15.0000 | 0.907 | 0.356 |
|
16.5000 | 0.889 | 0.287 |
|
18.5000 | 0.778 | 0.115 |
|
21.5000 | 0.685 | 0.069 |
|
24.5000 | 0.667 | 0.069 |
|
27.5000 | 0.611 | 0.057 |
|
36.0000 | 0.574 | 0.057 |
|
44.5000 | 0.556 | 0.057 |
|
46.5000 | 0.556 | 0.034 |
|
48.0000 | 0.537 | 0.034 |
|
49.5000 | 0.519 | 0.034 |
|
51.0000 | 0.500 | 0.034 |
|
52.5000 | 0.481 | 0.034 |
|
54.5000 | 0.463 | 0.034 |
|
57.5000 | 0.426 | 0.034 |
|
60.0000 | 0.407 | 0.034 |
|
62.5000 | 0.389 | 0.023 |
|
64.5000 | 0.370 | 0.023 |
|
66.0000 | 0.315 | 0.011 |
|
69.0000 | 0.241 | 0.000 |
|
72.5000 | 0.204 | 0.000 |
|
77.0000 | 0.093 | 0.000 |
|
95.0000 | 0.056 | 0.000 |
| 113.0000 | 0.037 | 0.000 |
| 117.0000 | 0.000 | 0.000 |
Discussion
In this study, the associations between serum SP-D
and COPD among subjects consulting for respiratory diseases or
symptoms, and in comparison with serum CRP and plasma fibrinogen
levels were investigated. SP-D levels were found to be
significantly and positively associated with COPD whereas serum CRP
and plasma fibrinogen levels were not. Furthermore, a score for
COPD diagnosis with excellent discriminant values was identified,
with the best scale for the diagnosis of COPD being obtained using
SP-D levels, socio-demographic characteristics, smoking status and
respiratory symptoms significantly associated with COPD.
The particular selection of patients and controls
allowed us to support our hypothesis that SP-D is able to
differentiate COPD patients among individuals consulting for
respiratory diseases or symptoms, including those with asthma. COPD
and asthma patients, healthy controls and outpatients consulting
for non-respiratory diseases were recruited. Regarding the study
limitations, the effect of ICS on SP-D levels was assessed by
regrouping patients receiving β2-agonists (or anticholinergics)
combined or not with ICS due to sample size and to the percentage
of COPD patients in the severe and very severe stages of the
disease, thus requiring treatment with corticosteroids. SP-D levels
were lower in the group of COPD patients that were receiving
treatment compared with those that were not receiving treatment,
but the association did not reach the level of significance reached
by previous studies (12,22,23). The
present study may have a selection bias (75.8% of COPD patients
were ever smokers vs. 62.2% of controls) but this did not affect
the analytical results. Recall bias might be possible because
information on previous smoking history was based on self-reports.
The information bias introduced by underreporting is probable, as
smoking behaviors are sensitive issues, particularly among patients
that do not want to stop smoking. However, as the patients knew
that the study outcome may be beneficial in their medical follow
up, it was assumed that the information bias was minimized.
The present study found that SP-D levels were
significantly and positively associated with COPD as compared with
controls, a result in line with previous studies (11,12,24). To
the best of our knowledge, the present study is the first to
confirm such a result through multivariate analyses. The
association between SP-D and COPD has previously been investigated
by bivariate analyses (11,24–26). Ou
et al did not find an association between SP-D and COPD in
bivariate and multivariate analyses (27) and Ilumets et al adjusted for a
single confounding factor, which is age (21). Others have performed multivariate
analyses concerning associations of SP-D, but considering COPD
exacerbation rather than diagnosis (12,22,27).
Since smoking is known to highly affect SP-D levels, the present
study considered ever smokers only, and it was found that SP-D
remained significantly and positively associated with COPD, a
result concordant with previous literature (11,12,28). No
association of CRP or fibrinogen with COPD was found in the present
study. Ju et al previously reported no association between
CRP and stable COPD (24), while
other studies have reported higher CRP or fibrinogen levels in
stable COPD patients compared with controls (29–31).
However, the use of CRP and fibrinogen as biomarkers for COPD is
limited by their low specificity and low predictive value for COPD
(16) and any inflammatory or
infectious condition, even if not related to lung inflammation, can
modify CRP levels (32). In the
present study, SP-D levels were also significantly elevated in COPD
patients as compared with asthma patients, a result in agreement
with a previous study by Mutti et al (26). The present study observed no
significant differences in SP-D levels between asthma patients and
controls. To the best of our knowledge, there is no clear evidence
regarding the association between SP-D and asthma. One study has
reported no association of SP-D levels with asthma (26), while some small clinical/case studies
have indicated that raised serum SP-D levels are associated with
allergy (29,33). Finally, SP-D appears to be a clinical
biomarker for COPD, able to differentiate COPD patients among
individuals consulting for respiratory diseases or symptoms
including those with asthma, while serum CRP and plasma fibrinogen
levels are not able to do.
The present study did not find an association
between SP-D and FEV1% predicted or FEV1/FVC in COPD patients.
Previous studies have not reported clear evidence of an association
between biomarker levels and lung function parameters. Some studies
have reported similar results, whether in bivariate analyses
(12,34,35) or
in multivariate analysis (36).
However, others have described significant negative correlations
between SP-D levels and lung functions in bivariate analyses with a
borderline P-value for the association between SP-D and FEV1%
predicted (37) or a weak but
significant association with FEV1/FVC in only 20 COPD smokers
(11). Others have found an
association with FEV1 through multivariate analyses in only 23
patients with advanced COPD (38),
in severe COPD patients (24) or in
smokers only (39). Regarding CRP
and fibrinogen, the results of the present study are concordant
with previous studies that found no association with FEV1% in COPD
patients (38,40). By contrast, others have found an
inverse correlation between CRP or fibrinogen and lung function
test results (7,36). Differences between the studies may be
explained in part by differences in the sample size, inclusion or
exclusion of non-smoker COPD patients and the severity of the
disease. In the present study, 81% of the COPD patients were
classified in groups A and B and 19% in groups C and D, and smoker,
ex-smoker and non-smoker COPD patients were included.
To the best of our knowledge, the present study is
the first to suggest a score for COPD diagnosis with excellent
discriminant values and validity results (area under the curve,
sensitivity, specificity, positive predictive value and negative
predictive value). There are validated diagnosis scales that could
be used in primary care settings without blood measurements such as
DS-COPD (diagnosis score for COPD patients) (41). A previous study has created ROC
curves based on 44 stable COPD patients to evaluate the diagnostic
accuracy of SP-D, and found a total area under the curve of 0.734
(21). In that study, in order to
obtain more accurate results, ROC curves were generated for two
scores calculated from the variables identified to be associated
with COPD in the logistic regression models for all COPD patients
and controls and for ever-smoker COPD patients and controls,
respectively. In addition to SP-D, the formula for calculating the
score included socio-demographic characteristics and respiratory
symptoms associated with COPD. The areas under the curves were
0.890 and 0.894 for all subjects and ever smokers, respectively,
which may be considered as an improvement compared with the results
reported in previous literature (21).
In conclusion, SP-D appears to be able to
differentiate COPD patients from patients consulting for other
respiratory symptoms or diseases. Used along with socio-demographic
characteristics and respiratory symptoms associated with COPD, SP-D
is able to discriminate COPD patients from controls, particularly
among smokers.
Acknowledgements
The study was funded by the National Council for
Scientific Research (CNRS)-Lebanon, the Doctoral School for
Sciences and Technology (EDST)-Lebanon, Novartis-Lebanon and
GlaxoSmithKline (GSK)-Lebanon. The European Respiratory Society
(ERS) provided a short-term fellowship to the University of
Southern Denmark to initiate the study. The authors are grateful to
Dr Hasnaa Bou Haroun-Tayoun (Laboratory of Immunology, Faculty of
Public Health, Lebanese University) for valuable discussions.
The authors also thank the funding institutions in
Lebanon, namely the CNRS, EDST, Novartis and GSK, as well as the
European Respiratory Society (ERS) for their unrestricted
educational grants.
References
|
1
|
Global Initiative for Chronic Obstructive
Lung Disease (GOLD): Global Strategy for the Diagnosis. Management
and Prevention of COPD. 2013.http://www.goldcopd.org/Accessed. October
17–2013PubMed/NCBI
|
|
2
|
Vestbo J, Anderson W, Coxson HO, Crim C,
Dawber F, Edwards L, Hagan G, Knobil K, Lomase DA, MacNee W, et al:
Evaluation of COPD longitudinally to identify predictive surrogate
end-points (ECLIPSE). Eur Respir J. 31:869–873. 2008. View Article : Google Scholar : PubMed/NCBI
|
|
3
|
Celli BR and MacNee W: ATS/ERS Task Force:
Standards for the diagnosis and treatment of patients with COPD: A
summary of the ATS/ERS position paper. Eur Respir J. 23:932–946.
2004. View Article : Google Scholar : PubMed/NCBI
|
|
4
|
Faner R, Tal-Singer R, Riley JH, Celli B,
Vestbo J, Macnee W, Bakke P, Calverley PM, Coxson H, Crim C, et al:
Lessons from ECLIPSE: A review of COPD biomarkers. Thorax.
69:666–672. 2014. View Article : Google Scholar : PubMed/NCBI
|
|
5
|
Engström G, Segelstorm N, Ekberg-Aronsson
M, Nilsson PM, Lindgärde F and Löfdahl CG: Plasma markers of
inflammation and incidence of hospitalisations for COPD. Results
from a population-based cohort study. Thorax. 64:211–215. 2009.
View Article : Google Scholar : PubMed/NCBI
|
|
6
|
Rhim T, Choi YS, Nam BY, Uh ST, Park JS,
Kim YH, Paik YK and Park CS: Plasma protein profiles in early
asthmatic responses to inhalation allergen challenge. Allergy.
64:47–54. 2009. View Article : Google Scholar : PubMed/NCBI
|
|
7
|
Dahl M, Tyboerg-Hansen A, Vestbo J, Lang P
and Nordestgaad BG: Elevated plasma fibrinogen associated with
reduced pulmonary function and increased risk of chronic
obstructive pulmonary disease. Am J Respir Crit Care Med.
164:1008–1011. 2001. View Article : Google Scholar : PubMed/NCBI
|
|
8
|
Thomsen M, Ingebrigtsen TS, Marott JL,
Dahl M, Lange P, Vestbo J and Nordestgaard BG: Inflammatory
biomarkers and exacerbations in chronic obstructive pulmonary
disease. JAMA. 309:2353–2361. 2013. View Article : Google Scholar : PubMed/NCBI
|
|
9
|
Man SF, Connett JE, Anthonisen NR, Wise
RA, Tashkin DP and Sin DD: C-reactive protein and mortality in mild
to moderate chronic obstructive pulmonary disease. Thorax.
61:849–853. 2006. View Article : Google Scholar : PubMed/NCBI
|
|
10
|
Duvoix A, Dickens J, Haq I, Mannino D,
Miller B, Tal-Singer R and Lomas DA: Blood fibrinogen as a
biomarker of chronic obstructive pulmonary disease. Thorax.
68:670–676. 2013. View Article : Google Scholar : PubMed/NCBI
|
|
11
|
Winkler C, Atochina-Vasserman EN, Holz O,
Beers MF, Erpenbeck VJ, Krug N, Roepcke S, Lauer G, Elmlinger M and
Hohlfeld JM: Comprehensive characterisation of pulmonary and serum
surfactant protein D in COPD. Respir Res. 12:292011. View Article : Google Scholar : PubMed/NCBI
|
|
12
|
Lomas DA, Silverman EK, Edwards LD,
Locantore NW, Miller BE, Horstman DH and Tal-Singer R: Evaluation
of COPD Longitudinally to Identify Predictive Surrogate Endpoints
study investigators: Serum surfactant protein D is steroid
sensitive and associated with exacerbations of COPD. Eur Respir J.
34:95–102. 2009. View Article : Google Scholar : PubMed/NCBI
|
|
13
|
Madsen J, Kliem A, Tornoe I, Skjodt K,
Koch C and Holmskov U: Localization of lung surfactant protein D on
mucosal surfaces in human tissues. J Immunol. 164:5866–5870. 2000.
View Article : Google Scholar : PubMed/NCBI
|
|
14
|
Crouch EC: Surfactant protein-D and
pulmonary host defense. Respir Res. 1:93–108. 2000. View Article : Google Scholar : PubMed/NCBI
|
|
15
|
Hoegh SV, Sorensen GL, Tornoe I,
Lottenburger T, Ytting H, Nielsen HJ, Junker P and Holmskov U:
Long-term stability and circadian variation in circulating levels
of surfactant protein D. Immunobiology. 215:314–320. 2010.
View Article : Google Scholar : PubMed/NCBI
|
|
16
|
Antoniu SA: Effects of inhaled therapy on
biomarkers of systemic inflammation in stable chronic obstructive
pulmonary disease. Biomarkers. 15:97–103. 2010. View Article : Google Scholar : PubMed/NCBI
|
|
17
|
Global Initiative for asthma (GINA):
Global Strategy for Asthma Management and Prevention.
2012.http://www.ginasthma.org/Accessed. November
18–2013
|
|
18
|
Ferris BG: Epidemiology Standardization
Project (American Thoracic Society). Am Rev Respir Dis. 118:1–120.
1978.PubMed/NCBI
|
|
19
|
Stenton C: The MRC breathlessness scale.
Occup Med (Lond). 58:226–227. 2008. View Article : Google Scholar : PubMed/NCBI
|
|
20
|
Leth-Larsen R, Nordenbaek C, Tornoe I,
Moeller V, Schlosser A, Koch C, Teisner B, Junker P and Holmskov U:
Surfactant protein D (SP-D) serum levels in patients with
community-acquired pneumonia. Clinical Immunol. 108:29–37. 2003.
View Article : Google Scholar
|
|
21
|
Ilumets H, Mazur W, Toljamo T, Louhelainen
N, Nieminen P, Kobayashi H, Ishikawa N and Kinnula VL: Ageing and
smoking contribute to plasma surfactant proteins and protease
imbalance with correlations to airway obstruction. BMC Pulm Med.
11:192011. View Article : Google Scholar : PubMed/NCBI
|
|
22
|
Foreman MG, Kong X, DeMeo DL, Pillai SG,
Hersh CP, Bakke P, Gulsvik A, Lomas DA, Litonjua AA, Shapiro SD, et
al: Polymorphisms in surfactant protein-D are associated with
chronic obstructive pulmonary disease. Am J Respir Cell Mol Biol.
44:316–322. 2011. View Article : Google Scholar : PubMed/NCBI
|
|
23
|
Sin DD, Man SF, Marciniuk DD, Ford G,
FitzGerald M, Wong E, York E, Mainra RR, Ramesh W, Melenka LS, et
al: The effects of fluticasone with or without salmeterol on
systemic biomarkers of inflammation in chronic obstructive
pulmonary disease. Am J Respir Crit Care Med. 177:1207–1214. 2008.
View Article : Google Scholar : PubMed/NCBI
|
|
24
|
Ju CR, Liu W and Chen RC: Serum surfactant
protein D. Biomarker of chronic obstructive pulmonary disease. Dis
Markers. 32:281–287. 2012. View Article : Google Scholar : PubMed/NCBI
|
|
25
|
Shakoori TA, Sin DD, Ghafoor F, Bashir S
and Bokhari SN: Serum surfactant protein D during acute
exacerbations of chronic obstructive pulmonary disease. Dis
Markers. 27:287–294. 2009. View Article : Google Scholar : PubMed/NCBI
|
|
26
|
Mutti A, Corradi M, Goldoni M, Vettori MV,
Bernard A and Apostoli P: Exhaled metallic elements and serum
pneumoproteins in asymptomatic smokers and patients with COPD or
asthma. Chest. 129:1288–1297. 2006. View Article : Google Scholar : PubMed/NCBI
|
|
27
|
Ou CY, Chen CZ, Hsiue TR, Lin SH and Wang
JY: Genetic variants of pulmonary SP-D predict disease outcome of
COPD in a Chinese population. Respirology. 20:296–303. 2015.
View Article : Google Scholar : PubMed/NCBI
|
|
28
|
Sorensen GL, Husby S and Holmskov U:
Surfactant protein A and surfactant protein D variation in
pulmonary disease. Immunobiology. 212:381–416. 2007. View Article : Google Scholar : PubMed/NCBI
|
|
29
|
Inase N, Ohtani Y, Sumi Y, Umino T, Usui
Y, Miyake S and Yoshizawa Y: A clinical study of hypersensitivity
pneumonitis presumably caused by feather duvets. Ann Allergy Asthma
Immunol. 96:98–104. 2006. View Article : Google Scholar : PubMed/NCBI
|
|
30
|
de Torres JP, Cordoba-Lanus E,
López-Aguilar C, de Muros Fuentes M, de Montejo Garcini A,
Aguirre-Jaime A, Celli BR and Casanova C: C-reactive protein levels
and clinically important predictive outcomes in stable COPD
patients. Eur Respir J. 27:902–907. 2006.PubMed/NCBI
|
|
31
|
Eickhoff P, Valipour A, Kiss D, Schreder
M, Cekici L, Geyer K, Kohansal R and Burghuber OC: Determinants of
systemic vascular function in patients with stable chronic
obstructive pulmonary disease. Am J Respir Crit Care Med.
178:1211–1218. 2008. View Article : Google Scholar : PubMed/NCBI
|
|
32
|
Kushner I, Rzewnicki D and Samols D: What
does minor elevation of C-reactive protein signify? Am J Med.
119:166.e17–e28. 2006. View Article : Google Scholar
|
|
33
|
Tsushima K, Fujimoto K, Yoshikawa S,
Kawakami S, Koizumi T and Kubo K: Hypersensitivity pneumonitis due
to Bunashimeji mushrooms in the mushroom industry. Int Arch Allergy
Immunol. 137:241–248. 2005. View Article : Google Scholar : PubMed/NCBI
|
|
34
|
Um SJ, Lam S, Coxson H, Man SF and Sin DD:
Budesonide/formoterol enhances the expression of pro Surfactant
Protein-B in lungs of COPD patients. PloS One. 8:e838812013.
View Article : Google Scholar : PubMed/NCBI
|
|
35
|
Liu W, Ju CR, Chen RC and Liu ZG: Role of
serum and induced sputum surfactant protein D in predicting the
response to treatment in chronic obstructive pulmonary disease. Exp
Ther Med. 8:1313–1317. 2014.PubMed/NCBI
|
|
36
|
Engström G, Lindberg C, de Gerhardsson
Verdier M, Nihlén U, Anderson M, Svartengren M and Forsman-Semb K:
Blood biomarkers and measures of pulmonary function - a study from
the Swedish twin registry. Respir Med. 106:1250–1257. 2012.
View Article : Google Scholar : PubMed/NCBI
|
|
37
|
Ozyurek BA, Ulasli SS, Bozbas SS,
Bayraktar N and Akcay S: Value of serum and induced sputum
surfactant protein-D in chronic obstructive pulmonary disease.
Multidiscip Respir Med. 8:362013. View Article : Google Scholar : PubMed/NCBI
|
|
38
|
Sin DD, Leung R, Gan WQ and Man SP:
Circulating surfactant protein D as a potential lung-specific
biomarker of health outcomes in COPD. A pilot study. BMC Pulm Med.
7:132007. View Article : Google Scholar : PubMed/NCBI
|
|
39
|
Johansson SL, Tan Q, Holst R, Christiansen
L, Hansen NC, Hojland AT, Wulf-Johansson H, Schlosser A, Titlestad
IL, Vestbo J, et al: Surfactant protein D is a candidate biomarker
for subclinical tobacco smoke-induced lung damage. Am J Physiol
Lung Cell Mol Physiol. 306:L887–L895. 2014. View Article : Google Scholar : PubMed/NCBI
|
|
40
|
Dickens JA, Miller BE, Edwards LD,
Silverman EK, Lomas DA and Tal-Singer R: Evaluation of COPD
Longitudinally to Identify Surrogate Endpoints (ECLIPSE) study
investigators: COPD association and repeatability of blood
biomarkers in the ECLIPSE cohort. Respir Res. 12:1462011.
View Article : Google Scholar : PubMed/NCBI
|
|
41
|
Salameh P, Khayat G and Waked M: Could
symptoms and risk factors diagnose COPD? Development of a Diagnosis
Score for COPD. Clin Epidemiol. 4:247–255. 2012. View Article : Google Scholar : PubMed/NCBI
|