Introduction
Insulin is increasingly used in the treatment of
type 2 diabetes (T2D), with its usage reaching 30–50% in Western
countries (1). Nevertheless, many
patients receiving insulin therapy develop vascular diseases, such
as coronary heart disease and stroke (2). Therefore, the role of insulin in the
development of atherosclerosis (AS) is controversial. Previous
findings have shown that increased physiological doses of insulin
promote vascular endothelial injury, as well as vascular smooth
muscle cell proliferation and migration, thereby contributing to
the process of AS (3–5). By contrast, it has been reported that
insulin delays the process of AS by upregulating nitric oxide
synthetase which enhances vasorelaxant function of vascular
endothelial cells (6). However,
previous studies have not focused on the association between
insulin dosage (ID) and usage time, and the coronary artery lesions
in patients of T2D and coronary heart disease.
The aim of this study was to examine the association
between insulin usage (both dose and time) and coronary artery
lesions in these patients. Thhe results showed that high doses of
insulin or a high IT/DT ratio may aggravate coronary artery
damage.
Materials and methods
Patients
A total of 353 patients with T2D were recruited in
the Department of Cardiology, Daping Hospital, The Third Military
School (Chonqing, China). All the patients signed an informed
consent prior to participating in the present study. The study
protocol was approved by the Human Ethics Committee of Daping
Hospital.
The inclusion criteria for the present study
included, 35–85 years of age and a previous history of T2D, or
patients meeting the diagnostic criteria of the ‘2013 Guidelines
for the Prevention and Treatment of Diabetes in China’ (7), as well as having undergone coronary
arteriography, and ongoing insulin therapy. Exclusion criteria for
the study were liver or, kidney disease, anemia [defined as
hemoglobin (Hb) of <60 g/l], tumor or severe malnutrition.
Patients were also excluded if they were using glucagon-like
peptide-1 receptor agonists, rosiglitazone, dipeptidyl peptidase-4
inhibitors, or α-glucosidase inhibitors within 3 months of
screening.
The patients were divided into the high-dose (≥0.5
IU/kg) and low-dose (<0.5 IU/kg) groups based on insulin usage
dosage (8).
Patient information
Patient information such as age, gender, smoking,
measured height, weight, systolic blood pressure (SBP), diastolic
blood pressure (DBP), ID, insulin usage time (IT), diabetes
duration time (DT), caculated body mass index (BMI) and the IT/DT
ratio were collected.
Biochemical analysis
After 12 h of fasting, 3 ml of fasting venous blood
was collected in the morning of the second day after
hospitalization. Low-density lipoproteincholesterol (LDL-C),
high-density lipoprotein cholesterol (HDL-C), total cholesterol
(TC), triglycerides (TG), fasting blood glucose (Glu), HbA1c, and
C-peptide were quantified using automatic biochemical analyzers
(Model Beckman DxC800; Beckman Coulter, CA, USA) and the Cobas 8000
(Model Roche Diagnostics, Roche, IN, USA).
Calculation of Gensini score
The Gensini score was calculated by assigning a
severity score on each coronary stenosis, based on the degree of
luminal narrowing and geographic importance. Reduction in the lumen
diameter, and the radiologic appearance of concentric lesions and
eccentric plaques were assessed. Reductions of 25, 50, 75, 90 and
99%, and complete occlusion were allocated a Gensini score of 1, 2,
4, 8, 16 and 32. Involvement of each principal vascular segment was
assigned a multiplier defined by the functional significance of the
myocardial area supplied by that segment. Thus, the left main
coronary artery received a multiplier ×5, proximal segment of the
left anterior descending coronary artery −×2.5, proximal segment of
the circum flex artery −×2.5, mid-segment of the left anterior
descending coronary artery −×1.5, while right coronary artery,
distal segment of the left anterior descending coronary artery,
posterolateral artery, and obtuse marginal artery received a
multiplier ×1. The sum of the adjusted results made the total
Gensini score.
Statistical analysis
Data were analyzed using SPSS 18.0 software (SPSS,
Chongqing, China). Data were presented as the mean ± standard
deviation. Due to large individual differences of fasting insulin
(FINS) levels and coronary Gensini scores, the data were analyzed
following a logarithm transition.
A one-way analysis of variance was utilized when the
variance was homogeneity. A non-parametric test was used for
parameters when the variance was heteroscedasticity. The
homeostasis model assessment-insulin sensitivity (HOMA-IS) index
was assessed by HOMA2. Based on the HOMA-insulin resistance (IR)
(50%), the patients were classified into insulin-sensitive and
-insensitive individuals. Analysis between ID, IT, DT, and IT/DT
correlations with the coronary artery damage Gensini score was
determined, where the correlative degree was expressed by the
correlation coefficient (r). Multivariate regression analysis among
ID, IT, DT, and IT/DT was performed to determine the correlations
with the coronary artery damage Gensini score. ID, IT, DT, and
IT/DT were compared between the subgroups, according to the
interquartile range (IQR) method (Q1, Q2, Q3 and Q4). The ID, IT,
DT, and IT/DT values of patients with coronary artery disease
(Gensini score >0) were analyzed with receiver operating
characteristic (ROC) curves. P<0.05 was considered to indicate a
statistically significant difference.
Results
Patient data and outcomes were compared between the
high- and low-dose groups (Table I).
Statistically significant differences were observed between the two
groups for the levels of insulin C-peptide, HbA1c, ID, IT, DT, the
IT/DT ratio and Gensini's score values (P<0.05, the high- vs.
low-dose groups). No significant differences were observed
regarding patients' gender, smoking history, age, BMI, the levels
of TC, TG, LDL, HDL, FINS levels, Glu, or SBP or DBP (P<0.05)
(Table I).
 | Table I.Comparison of patients' demographic
and biochemical characteristics between low- and high-dose insulin
groups. |
Table I.
Comparison of patients' demographic
and biochemical characteristics between low- and high-dose insulin
groups.
| Parameters | Low-dose insulin | High-dose
insulin | P-value |
|---|
| Gender
(male/female) | 179 (105/74) | 174 (92/82) | 0.099 |
| Age, years | 64.91±9.59 | 66.62±8.85 | NS |
| Smoking history | 76 | 84 | NS |
| BMI,
kg/m2 | 25.34±3.22 | 25.08±3.21 | NS |
| LDL-C, mmol/l | 2.46±0.79 | 2.69±0.78 | 0.063 |
| HDL-C, mmol/l | 1.10±0.30 | 1.04±0.31 | NS |
| TC, mmol/l | 4.43±1.13 | 4.75±1.26 | NS |
| TG, mmol/l | 1.79±1.36 | 1.92±1.48 | NS |
| Insulin, pmol/l | 1.91±0.55 | 1.88±0.50 | NS |
| Glu, mmol/l | 8.54±3.91 | 9.12±3.36 | NS |
| HbA1c, mmol/l | 7.92±1.97 | 8.75±2.09 | 0.013 |
| C-peptide,
mmol/l | 2.86±1.90 | 2.27±1.75 | 0.048 |
| SBP, mmHg | 146.52±25.83 | 152.15±28.48 | NS |
| DBP, mmHg | 82.30±14.35 | 81.92±13.74 | NS |
| Insulin dose, IU | 20.37±7.08 | 38.74±8.98 | <0.001 |
| DT, years | 8.24±5.05 | 13.27±8.19 | <0.001 |
| IT, years | 3.05±2.62 | 6.50±5.42 | <0.001 |
| Ratio of IT/DT | 0.41±0.27 | 0.49±0.19 | 0.034 |
| Gensini score | 30.82±30.07 | 48.20±36.76 | 0.002 |
Based on the HOMA-IR (50%), the patients were
classified as insulin-sensitive (n=173) and -insensitive (n=180)
(Table II). The Gensini score in
insulin-insensitive patients was significantly greater than that in
insulin-sensitive patients (P<0.05) (Table II).
| Table II.Insulin-sensitivity vs. coronary
artery damage. |
Table II.
Insulin-sensitivity vs. coronary
artery damage.
| Parameter | Insulin-insensitive
patients, n=173 | Insulin-sensitive
patients, n=180 | P-value |
|---|
| Gensini score | 45.08±37.79 | 33.89±30.31 | 0.044 |
In addition, ID, IT, DT, and the IT/DT ratio
positively correlated with the Gensini score (P<0.05) (Table III).
| Table III.Correlation between insulin dose, IT,
DT, the IT/DT ratio, and Gensini score. |
Table III.
Correlation between insulin dose, IT,
DT, the IT/DT ratio, and Gensini score.
| Parameter | Insulin dose | IT | DT | Ratio of IT/DT |
|---|
| Gensini score | r=0.300 | r=0.319 | r=0.163 | r=0.281 |
| P-value | (P<0.001) | (P<0.001) | (P=0.044) | (P<0.001) |
The multivariate regression analysis revealed which
factors were associated with changes in ID (OR = 0.230, P<0.01)
and the IT/DT ratio (OR = 0.300, P<0.01) (Table IV).
| Table IV.Multivariate regression analysis of
association between insulin dose, IT, DT, the IT/DT ratio, and
Gensini score. |
Table IV.
Multivariate regression analysis of
association between insulin dose, IT, DT, the IT/DT ratio, and
Gensini score.
| Parameters | Insulin dose | IT | DT | Ratio of IT/DT |
|---|
| Odds ratio | 0.230 | 0.142 | 0.214 | 0.300 |
| P-value | 0.007 | 0.410 | 0.166 | 0.009 |
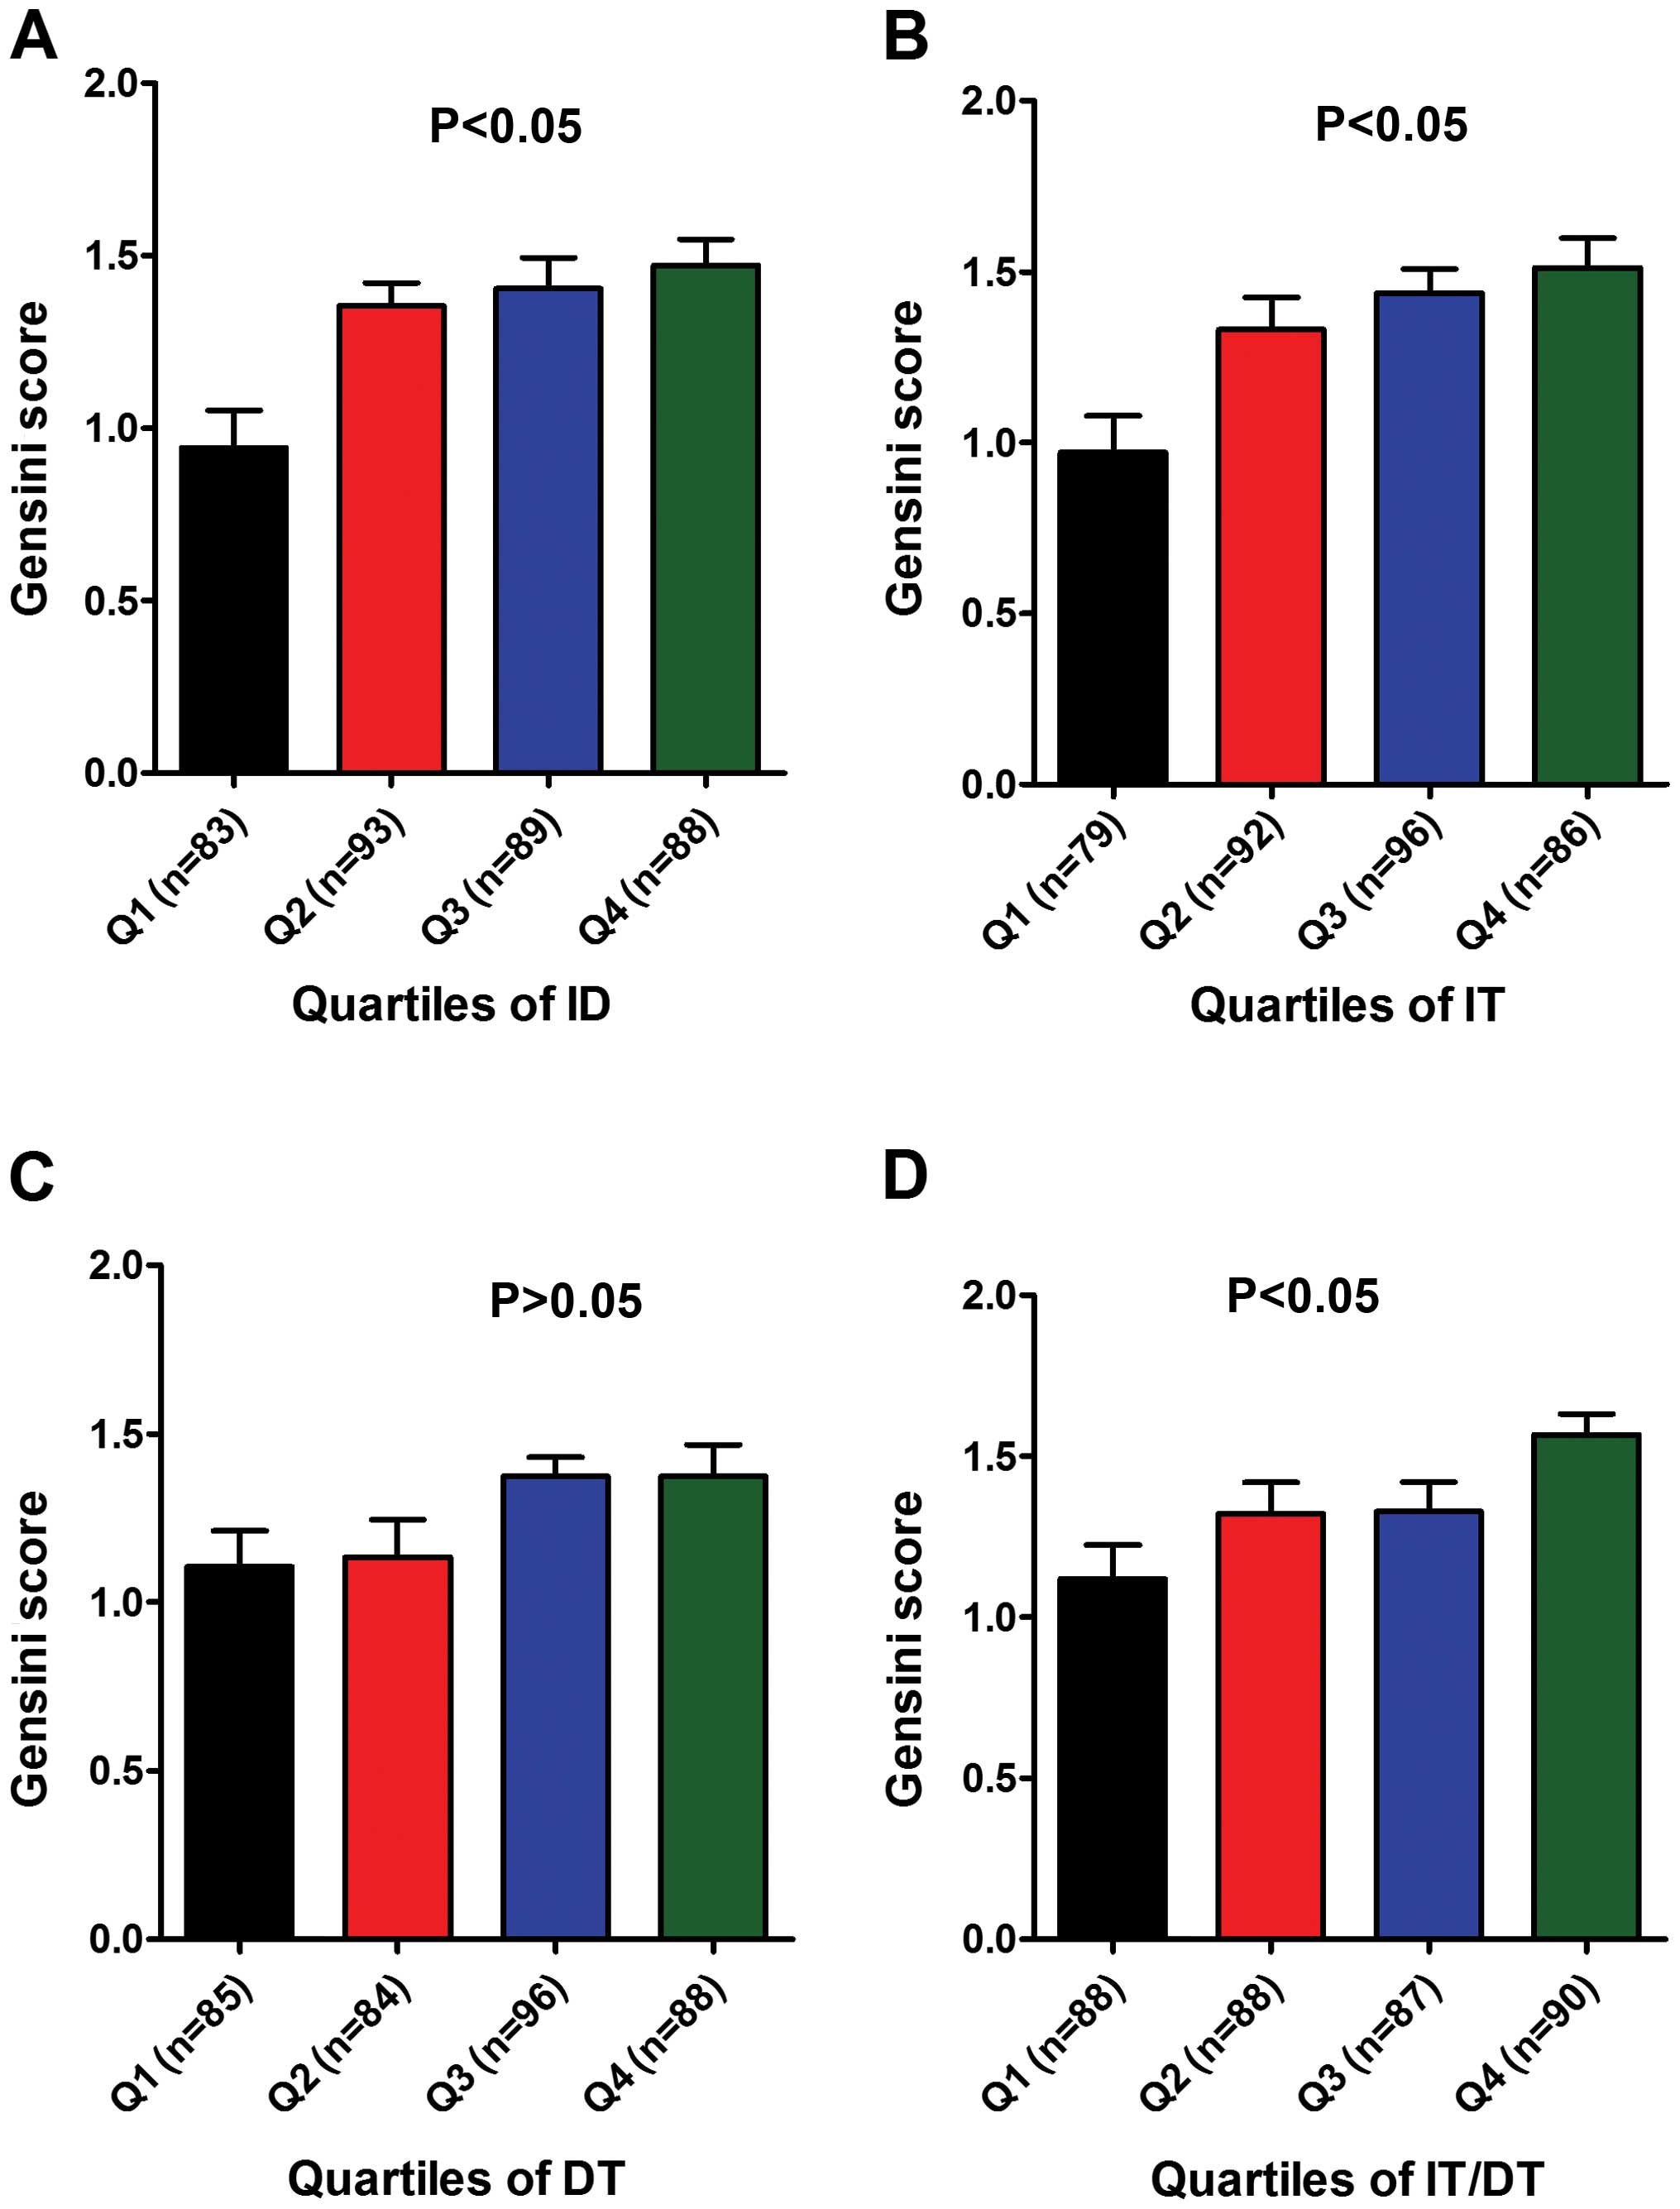
Based on the IQR method, indices such as ID (≤20,
20–30, 30–40, ≥40), IT (≤1, 1–3, 3–6, ≥6), DT (≤5, 5–10, 10–14,
≥14), and the IT/DT ratio (≤0.3, 0.3–0.4, 0.4–0.6, ≥0.6), were
compared between subgroups (Q1, Q2, Q3 and Q4) (Table V).
| Table V.Analysis of insulin dose, IT, DT, and
the IT/DT ratio in subgroups by the interquartile range method. |
Table V.
Analysis of insulin dose, IT, DT, and
the IT/DT ratio in subgroups by the interquartile range method.
| Parameters | Q1 | Q2 | Q3 | Q4 |
|---|
| Insulin dose | <20 | 20–30 | 30–40 | >40 |
| IT | ≤1 | 1–3 | 3–6 | ≥6 |
| DT | ≤5 | 5–10 | 10–14 | ≥14 |
| Ratio of IT/DT | <0.3 | 0.3–0.4 | 0.4–0.6 | >0.6 |
Statistics showed that the coronary artery damage
Gensini score of the highest indicator subgroup (Q4) was
significantly higher than that in the lowest indicator subgroup
(Q1). In addition to IT, there were also significant differences
between the remainig three indices of the subgroups (Fig. 1).
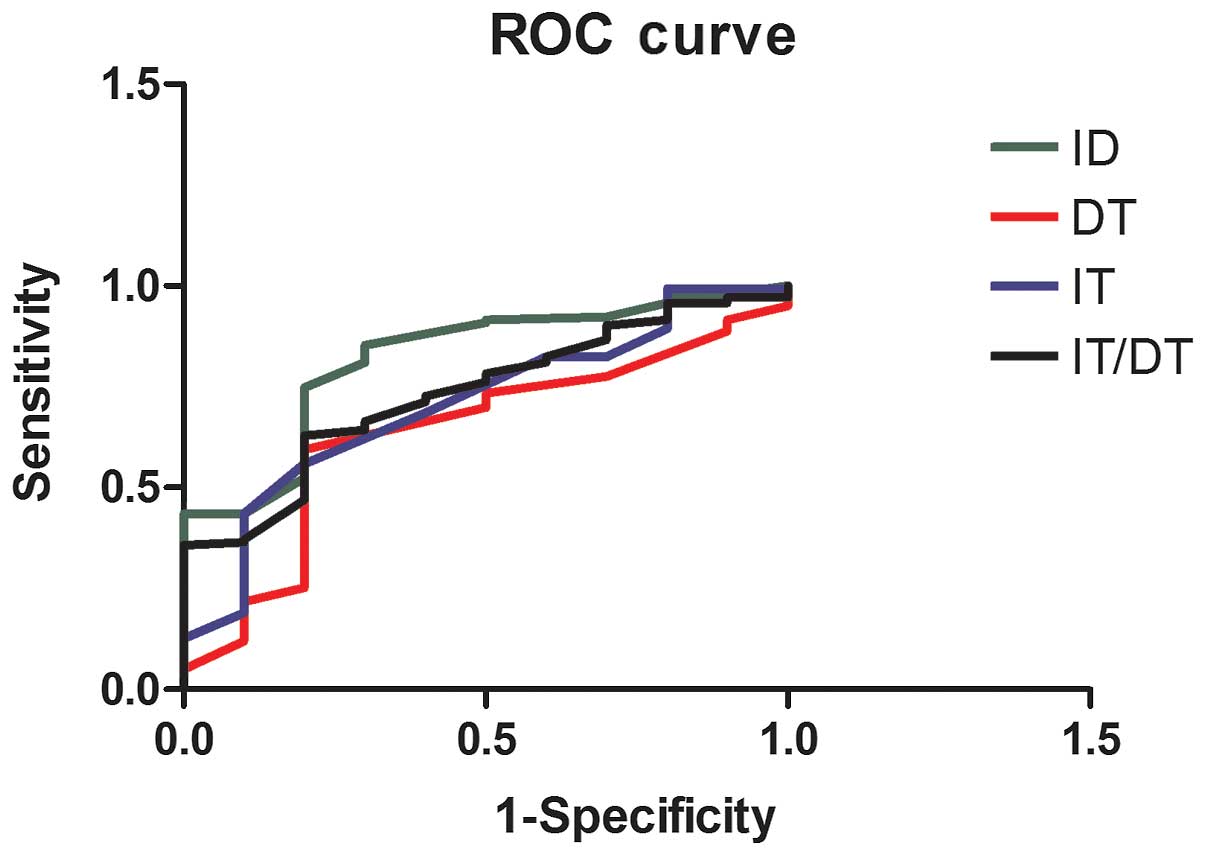
We carried out a ROC curve analysis on ID, IT, DT,
and the IT/DT ratio. ROC analysis revealed that the ID area under
the ROC curve was 0.820 (range, 0.696–0.945), the IT/DT area under
the ROC curve was 0.733 (range, 0.599–0.867), and IT area under the
ROC curve was 0.708 (range, 0.552–0.864). These indices were
statistically significant (Table
VI). However, the DT ROC curve did not obtain statistical
significance (Fig. 2).
| Table VI.Analysis of insulin dose, IT, DT, and
the IT/DT ratio in subgroups by ROC method. |
Table VI.
Analysis of insulin dose, IT, DT, and
the IT/DT ratio in subgroups by ROC method.
| Parameters | Area | P-value | Lower limit | Upper limit |
|---|
| Insulin dose | 0.820 | 0.001 | 0.696 | 0.945 |
| IT | 0.708 | 0.028 | 0.552 | 0.864 |
| DT | 0.637 | 0.149 | 0.552 | 0.864 |
| Ratio of IT/DT | 0.733 | 0.014 | 0.599 | 0.867 |
Discussion
At present, insulin is used early to control blood
Glu of patients with T2D (9–10). Excessive use of insulin is common in
China (11). However, such excessive
use of insulin potentially leads to hypoglycemia, insulin
resistance and even hyperinsulinemia (2). Thus, the effect insulin has on the
occurrence and development of AS remains controversial. It has been
shown that high doses of insulin reduce plasma levels of
interleukin-6, interleukin-8, and tumor necrosis factor-α, thereby
attenuating inflammatory processes, promoting heart metabolism, and
facilitating the recovery of myocardial cells and its myocardial
functions (12–15). However, high doses of FINS (ID)
aggravate the severity of coronary artery disease (3,4). In
addition, no studies have been conducted thus far with regard to
the association between IT, DT and coronary AS. Therefore, IT and
DT were included in the present study. We observed a positive
association between IT, DT and Gensini scores. In order to show the
extent of early treatment of insulin, the concept of ‘insulin usage
time/diabetes duration time (IT/DT)’ was applied in the study, for
the first time, to the best of our knowledge. A positive
association between IT/DT and Gensini score was also identified.
The ROC analysis clearly revealed that ID, IT, IT/DT were
predictive of the severity of coronary artery damage
Long-term administration of exogenous insulin can
lead to lipid abnormality and vascular wall thickening (4,16). In
animals, insulin induces experimental AS (4). Coronary heart disease and AS induced by
high-dose insulin may be due to: i) stimulation of proliferation
and migration of arterial smooth muscle cells (17), ii) stimulation of uptake of
cholesterol and LDL-C by endothelial cells of capillary vessels,
which causes a combination of LDLs with arterial smooth muscle
cells and mononuclear macrophage (18–21),
iii) release of platelet-derived growth factor, insulin-like growth
factor-1 and other inflammatory factors, by activating insulin
mitogen-activated protein kinase/phosphoinositide 3-kinase signal
transduction pathways using high-dose insulin. Combined, this
inhibits release of nitric oxide, causing endothelial cell damage
and oxidative stress, and leading to AS (22–24).
Thus, hyperinsulinemia may be a risk factor of coronary heart
disease and AS (25–27). Our finding showed statistical
differences between the high-dose group (≥0.5 IU/kg) and low-dose
group (<0.5 IU/kg), such as insulin C-peptide, HbA1c, ID, DT,
IT, IT/DT and the Gensini's score values (P<0.05). The
correlation analysis revealed the ID, IT, DT and IT/DT values were
positively correlated with the coronary artery damage Gensini
score. These data suggest that the degree of the coronary artery
lesions were correlated with insulin doses or insulin usage
time.
In the present study, insulin-insensitive patients
had significantly higher Gensini scores. Based on this, we suggest
that for T2D patients who do not take lifestyle intervention on
diet, physical activity and smoking-insulin sensitivity should be
calculated based on blood Glu and FINS levels when selecting the
insulin-sensitizing treatment. If the effect is not satisfactory,
exogenous insulin therapy should be administered based on weight to
avoid overdosing. If recovery of the islet cell sensitivity to Glu,
tested by HOMA, in T2D patients after insulin use occurs, the
treatment plan should be adjusted to avoid long-term excessive
exposure to insulin and minimize the damage of insulin to blood
vessels.
In conclusion, the results of the present study
suggest that in T2D patients in, higher ID or the ratio IT/DT are
associated with more serious coronary injury. This finding suggests
that an early and longer-term administration of high-dose of
insulin may negatively impact coronary vessels.
Acknowledgements
The present study was supported by a Chinese
National Natural Science Foundation grant to X.K. Wang (grant no.
81170281).
References
|
1
|
2010 U.S. Type 2 Diabetes Patients'
Choice: Awareness. Usage, and Preferences of Insulin Injection
Pens. Frost & Sullivan. 2011.
|
|
2
|
Rensing KL, Reuwer AQ, Arsenault BJ, von
der Thüsen JH, Hoekstra JB, Kastelein JJ and Twickler TB: Reducing
cardiovascular disease risk in patients with type 2 diabetes and
concomitant macrovascular disease: can insulin be too much of a
good thing? Diabetes Obes Metab. 13:1073–1087. 2011. View Article : Google Scholar : PubMed/NCBI
|
|
3
|
Yanase M, Takatsu F, Tagawa T, Kato T,
Arai K, Koyasu M, Horibe H, Nomoto S, Takemoto K, Shimizu S and
Watarai M: Insulin resistance and fasting hyperinsulinemia are risk
factors for new cardiovascular events in patients with prior
coronary artery disease and normal glucose tolerance. Circ J.
68:47–52. 2004. View Article : Google Scholar : PubMed/NCBI
|
|
4
|
Caccamo G, Bonura F, Bonura F, Vitale G,
Novo G, Evola S, Evola G, Grisanti MR and Novo S: Insulin
resistance and acute coronary syndrome. Atherosclerosis.
211:672–675. 2010. View Article : Google Scholar : PubMed/NCBI
|
|
5
|
Breen DM and Giacca A: Effects of insulin
on the vasculature. Curr Vasc Pharmacol. 9:321–332. 2011.
View Article : Google Scholar : PubMed/NCBI
|
|
6
|
Kuboki K, Jiang ZY, Takahara N, Ha SW,
Igarashi M, Yamauchi T, Feener EP, Herbert TP, Rhodes CJ and King
GL: Regulation of endothelial constitutive nitric oxide synthase
gene expression in endothelial cells and in vivo: a specific
vascular action of insulin. Circulation. 101:676–681. 2000.
View Article : Google Scholar : PubMed/NCBI
|
|
7
|
Chinese Diabetes Society (CDS): Chinese
guideline for type 2 diabetes prevention (2013). Chin J Diab.
22:2–42. 2014.(In Chinese).
|
|
8
|
Leahy JL and Cefalu WT: Insulin Therapy.
Marcel Dekker, Inc. New York, NY: 193–222. 2002.
|
|
9
|
Permana H: How to initiate and
intensification of insulin therapy in type 2 DM patients with
obesity? Obes Res Clin Pract J. 7(Suppl 1): 7–8. 2013. View Article : Google Scholar
|
|
10
|
No authors listed: Summary of revisions
for the 2009 Clinical Practice Recommendations. Diabetes Care.
32(Suppl 1): S3–S5. 2009.PubMed/NCBI
|
|
11
|
Endocrinology society of Chinese Medical
Association: Chinese expert consensus on the clinical application
of adult type 2 diabetes insulin. Chin J Endocrinol Metab. 29:1–6.
2013.
|
|
12
|
Albacker T, Carvalho G, Schricker T and
Lachapelle K: High-dose insulin therapy attenuates systemic
inflammatory response in coronary artery bypass grafting patients.
Ann Thorac Surg. 86:20–27. 2008. View Article : Google Scholar : PubMed/NCBI
|
|
13
|
Owens DR: Stepwise intensification of
insulin therapy in type 2 diabetes management - exploring the
concept of the basal-plus approach in clinical practice. Diabet
Med. 30:276–288. 2013. View Article : Google Scholar : PubMed/NCBI
|
|
14
|
Albacker TB, Carvalho G, Schricker T and
Lachapelle K: Myocardial protection during elective coronary artery
bypass grafting using high-dose insulin therapy. Ann Thorac Surg.
84:1920–1927. 2007. View Article : Google Scholar : PubMed/NCBI
|
|
15
|
Mahajan R, Daga MK and Bhattacharjee J:
Hyperinsulinemia in subjects with and without coronary artery
disease: a preliminary study from North India. Indian Heart J.
54:687–691. 2002.PubMed/NCBI
|
|
16
|
Chistiakov DA, Sobenin IA, Orekhov AN and
Bobryshev YV: Mechanisms of medial arterial calcification in
diabetes. Curr Pharm Des. 20:5870–5883. 2014. View Article : Google Scholar : PubMed/NCBI
|
|
17
|
Siddals KW, Allen J, Sinha S, Canfield AE,
Kalra PA and Gibson JM: Apposite insulin-like growth factor (IGF)
receptor glycosylation is critical to the maintenance of vascular
smooth muscle phenotype in the presence of factors promoting
osteogenic differentiation and mineralization. J Biol Chem.
286:16623–16630. 2011. View Article : Google Scholar : PubMed/NCBI
|
|
18
|
Kim JA, Montagnani M, Koh KK and Quon MJ:
Reciprocal relationships between insulin resistance and endothelial
dysfunction: molecular and pathophysiological mechanisms.
Circulation. 113:1888–1904. 2006. View Article : Google Scholar : PubMed/NCBI
|
|
19
|
Purohit P: A correlation study of CVD risk
factors in Type 2 diabetics of Western Rajasthan. Int J Diabetes
Dev Ctries. 190–197. 2014.
|
|
20
|
Adiels M, Borén J, Caslake MJ, Stewart P,
Soro A, Westerbacka J, Wennberg B, Olofsson SO, Packard C and
Taskinen MR: Overproduction of VLDL1 driven by hyperglycemia is a
dominant feature of diabetic dyslipidemia. Arterioscler Thromb Vasc
Biol. 25:1697–1703. 2005. View Article : Google Scholar : PubMed/NCBI
|
|
21
|
Tangvarasittichai S, Poonsub P and
Tangvarasittichai O: Association of serum lipoprotein ratios with
insulin resistance in type 2 diabetes mellitus. Indian J Med Res.
131:641–648. 2010.PubMed/NCBI
|
|
22
|
Hill MM, Connolly LM, Simpson RJ and James
DE: Differential protein phosphorylation in 3T3-L1 adipocytes in
response to insulin versus platelet-derived growth factor. No
evidence for a phosphatidylinositide 3-kinase-independent pathway
in insulin signaling. J Biol Chem. 275:24313–24320. 2000.
View Article : Google Scholar : PubMed/NCBI
|
|
23
|
Abhijit S, Bhaskaran R, Narayanasamy A,
Chakroborty A, Manickam N, Dixit M, Mohan V and Balasubramanyam M:
Hyperinsulinemia-induced vascular smooth muscle cell (VSMC)
migration and proliferation is mediated by converging mechanisms of
mitochondrial dysfunction and oxidative stress. Mol Cell Biochem.
373:95–105. 2013. View Article : Google Scholar : PubMed/NCBI
|
|
24
|
Cohen P: The twentieth century struggle to
decipher insulin signalling. Nat Rev Mol Cell Biol. 7:867–873.
2006. View
Article : Google Scholar : PubMed/NCBI
|
|
25
|
Ning J and Clemmons DR: AMP-activated
protein kinase inhibits IGF-I signaling and protein synthesis in
vascular smooth muscle cells via stimulation of insulin receptor
substrate 1 S794 and tuberous sclerosis 2 S1345 phosphorylation.
Mol Endocrinol. 24:1218–1229. 2010. View Article : Google Scholar : PubMed/NCBI
|
|
26
|
Isenović ER, Kedees MH, Tepavcević S,
Milosavljević T, Korićanac G, Trpković A and Marche P: Role of
PI3K/AKT, cPLA2 and ERK1/2 signaling pathways in insulin regulation
of vascular smooth muscle cells proliferation. Cardiovasc Hematol
Disord Drug Targets. 9:172–180. 2009. View Article : Google Scholar : PubMed/NCBI
|
|
27
|
Doronzo G, Viretto M, Russo I, et al:
Insulin increases matrix metalloproteinase-2 synthesis, secretion
and activity in aortic vascular smooth muscle cells through the
PI3-K pathway: effect reduced by insulin resistance. Diabetologia.
51:S253–S254. 2008.
|