Introduction
Deep vein thrombosis (DVT) is the formation of a
thrombus within a deep vein, predominantly occurring in the legs
(1). DVT commonly occurs in 40–80%
of patients undergoing orthopedic surgery, such as total hip
replacement, total knee replacement and hip fracture surgery
(2–4). Pulmonary embolisms can be caused by a
detached thrombus that travels to the lungs, and they are a
potentially life-threatening complication of DVT with a high
mortality rate (5,6). DVT is difficult to diagnosis as
patients with DVT often lack clear signs prior to its onset
(7–9).
To date, lower limb phlebography has been considered
to be the gold standard for the diagnosis of DVT; however, as it is
an invasive and high-cost procedure, the application of lower limb
phlebography in the diagnosis of liver DVT is limited (10). Color and spectral Doppler
ultrasonography is commonly used in the diagnosis of DVT in lower
limb veins; however, ultrasonography requires that patients move
continually, which can increase patient suffering and is a
time-consuming process. On the basis of the above factors, a simple
and rapid method of diagnosing DVT is urgently required.
D-dimer is a fibrin degradation product that exists
in the blood after a thrombus is degraded by thrombin, coagulation
factor XIIIa and fibrinolysin. Expression levels of D-dimer can
reflect the activity of coagulation and the fibrinolytic system
and, therefore, may be used to diagnose DVT (11,12).
Previous studies have demonstrated that expression levels of
D-dimer in serum are significantly increased following DVT
(13,14). However, the expression levels of
D-dimer are also increased when the coagulation and fibrinolysis
system is activated in surgery, trauma, bleeding disorders,
inflammatory diseases, kidney disease and pregnancy (15). A method of predicting the occurrence
of DVT with regards to the expression levels of D-dimer prior to
and following orthopedic surgery requires clarification.
In the present study, the expression levels of
D-dimer in serum were analyzed in patients with DVT prior to and
following orthopedic surgery. Receiver operating characteristic
(ROC) analysis was performed in order to predict the occurrence of
DVT on the basis of the expression levels of D-dimer in plasma.
Patients and methods
Patients
A total of 175 patients (88 males, 87 females; age
range, 59–74 years; average age, 66.42 years) with DVT following
orthopedic surgery (DVT group) were enrolled in the present study.
The prognosis of DVT was founded on clinical manifestations,
imaging and laboratory test results. A total of 161 orthopedic
patients (56 males, 105 females; age range, 25–86 years; average
age, 62.13 years) without DVT following orthopedic surgery (non-DVT
group) were included in the present study as control subjects.
The exclusion criteria for the DVT group were as
follows: i) Patients with DVT prior to orthopedic surgery; ii)
patients with recent active bleeding and spontaneous intracranial
hemorrhage; iii) patients with bleeding disorders undergoing
anticoagulant treatment; iv) patients with severe liver and kidney
disease; v) patients who had not undergone surgery or trauma; vi)
patients with history of thrombosis; and vii) patients with
malignancies or inflammatory diseases. The study was approved by
the Ethics Review Board of the First Affiliated Hospital of Dalian
Medical University (Dalian, China) and written informed consent was
obtained from every patient.
Detection of D-dimer expression levels
in plasma
Peripheral venous blood samples were collected from
patients prior to orthopedic surgery and at 1, 3 and 7 days after
surgery. Blood samples (~1.8 ml) were transferred into
anticoagulant tubes (BD Biosciences, San Jose, CA, USA) with 0.2 ml
citric acid (109 mM) and mixed. The samples were then centrifuged
at 1,700 × g for 15 min. The plasma supernatants were transferred
to a new tube for the analysis of D-dimer expression levels.
D-dimer was detected using an enzyme-linked fluorescent assay,
conducted using a VIDAS D-dimer Exclusion II kit (bioMérieux Inc.,
Grenoble, France) and a Spectramax M2 microplate reader (Molecular
Devices, LCC, Sunnyvale, CA, USA). The detection was performed in
accordance with the manufacturer's instructions.
Color Doppler ultrasonography
Venous examination of the lower limbs was conducted
in patients prior to, and 3 and 7 days after orthopedic surgery.
The venous diameter, blood flow, intraluminal pressure, deep venous
valve function and thrombosis formation were determined using an
ACUSON Antares Color Doppler ultrasound system (Siemens AG, Munich,
Germany).
Statistical analysis
All results are expressed as the mean ± standard
deviation. All statistical analyses were performed using SPSS
version 13.0 for Windows (SPSS, Inc., Chicago, IL, USA). A paired
t-test was used to analyze the comparisons between groups and the
analysis of paired data. ROC analysis was used to determine the
ability of D-dimer expression levels to predict DVT. P<0.05 was
considered to indicate a statistically significant difference.
Results
Diagnosis of patients with DVT by
color Doppler ultrasonography
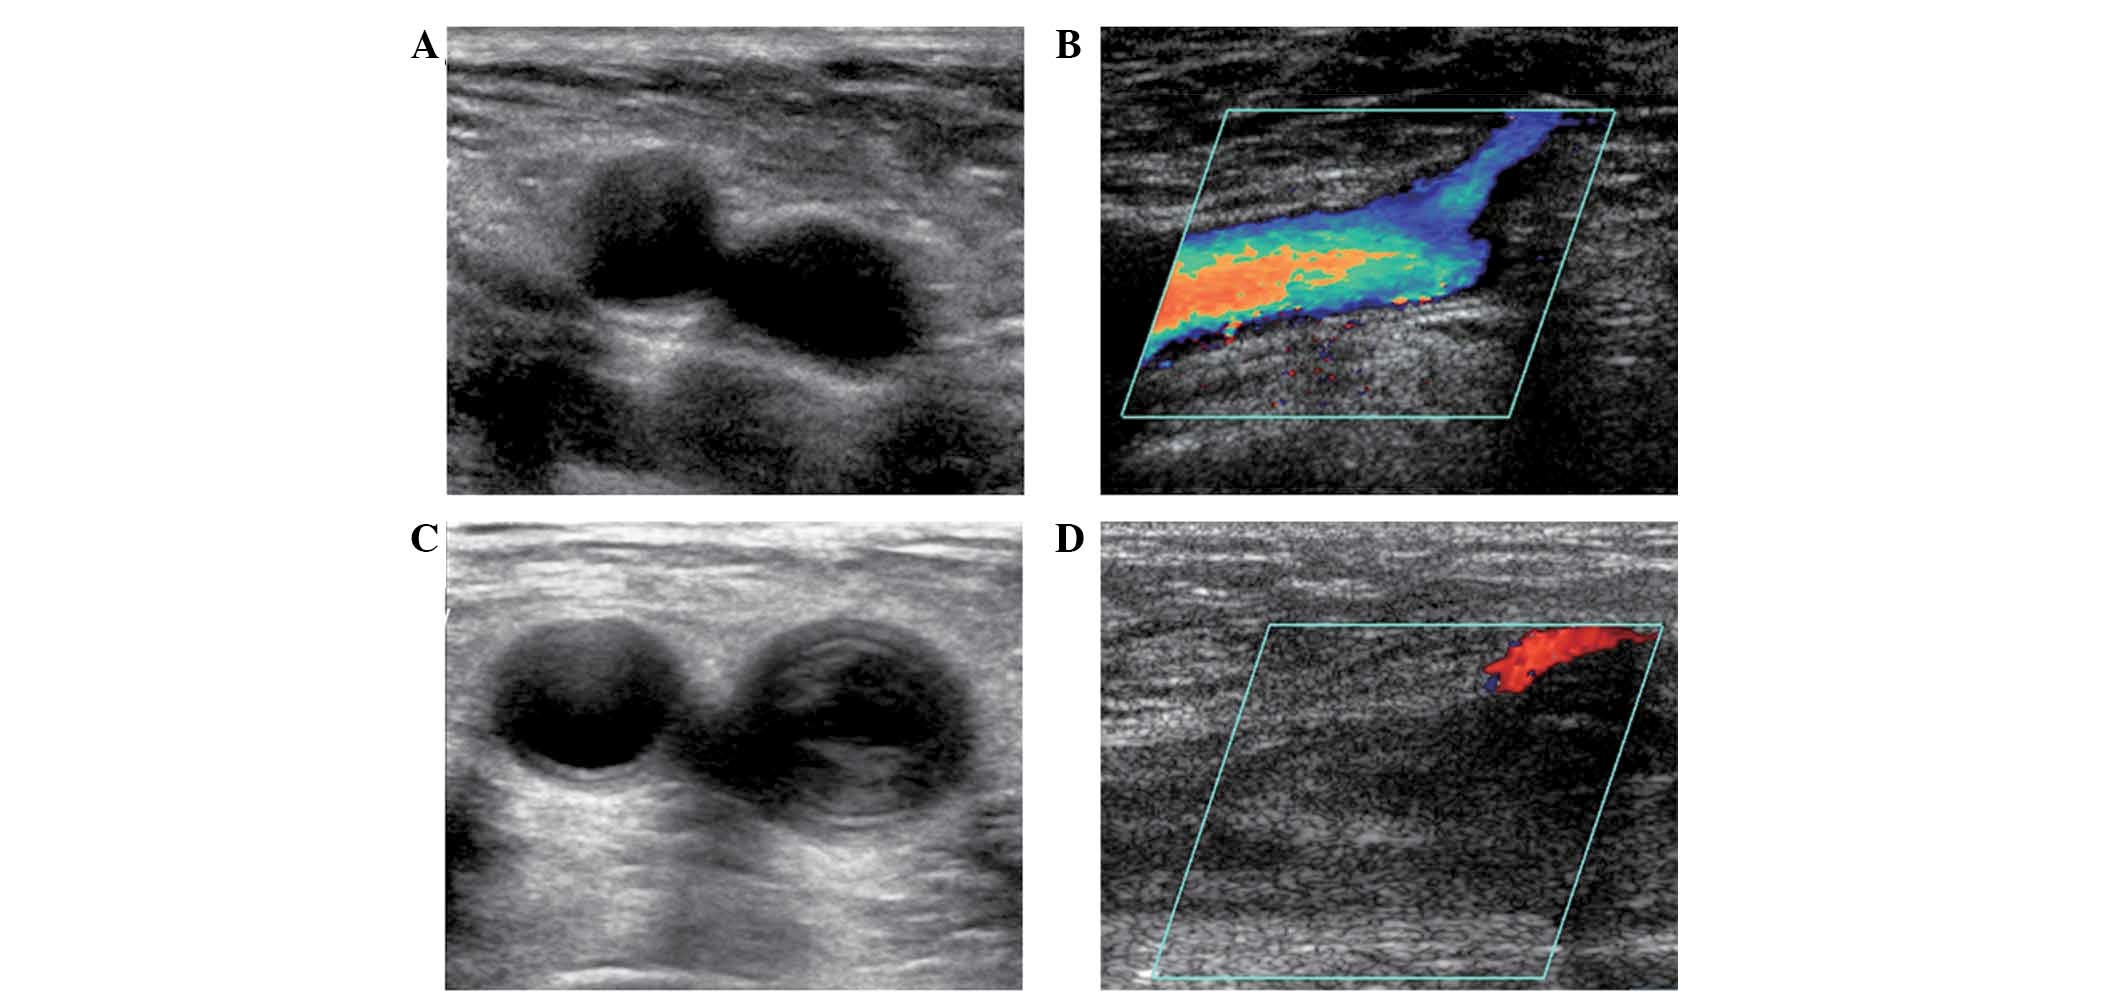
To diagnose DVT, ultrasonic color Doppler imaging
was performed on lower limb veins prior to and following orthopedic
surgery. Color Doppler ultrasonography provides information
regarding the size, localization, echogenicity, margins and
tendency of the thrombus structure. As presented in Fig. 1A and B, there was no sign of thrombus
in the femoral vein in the non-DVT group, and axial images
demonstrated that non-significant stenosis was present in the
femoral vein. However, several thrombi were observed in the femoral
veins of the non-DVT group, and axial images showed that
significant vein stenosis was present (Fig. 1C and D). The underlying conditions of
the orthopedic patients with DVT, and the corresponding DVT
incidence rates are presented in Table
I. The incidence rate of DVT in patients with acetabular
dysplasia was markedly greater compared with that in the patients
with other conditions. The incidence of DVT occurring in patients
with coxodynia was the lowest of all the conditions listed in
Table I.
 | Table I.Underlying conditions of orthopedic
patients with DVT. |
Table I.
Underlying conditions of orthopedic
patients with DVT.
| Condition | Number of
patients | Constituent ratio
(%) | Incidence of DVT
(%) |
|---|
| ANFH | 68 | 39 |
9 |
| OA | 20 | 11 | 10 |
| FNF | 28 | 16 | 11 |
| RA | 19 | 11 | 11 |
| AD | 11 |
6 | 27 |
| CD |
5 |
3 |
0 |
| SF | 24 | 14 |
4 |
| Total | 175 | 100 | 16 |
Correlation between the expression
levels of D-dimer in plasma and the incidence of DVT
To investigate the correlation between D-dimer and
the incidence of DVT, the expression levels of D-dimer in plasma
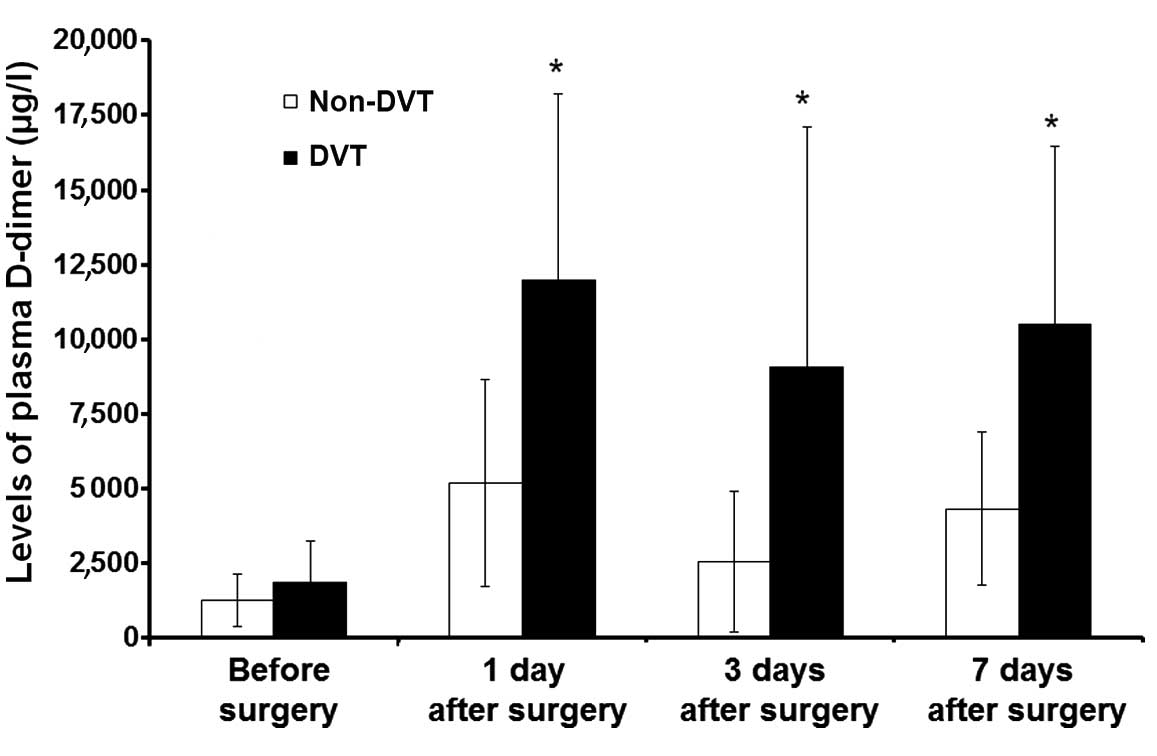
were detected using an enzyme linked fluorescent assay. As
presented in Fig. 2, there was no
significant difference between the expression levels of D-dimer in
plasma between the DVT and the non-DVT group prior to orthopedic
surgery. However, at 1 day after orthopedic surgery the expression
levels of D-dimer in the plasma of the DVT group were significantly
increased in comparison with those in the non-DVT group
(P<0.05). Although the expression levels of D-dimer in the
plasma decreased slightly on days 3 and 7 following orthopedic
surgery, the D-dimer expression levels in the DVT group remained
significantly higher than those in the non-DVT group (P<0.05).
These results suggest that the expression levels of D-dimer in
plasma are correlated with the incidence of DVT.
Prediction of DVT in patients with
different types of orthopedic disease
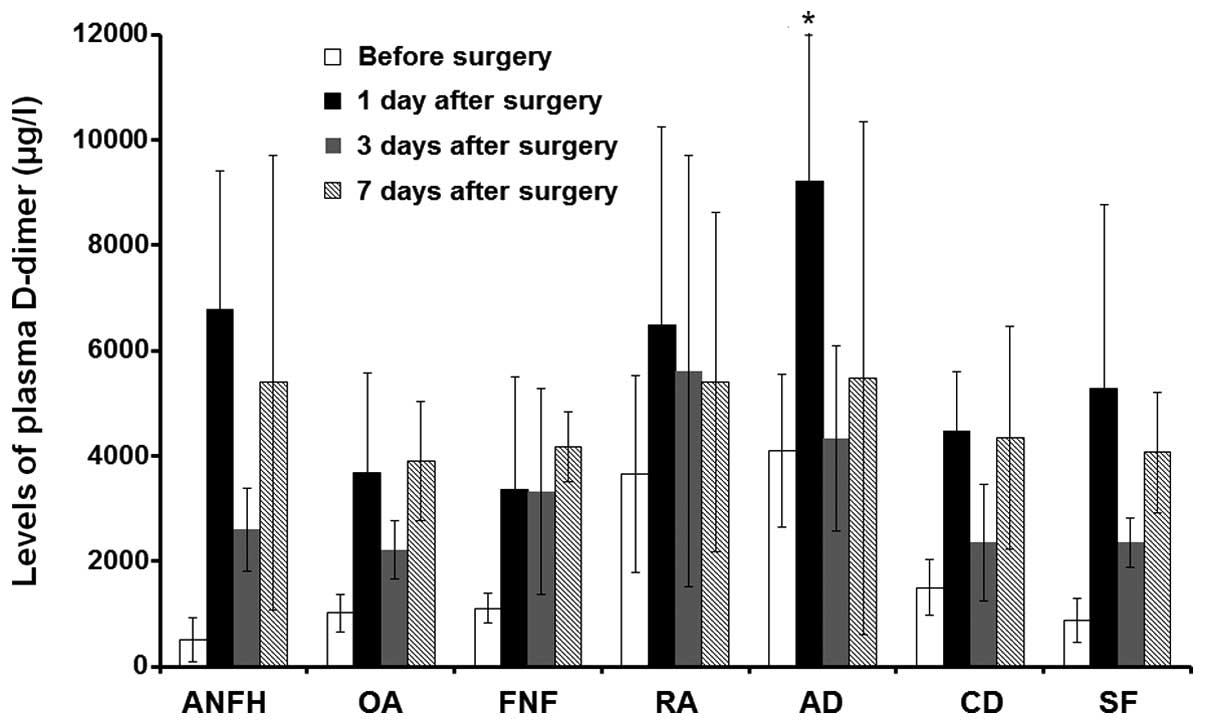
To investigate the use of D-dimer expression levels
in the prediction of DVT, plasma D-dimer levels were detected in
the DVT group at 1 day prior to, and 1, 3 and 7 days after
orthopedic surgery. According to the different types of orthopedic
condition that required surgery, the DVT group was classified into
7 subgroups (Table I). As presented
in Fig. 3, the expression levels of
D-dimer in the plasma of each subgroup were higher 1 day after
orthopedic surgery in comparison with the expression levels prior
to orthopedic surgery (P<0.05). The expression levels of D-dimer
in plasma were decreased at 3 days after orthopedic surgery in
comparison with the expression levels 1 day after orthopedic
surgery, and were increased at 7 days after orthopedic surgery in
comparison with 3 days after surgery. Plasma D-dimer expression
levels in the fractured neck of femur subgroup were higher at 7
days after orthopedic surgery than at the other time points. With
the exclusion of the fractured neck of femur subgroup, plasma
D-dimer expression levels in the other 6 subgroups were the highest
on day 1 following orthopedic surgery. Plasma D-dimer expression
levels in the acetabular dysplasia subgroup were significantly
increased in comparison with those in the other subgroups at 1 day
after surgery (P<0.05), and this is in accordance with the high
incidence of DVT in patients with acetabular dysplasia. These
results suggest that the detection of plasma D-dimer expression
levels 1 day after orthopedic surgery may be important in the
prediction of DVT.
ROC analysis for predicting DVT using
plasma D-dimer expression levels
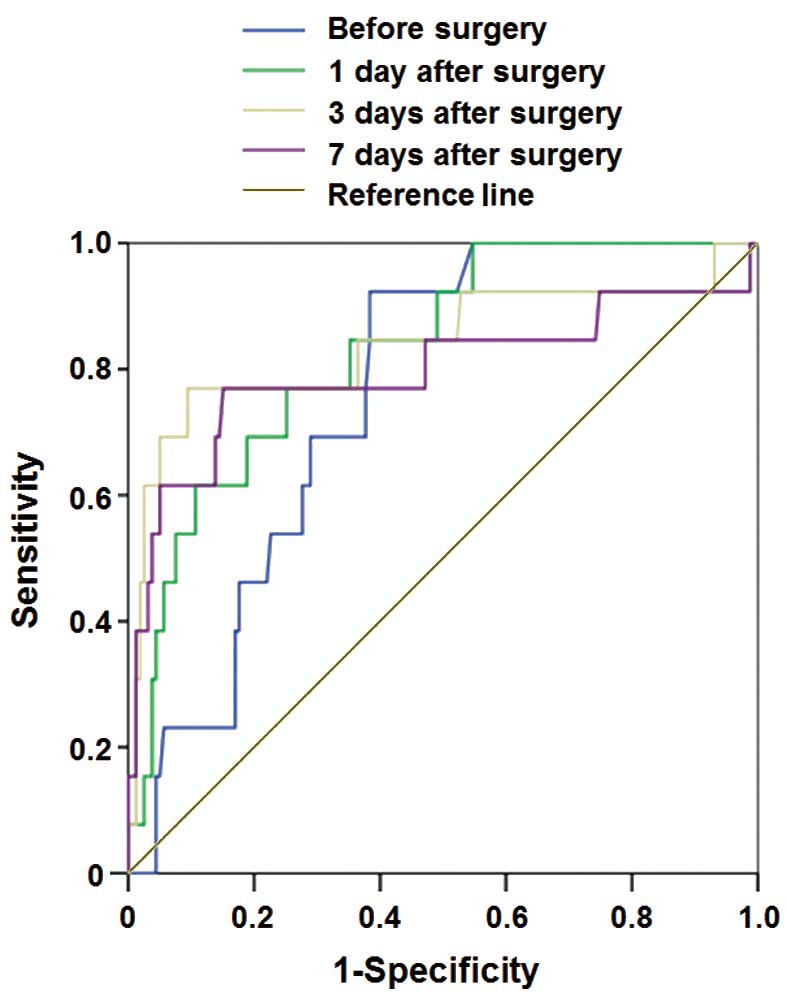
To determine the diagnostic accuracy of plasma
D-dimer expression levels in predicting the development of DVT in
patients with orthopedic disease, ROC analysis was performed. As
presented in Fig. 4 and Table II, the area under the ROC curve for
plasma D-dimer expression level 1 day after orthopedic surgery in
the prediction of DVT was 0.889; the optimal cut-off value was
6,360 µg/l, and the threshold of the optimal cut-off value had a
sensitivity of 92.9% and a specificity of 85%. The area under ROC
curve for plasma D-dimer expression level 3 days after orthopedic
surgery in the prediction of DVT was 0.870; the optimal cut-off
value was 4,580 µg/l, and the threshold of the optimal cut-off
value had a sensitivity of 76.9% and a specificity of 67%. These
results indicate that the detection of plasma D-dimer expression
levels 1 day after orthopedic surgery is important in the
prediction of DVT.
| Table II.ROC analysis of the prediction of DVT
using plasma D-dimer levels. |
Table II.
ROC analysis of the prediction of DVT
using plasma D-dimer levels.
|
|
|
|
| 95% confidence
interval |
|---|
|
|
|
|
|
|
|---|
| Time point | Area under ROC
curve | Standard error | P-value | Lower limit | Upper limit |
|---|
| Prior to surgery | 0.660 | 0.048 | 0.011 | 0.666 | 0.854 |
| 1 day after
surgery | 0.889 | 0.053 | 0.003 | 0.727 | 0.988 |
| 3 days after
surgery | 0.870 | 0.076 | 0.009 | 0.690 | 0.933 |
| 5 days after
surgery | 0.732 | 0.087 | 0.004 | 0.626 | 0.967 |
Combination analysis for predicting
DVT using optimal cut-off values of plasma D-dimer expression
levels
To improve the diagnostic accuracy of predicting
DVT, combination analysis was performed using plasma D-dimer
expression levels at 1 and 3 days after orthopedic surgery.
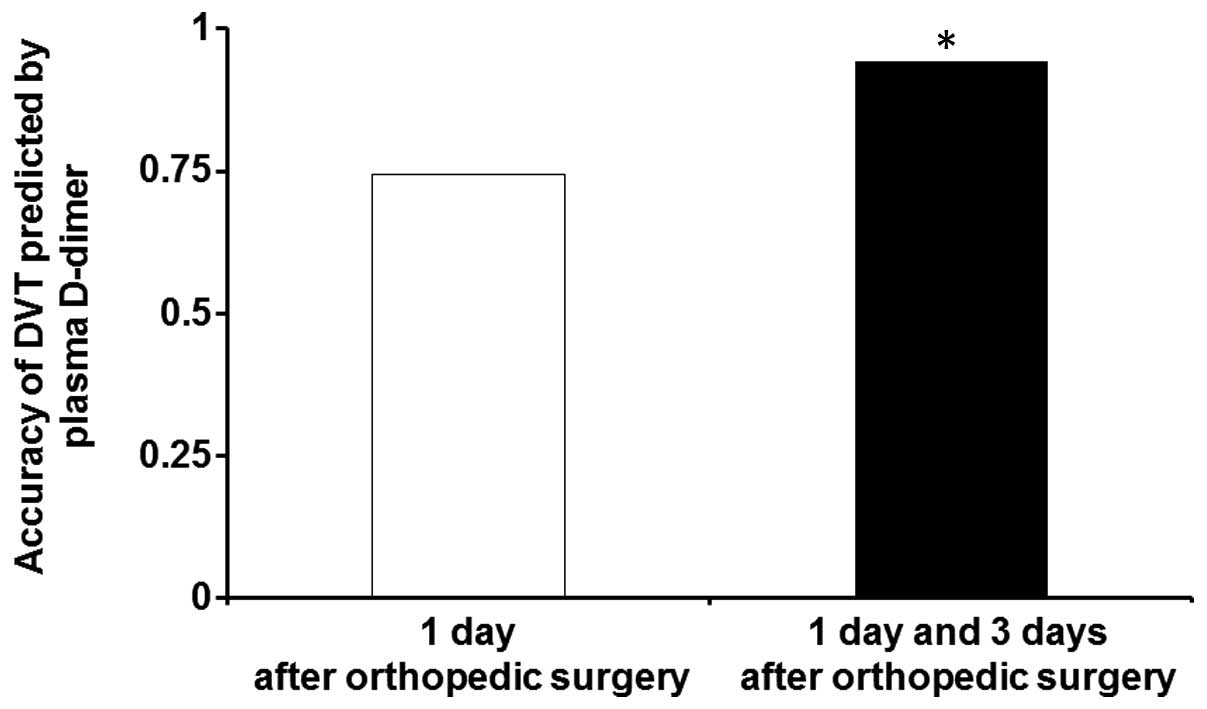
Diagnostic accuracy for predicting DVT is presented in Fig. 5. The diagnostic accuracy predicted
using the optimal cut-off value at 1 day after orthopedic surgery
was <75%. However, the diagnostic accuracy predicted using the
combined optimal cut-off values at 1 and 3 days after orthopedic
surgery was ~94%, which was significantly higher than the accuracy
calculated using single optimal cut-off values (P<0.05). These
results suggest that the diagnostic accuracy predicted using
combined optimal cut-off values is significantly higher than that
predicted using single optimal cut-off values.
Discussion
DVT is a complication of orthopedic surgery that
accounts for the onset of >50% of pulmonary embolisms (16). Each year, the mortality resulting
from pulmonary embolisms caused by DVT is ~0.5% (17), and early prevention and accurate
diagnosis is key to reducing the morbidity and mortality of DVT.
Color Doppler ultrasonography is the preferred method used in the
clinical diagnosis of DVT as it is a non-invasive and repeatable
procedure (18). The diagnostic
accuracy of color Doppler ultrasonography of DVT is 97% (19); however, it is a time-consuming and
uncomfortable process for the patient, who is required to
repeatedly move throughout the examination.
The measurement of plasma D-dimer expression levels
is a simple and low-cost procedure. In addition, the procedure can
be repeated and dynamically observed in the same patient. However,
a method for determining the critical detection time and the
optimal cut-off value of plasma D-dimer expression levels in
orthopedic patients is urgently required.
In the present study, plasma D-dimer expression
levels were recorded in DVT and non-DVT groups prior to and
following orthopedic surgery. The results indicate that the
detection of plasma D-dimer expression levels in orthopedic
patients 1 day after surgery may be important in the prediction of
DVT. ROC analysis results of plasma D-dimer expression levels at
different time points prior to and following orthopedic surgery
demonstrated that the area under the ROC curve of plasma D-dimer
expression levels 1 day after orthopedic surgery was 0.889; the
optimal cut-off value was 6,360 µg/l, and the threshold of the
optimal cut-off value had a sensitivity of 92.9% and a specificity
of 85%.
In the present study, plasma D-dimer expression
levels differed between different time points, patients and types
of surgery. Therefore, predicting DVT using plasma D-dimer
expression levels at a single point has limitations and
inaccuracies. Diagnostic accuracy predicted using combined optimal
cut-off values at 1 and 3 days after orthopedic surgery was ~94%,
which was significantly higher than that predicted using single
optimal cut-off values.
In conclusion, the results from the present study
suggest that the detection of plasma D-dimer expression levels 1
day after orthopedic surgery is important in the prediction of DVT.
In addition, the diagnostic accuracy of DVT is significantly
increased by the combined analysis with optimal cut-off values at 1
and 3 days after orthopedic surgery.
References
|
1
|
Lyle CA, Gibson E, Lovejoy AE and
Goldenberg NA: Acute prognostic factors for post-thrombotic
syndrome in children with limb DVT: a bi-institutional cohort
study. Thromb Res. 131:37–41. 2013. View Article : Google Scholar : PubMed/NCBI
|
|
2
|
Dua A, Neiva S and Sutherland A: Does
previous varicose vein surgery alter deep vein thrombosis risk
after lower limb arthroplasty? Orthop Surg. 4:222–226. 2012.
View Article : Google Scholar : PubMed/NCBI
|
|
3
|
Shah K, Thevendran G, Younger A and Pinney
SJ: Deep-vein thrombosis prophylaxis in foot and ankle surgery:
What is the current state of practice? Foot Ankle Spec. 10:101–106.
2015. View Article : Google Scholar
|
|
4
|
Jeeshan RR, Ahmad M and Graham MTS:
Subclavian vein thrombosis following acute internal fixation of a
clavicular fracture. Shoulder Elbow. 5:108–110. 2013. View Article : Google Scholar
|
|
5
|
Wakabayashi H, Hasegawa M, Niimi R, Naito
Y, Nakagawa T and Sudo A: Clinical analysis of preoperative deep
vein thrombosis risk factors in patients with total hip
arthroplasty. Thromb Res. 136:855. 2015. View Article : Google Scholar : PubMed/NCBI
|
|
6
|
Ozgur ES, Karaca K, Ozye C and Nayci SA:
Does anatomic location of deep venous thrombosis affect the
clinical findings and course in the patient of pulmonary embolism.
Eur Respir J. 38(Suppl 55): 23452011.
|
|
7
|
Mant MJ, Eurich DT, Russell DB and
Majumdar SR: Post-thrombotic syndrome after total hip arthroplasty
is uncommon. Acta Orthop. 79:794–799. 2008. View Article : Google Scholar : PubMed/NCBI
|
|
8
|
Struijk-Mulder MC, Ettema HB, Verheyen CC
and Büller HR: Comparing consensus guidelines on thromboprophylaxis
in orthopedic surgery. J Thromb Haemost. 8:678–683. 2010.
View Article : Google Scholar : PubMed/NCBI
|
|
9
|
Geerts WH, Bergqvist D, Pineo GF, Heit JA,
Samama CM, Lassen MR and Colwell CW: American College of Chest
Physicians: Prevention of venous thromboembolism: American College
of Chest Physicians Evidence-Based Clinical Practice Guidelines
(8th Edition). Chest. 133(6 Suppl): S381–S453. 2008. View Article : Google Scholar
|
|
10
|
Tenna AM, Kappadath S and Stansby G:
Diagnostic tests and strategies in venous thromboembolism.
Phlebology. 27(Suppl 2): 43–52. 2012. View Article : Google Scholar : PubMed/NCBI
|
|
11
|
Molugu C, Fisher G, Hirons B, Hughes D and
Raftery S: P151 V-DimERS Study - Value of D-Dimers in estimating
risk of significant pulmonary embolism and deep vein thrombosis.
Thorax. 68(Suppl 3): A1442013. View Article : Google Scholar
|
|
12
|
Aaron W and Ann V: Is the D-dimer test a
viable option for the detection of PE? J Nucl Med. 55:27082014.
|
|
13
|
Wells P: Overview and comparison of
D-dimer assay kits for DVT and PE. Clin Adv Hematol Oncol.
2:1602004.PubMed/NCBI
|
|
14
|
Lees D, Griffiths P, Paxton C and Wahbi Z:
Can D-dimer assay, together with clinical probability predict
computed tomography pulmonary angiogram (CTPA) outcomes for
pulmonary embolism (PE)? Eur Respir J. 38(Suppl 55): 5822011.
|
|
15
|
Shimoyama Y, Sawai T, Tatsumi S, Nakahira
J and Minami T: Examination of risk factors for deep vein
thrombosis following total hip arthroplasty. Masui. 60:897–902.
2011.(In Japanese). PubMed/NCBI
|
|
16
|
Park Y, Choi H, Kim SH, Kang J, Kang WC,
Shin MS and Moon J: Multisite paradoxical embolisms in a patient
with patent foramen ovale and pulmonary thromboembolism. Int J
Cardiol. 159:e29–e31. 2012. View Article : Google Scholar : PubMed/NCBI
|
|
17
|
Wu O, Clark P, Lowe GD, Walker ID and
Greer IA: Thrombosis: Risk and Economic Assessment of Thrombophilia
Screening (TREATS) Study Group: Thrombophilia and venous
thromboembolism after total hip or knee replacement surgery: A
systematic review. J Thromb Haemost. 3:811–813. 2005. View Article : Google Scholar : PubMed/NCBI
|
|
18
|
Lausen I, Jensen R, Wille-Jørgensen P,
Jørgensen L, Rasmussen M, Lyng K, Andersen M and Raaschou H: Colour
Doppler flow imaging ultrasonography versus venography as screening
method for asymptomatic postoperative deep venous thrombosis.
Original. European Journal of Radiology. 20:200–204. 1995.
View Article : Google Scholar : PubMed/NCBI
|
|
19
|
Magnusson MB, Nelzén O, Risberg B and
Sivertsson R: A colour Doppler ultrasound study of venous reflux in
patients with chronic leg ulcers. European Journal of Vascular and
Endovascular Surgery. 21:353–360. 2001. View Article : Google Scholar : PubMed/NCBI
|