Introduction
Coronary artery disease (CAD) is an increasingly
prevalent threat to human health. The incidence of this disease is
associated with the involved coronary arteries, including the
degree and number of branches. It is crucial to develop methods to
accurately diagnose coronary artery disease, evaluate its severity
and ultimately to guide clinical intervention or treatment. Imaging
examination methods are crucial; for example, multi-slice spiral
computed tomography angiography (CTA), digital subtraction
angiography (DSA) and ultrasound examination. Among these
techniques, DSA is currently recognized as the gold standard.
However, with the continuous development of equipment and
technology updates CTA has in certain regards superseded the
function of DSA (1–10).
In recent years, CTA has been approved for use in
numerous fields and has been increasingly used in the detection and
diagnosis of clinical CAD. In particular, the temporal resolution
of the latest 64-slice spiral CT has improved considerably, making
the imaging of coronary arteries clearer and the diagnosis more
accurate (11–21). In general, study reports have
evaluated the diagnostic value of coronary CTA by determining the
sensitivity and specificity; however, using these two indicators
alone tends to ignore the influence of different interpretations by
the observers on the results. By contrast, the receiver operating
characteristic (ROC) curve method can minimize the possible
differences, which makes the diagnostic evaluation more objective.
The aim of the present study, therefore, was to investigate the
diagnostic accuracy of Philips 256-slice spiral CT for coronary
imaging and to perform ROC curve analysis to evaluate the use of
256-slice CTA in coronary artery stenosis.
Patients and methods
Patients
A total of 100 patients underwent coronary CTA and
coronary angiography (CAG) checks, with intervals between the two
methods of 3–15 days (average, 8 days). According to heart rate
(HR), the patients were divided into three groups: Low HR (n=40
patients; HR <75 bpm); moderate HR (n=35 patients; 75≤ HR <90
bpm); and high HR (n=25; HR ≥90 bpm). Prior written informed
consent was obtained from the patients and their families. No
patient experienced any adverse reaction following the examination.
A total of 100 cases of suspected coronary heart disease were
collected between May 2011 and June 2012, with the following
exclusions: i) Allergy to iodinated contrast agents; ii)
respiratory insufficiency or acute decompensated heart function
insufficiency; iii) severe hepatic or renal insufficiency; iv)
coronary stent or bypass surgery; and v) placement of a permanent
pacemaker or following artificial heart valve replacement
surgery.
CT examination
CT examinations were performed with prospective
electrocardiographic gating using a 256-slice multi-detector CT
scanner (Brilliance iCT; Philips Healthcare, Cleveland, OH, USA).
The parameters were as follows: Tube potential, 120 kVp;
tube current, 800–1,000 mA; slice thickness, 0.90 mm; increment,
0.45 mm; and matrix, 512×512. The scanning range was from 1 cm
below the tracheal bifurcation to the diaphragmatic level. The
enhancement scans used high concentrations of iodine-containing
non-ionic contrast agent (370 mg I/100 ml; 1.0 ml/kg), saline (30
ml) and an injection rate of 5.0–6.0 ml/sec. Using contrast agent
tracking trigger technology, the area of interest was located in
the main pulmonary artery window level in the descending aorta.
With a triggering threshold of 150 HU, scanning started
automatically for the shortest delay time upon reaching the
threshold. The patients did not receive β-blockers or other drugs
to control HR prior to inspection. At a time of 3–5 min before
scanning, the patients were sublingually administered 0.5 mg
nitroglycerin (Shanghai Bracco Sine Pharmaceutical Corp., Ltd.,
Shanghai, China).
CTA image processing
Good-quality images were transferred to the Extended
Brilliance Workspace 4.5 (Philips Healthcare) workstation for
processing and quality evaluation. The post-coronary CTA image
processing methods included volume rendering (VR), maximum
intensity projection, multi-planar reconstruction and curved planar
reformation (CPR).
Image quality assessment rating scale
(1–3)
Coronary vessels with a diameter of ≤1.5 mm were not
analyzed. Images were scored on a four-point ordinal scale (grades
1–4). On grade 1 images (3 points), the blood vessels were
continuous and clear, and the axial scanning showed sharp edges
with no motion artifacts and a fat density shadow at the edge. No
step artifacts could be seen on the VR image. On grade 2 images (2
points), segments of the small parts of the blood vessels showed
slightly blurred margins; the axial scanning showed smaller
artifacts, and light step artifacts could be seen on the VR image.
On grade 3 images (1 point), blood vessels appeared to have more
artifacts, a visible profile, bilateral or multilateral findings
and partial interruptions or split-levels, although when combined
with multi-phase cross-sections of the original image, clear
vascular lesions could be seen. On grade 4 images (0 points), the
blood vessels had a vague outline and were unclear, making it
impossible to distinguish between the blood vessels and the
surrounding tissue. Grades 1–3 were diagnostic but grade 4 images
could not be used in diagnosis. The degree of coronary artery
stenosis was measured using the following equation: Degree of
coronary artery stenosis = (average diameter of normal vessel at
the proximal and distal ends of the stricture - diameter of the
stricture vessel)/diameter of the normal vessel at the proximal end
of the stricture × 100%. The inner diameter of the coronary artery
was measured on the perpendicular to the blood vessel's major axis
on the CPR image.
Coronary artery digital subtraction
angiography (DSA) and segment evaluation
A Philips FD20 flat panel angiography system
(Philips Healthcare) was used and six projection positions were
selected (plus other positions when necessary). The left and right
coronary angiography procedures were performed through a femoral
artery puncture using a non-ionic contrast agent (370 mg I/100 ml).
The projection angle for the narrowest of lesion diameters was the
basis for the judgment of the degree of stenosis.
According to the American Heart Association
definition (12) and the Radiology
Heart Coronary Multi-Detector CT Clinical Applications
Collaborative Group Consensus (13),
the 15-segment classification system was used to evaluate the
coronary tree, as follows: Segments 1–3, the right coronary artery
proximal, middle and distal segments; segment 4, the posterior
descending artery/left ventricular posterior branch; segment 5, the
left main coronary artery; segments 6–8, the left anterior
descending artery proximal, middle and distal segments; segments 9
and 10, 1–2 diagonal branches; segments 11, 13 and 15, left
circumflex artery proximal, middle and distal segments; segments 12
and 14, 1–2 obtuse marginal branches.
Coronary artery CTA and CAG images were
independently evaluated by two highly qualified doctors with
relevant diagnostic experience. Any disagreements were subject to
resolution by discussion.
Statistical analysis
Data are presented as the mean ± standard deviation.
According to the SPSS software package (version 13.0; SPSS, Inc.,
Chicago, IL, USA), P<0.05 was considered to indicate a
statistically significant difference. Count data are expressed as
frequency percentages. CAG was used as the ‘gold standard’ for the
control, and an ROC curve was used to analyze 256-slice CTA for the
specificity and sensitivity of coronary artery stenosis diagnosis.
To compare the diagnostic differences among the different HR
groups, one-way analysis of variance was used.
Results
Patient data
The results were selected from 100 patients (63 male
and 37 female) aged between 37 and 87 years (average, 64.64±10.64
years) with HRs between 39 and 107 bpm (average, 76.44±13.36 bpm).
Among the total 1,500 coronary artery segments, CTA showed 1,447
segments (96.47%). A total of 96.83% of the low-HR group segments
were shown, compared with 96.95% of the moderate-HR group segments
and 95.20% of the high-HR group segments. The 53 segments not
evaluated included segments 2–5, 8–10 and 12–15.
Image quality
Among the 1,500 coronary segments, CTA could be used
to evaluate 1,447 coronary segments (96.47%) (Table I). The remaining 53 segments (3.53%)
were not shown and included segments 2–5, 8–10 and 12–15; segments
9, 10, 14 and 15 were most frequently not shown. Coronary CTA
images of 1,403 out of the 1,447 segments, accounting for 96.95%,
met the diagnostic score (1–3 points).
 | Table I.Coronary computed tomography
angiography image quality evaluation of 1,447 segments, n (%). |
Table I.
Coronary computed tomography
angiography image quality evaluation of 1,447 segments, n (%).
| HR group | 3 points | 2 points | 1 point | 0 points | Total |
|---|
| Low | 391 (67.30) | 154 (26.51) | 23 (3.96) | 13 (2.23) | 581 |
| Moderate | 343 (67.39) | 121 (23.77) | 29 (5.70) | 16 (3.14) | 509 |
| High | 221 (61.90) | 93
(26.05) | 28 (7.85) | 15 (4.20) | 357 |
In the low-HR group, 581 segments from the 40
patients (a total of 600 segments) were shown by CTA, accounting
for 96.83%. Images of 568 of these segments (97.76%) met the
diagnostic score (1–3 points): 391 (67.30%) were scored 3 points,
154 (26.51%) were scored 2 points and 23 (3.96%) were scored 1
point. In the moderate-HR group of 35 patients (a total of 525
segments), 509 segments (96.95%) were shown by CTA, with images of
493 (96.86%) of these segments meeting the diagnostic score [3
points, 343 (67.39%); 2 points, 121 (23.77%) and 1 point, 29
(5.70%)]. In the high HR group of 25 patients (a total of 375
segments) 357 segments, accounting for 95.20%, were shown by CTA,
with images of 342 segments (95.80%) meeting the diagnostic score:
221 (61.90%) were scored 3 points, 93 (26.05%) were scored 2 points
and 28 (7.85%) were scored 1 point. The comparison of image quality
scores among the different HR groups did not reveal a statistically
significant difference (χ2=5.017, P=0.081;
P>0.05).
Images of the remaining 44 segments were not
diagnostic, and those segments were excluded from the coronary
artery stenosis assessment. In the low-HR group, 13 segments
(2.23%) were excluded, compared with 16 (3.14%) from the
moderate-HR group and 15 (4.20%) from the high-HR group. Among
these segments, the majority were the middle of right coronary
artery (segment 2), accumulated of 10 segments.
Diagnostic accuracy
Using DSA as the ‘gold standard’, 1,403 segments
could be diagnosed with coronary artery stenosis via CTA. The
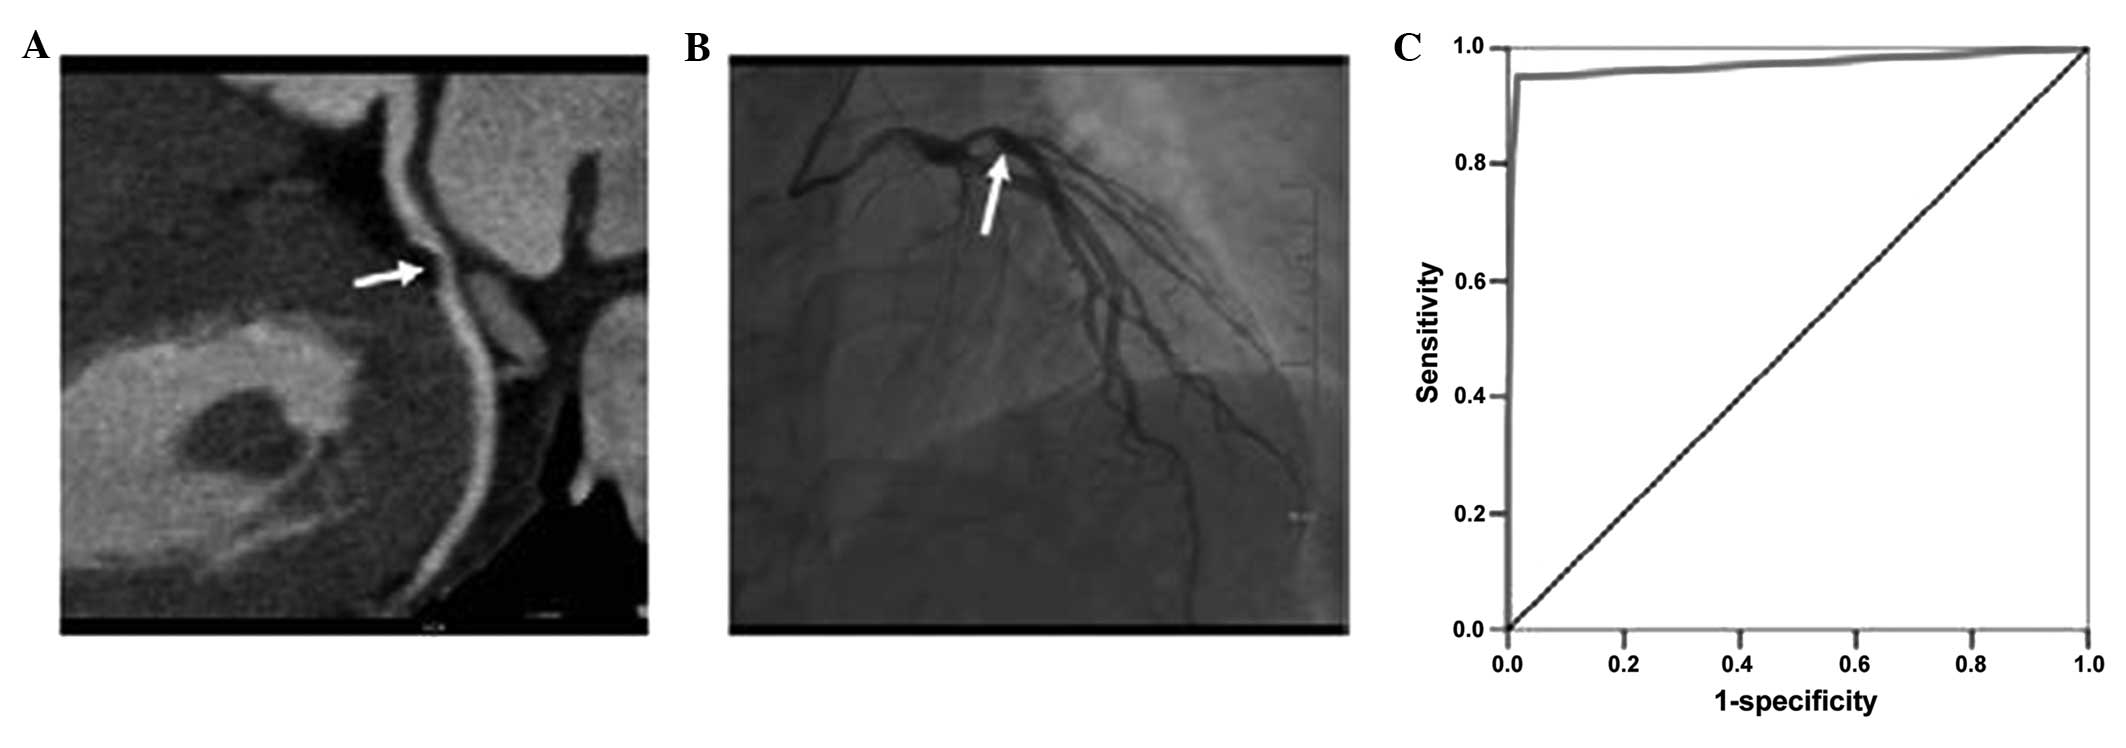
specificity of CTA for the diagnosis of coronary artery stenosis in
the low-HR group was 98.40%, the sensitivity was 95.00% and the
area under the ROC curve (Az) value was 0.971. Eight segments were
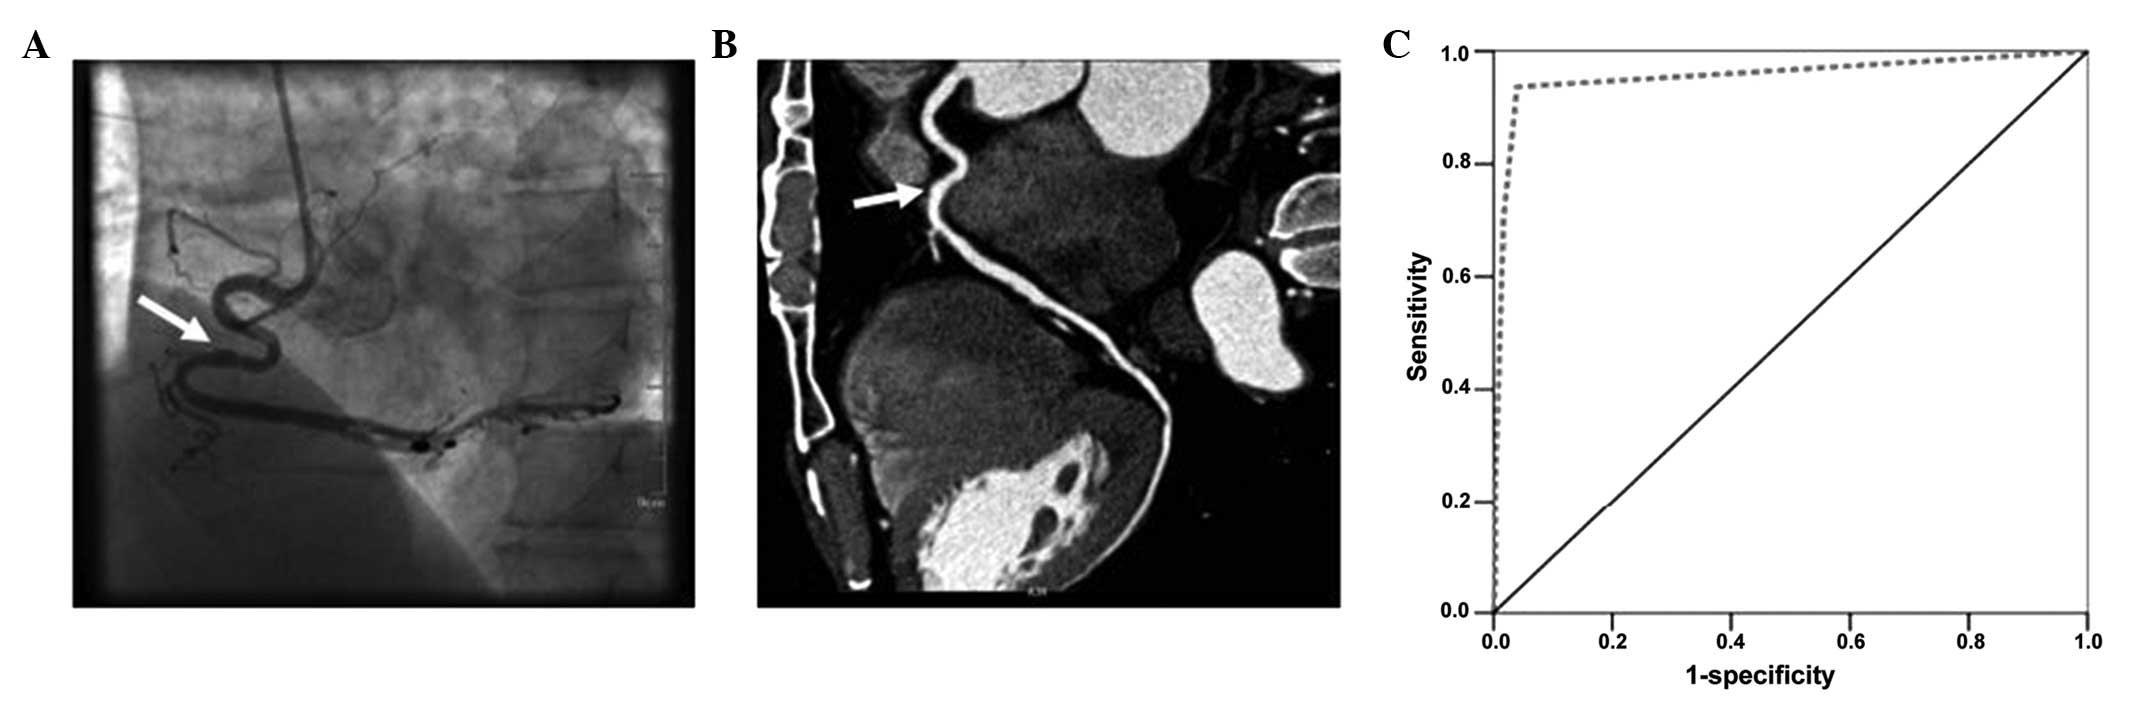
falsely positive and 4 segments were falsely negative (Table II and Fig. 1). In the moderate-HR group, the
specificity was 96.00%, the sensitivity was 93.70% and the Az value
was 0.955. A total of 14 segments were falsely positive and 9
segments were falsely negative (Table
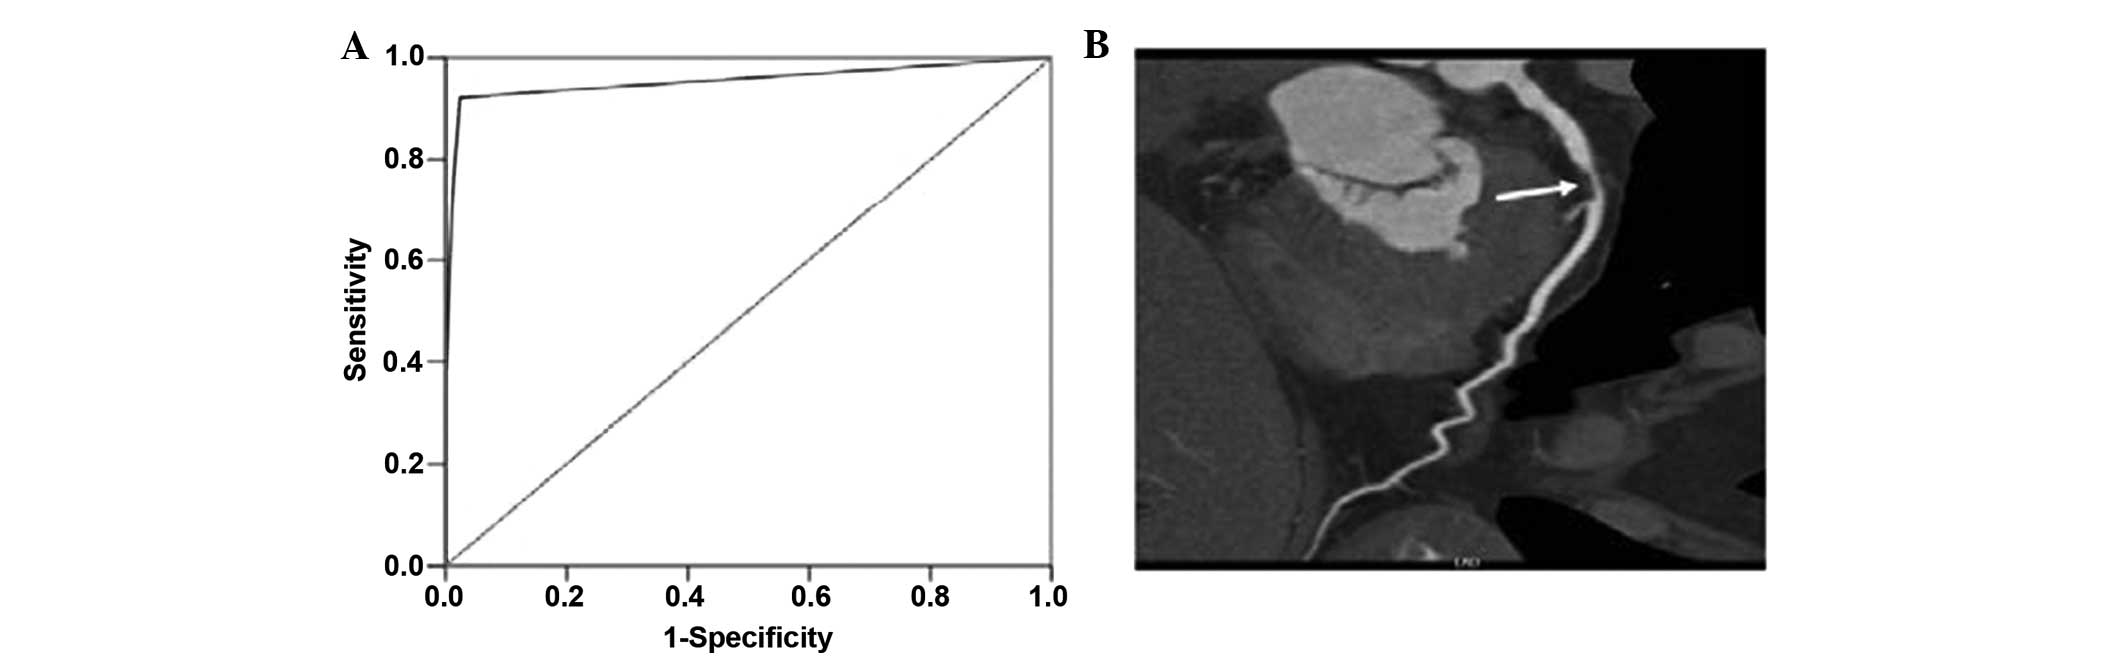
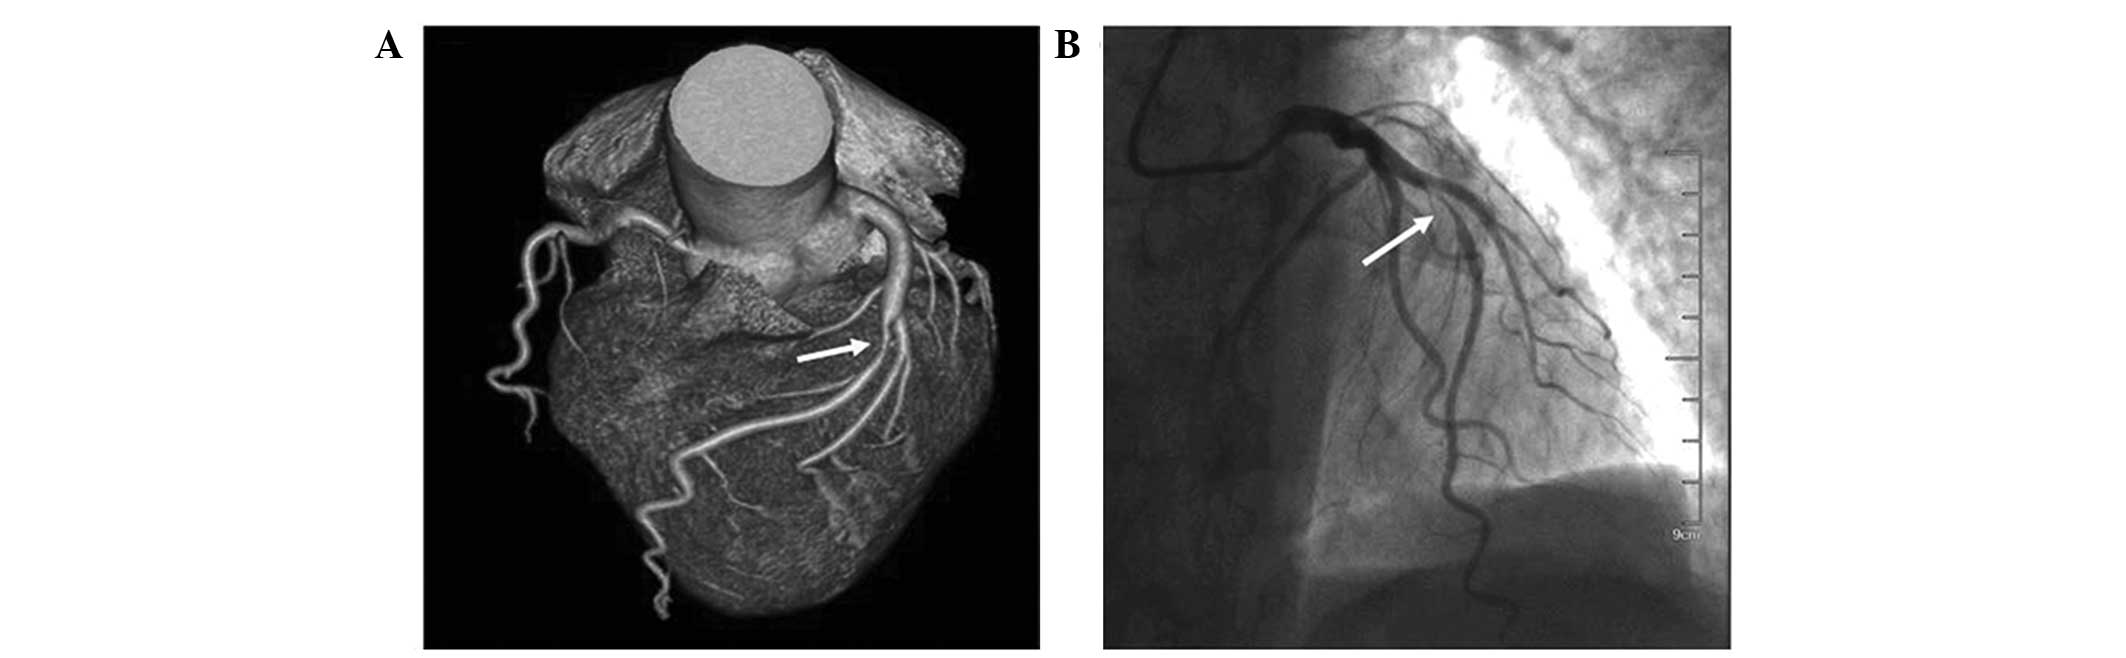
II and Fig. 2). In the high-HR
group, the specificity of CTA for the diagnosis of coronary artery
stenosis was 97.60%, the sensitivity was 92.20% and the Az value
was 0.955. Six segments were falsely positive and 7 segments were
falsely negative (Table II,
Figs. 3 and 4).
| Table II.Receiver operating characteristic
curve evaluation of the diagnosis of coronary artery stenosis using
CTA. |
Table II.
Receiver operating characteristic
curve evaluation of the diagnosis of coronary artery stenosis using
CTA.
| A, Low-HR group |
|---|
|
|---|
|
| CTA diagnosis
(n) |
|
|
|
|---|
|
|
|
|
|
|
|---|
| DSA diagnosis | Normal | Coronary
stenosis | Total | Specificity, % | Selectivity, % | Az value |
|---|
| Normal | 480 | 8 | 488 | 98.40 | 95.00 | 0.971 |
| Coronary
stenosis | 4 | 76 | 80 |
|
|
|
| Total | 484 | 84 | 568 |
|
|
|
|
| B, Moderate-HR
group |
|
|
| CTA diagnosis
(n) |
|
|
|
|
|
|
|
|
|
| DSA diagnosis | Normal | Coronary
stenosis | Total | Specificity, % | Selectivity, % | Az value |
|
| Normal | 337 | 14 | 351 | 96.00 | 93.70 | 0.955 |
| Coronary
stenosis | 9 | 133 | 142 |
|
|
|
| Total | 346 | 147 | 493 |
|
|
|
|
| C, High-HR group |
|
|
| CTA diagnosis
(n) |
|
|
|
|
|
|
|
|
|
| DSA diagnosis | Normal | Coronary
stenosis | Total | Specificity, % | Selectivity, % | Az value |
|
| Normal | 246 | 6 | 252 | 97.60 | 92.20 | 0.955 |
| Coronary
stenosis | 7 | 83 | 90 |
|
|
|
| Total | 253 | 89 | 342 |
|
|
|
The comparison of the Az values among the three
groups did not reveal a statistically significant difference
(F=0.703, P=0.516; P>0.05). Among the 1,403 segments that were
diagnosed, false positives were found in 28 segments, mainly in
segments 1, 2, 5–7 and 11–13; false negatives were found in 20
segments, mainly in segments 9, 10 and 13–15.
Discussion
Numerous studies have reported that multi-slice
helical CTA has advantages in diagnosing CAD (21–30).
Following the introduction of air-cushion suspension-bearing
technology in 256-slice spiral CT, friction and oscillation between
objects was dispelled, and this accelerated the rotary speed of the
ball tube. The fastest speed is 0.27 sec per circle, reducing the
acquisition time of circular cardiac data. Thus, the effect of HR
fluctuations and arrhythmia on image quality was reduced.
Furthermore, the scan range in the Z-axis direction was increased,
which was preferable for the imaging of the coronary artery and the
diagnosis of associated diseases.
The results of the present study showed that the
display rate of the coronary artery CTA, performed using a
256-slice multi-detector CT scanner, was 96.47%. The display rate
in each of the different HR groups was high, and rates were similar
among the groups. Certain segments of the coronary artery were not
shown by CTA, and this was primarily due to developmental
variations or abnormalities. Parts of the coronary artery branches
(circumflex artery or obtuse marginal branch and the second angular
branch) were absent or too small and so could not be filled with
contrast agent to aid with their visualization. The grading of the
images showed that while the number of images with a score of >1
point decreased with increasing HR, the left anterior descending
artery, circumflex branch of the left coronary artery and the right
coronary artery were still able to be satisfactorily diagnosed. No
statistically significant difference was found among the groups.
The segments in each group can meet the satisfaction of diagnosis,
achieving >95%. We therefore believe that 256-slice CTA can show
the main segments of the coronary arteries clearly and lead to a
satisfactory diagnosis.
Regarding the diagnosis of coronary artery stenosis,
the results of the present study showed that the specificity and
sensitivity of CTA were high. In each of the HR groups, ROC curve
analysis generated an Az value of >0.9, indicating a high
efficiency of 256-slice CTA for the diagnosis of coronary artery
stenosis. Although the Az value, specificity and sensitivity were
different in each group, the differences among the groups were not
statistically significant. This indicated that 256-slice CTA was
not limited by differences in HR and that imaging could be
performed without HR control, leading to a superior effect and a
more accurate diagnosis of coronary artery stenosis.
The results of the present study showed that there
were false positives in 28 segments and false negatives in 20
segments. A number of reasons for this were considered, based on
the results and the literature. Subjective factors are different
for the measurement of the narrow center and the normal reference
value of the differences between the selected. Objectively,
pathological segments of coarse or diffuse calcification will bring
certain of the artifacts. The calcified segments and the area
around the formation of parallel linear calcification, a slice of
low density, which was easily mistaken form filling defect caused
by plaque, and fuzzy edge of the residual lumen (31,32). In
particularly tortuous segments, the convolutions in the wall of the
coronary artery can cause the edges of those segments to be become
blurred, which can result in the degree of stenosis being
overestimated. Furthermore, in certain segments, the relatively
small lumen means that the scope and extent of any lesions present
can be easily underestimated. It is therefore imperative that, in
the post-coronary CTA processing, multi-dimensional observations
are performed from more than one angle and that the results are
combined with a cross-section of the original image, in order to
reduce incorrect analyses.
In conclusion, the present study has, to a certain
extent, illustrated that HR has no significant effect on the
accuracy of 256-slice coronary CTA in the diagnosis of coronary
artery stenosis; however, since the HR of all the patients in the
present study was within a certain range (39–107 bpm), further
study is required to evaluate whether HRs falling outside this
range would affect the evaluation of coronary segments using
CTA.
Acknowledgements
This study was financially supported by the Science
and Technology Plan Project, 2011 (no. 201110515001079; Dongguan,
China).
References
|
1
|
Higuchi K, Nagao M, Matsuo Y, Kamitani T,
Yonezawa M, Jinnouchi M, Yamasaki Y, Abe K, Baba S, Mukai Y, et al:
Evaluation of chronic ischemic heart disease with myocardial
perfusion and regional contraction analysis by contrast-enhanced
256-MSCT. Jpn J Radiol. 31:123–132. 2013. View Article : Google Scholar : PubMed/NCBI
|
|
2
|
Rossi Pesenti D, Caussin C, Baron N,
Fourme T and Livarek B: Coronary graft angioplasty guided by MSCT:
An unexpected ostial stent deformation. Eur Heart J Cardiovasc
Imaging. 14:3082013. View Article : Google Scholar : PubMed/NCBI
|
|
3
|
Iino R, Yokoyama N, Konno K, Naito K and
Isshiki T: Impact of combined assessment of coronary artery calcium
score, carotid artery plaque score, and brachial-ankle pulse wave
velocity for early coronary revascularization in patients with
suspected coronary artery disease. Int Heart J. 53:154–159. 2012.
View Article : Google Scholar : PubMed/NCBI
|
|
4
|
Shelley S, Indirani M, Sathyamurthy I,
Subramanian K, Priti N, Harshad K and Padma D: Correlation of
myocardial perfusion SPECT with invasive and computed tomography
coronary angiogram. Indian Heart J. 64:43–49. 2012. View Article : Google Scholar : PubMed/NCBI
|
|
5
|
Rafiq S, Johansson PI, Zacho M, Stissing
T, Kofoed K, Lilleør NB and Steinbrüchel DA: Thrombelastographic
haemostatic status and antiplatelet therapy after coronary artery
bypass surgery (TEG-CABG trial): assessing and monitoring the
antithrombotic effect of clopidogrel and aspirin versus aspirin
alone in hypercoagulable patients: study protocol for a randomized
controlled trial. Trials. 13:482012. View Article : Google Scholar : PubMed/NCBI
|
|
6
|
Seng K, Breuckmann F, Schlosser T,
Barkhausen J, Geckeis K, Budde T, Hoefs C, Schmermund A, Erbel R
and Ladd SC: Concomitant atherosclerotic disease detected by
whole-body MR angiography in relation to coronary artery
calcification in patients with coronary artery disease. RoFo
Fortschr Geb Rontgenstr Nuklearmed. 182:334–340. 2010. View Article : Google Scholar : PubMed/NCBI
|
|
7
|
van Werkhoven JM, Heijenbrok MW, Schuijf
JD, Jukema JW, van der Wall EE, Schreur JH and Bax JJ: Combined
non-invasive anatomical and functional assessment with MSCT and MRI
for the detection of significant coronary artery disease in
patients with an intermediate pre-test likelihood. Heart.
96:425–431. 2010. View Article : Google Scholar : PubMed/NCBI
|
|
8
|
Bonello L, Armero S, Jacquier A, Com O,
Sarran A, Sbragia P, Panuel M, Arques S and Paganelli F:
Non-invasive coronary angiography for patients with acute atypical
chest pain discharged after negative screening including maximal
negative treadmill stress test. A prospective study. Int J Cardiol.
134:140–143. 2009. View Article : Google Scholar : PubMed/NCBI
|
|
9
|
Yoshida H, Yokoyama K, Maruvama Y,
Yamanoto H, Yoshida S and Hosoya T: Investigation of coronary
artery calcification and stenosis by coronary angiography (CAG) in
haemodialysis patients. Nephrol Dial Transplant. 21:1451–1452.
2006. View Article : Google Scholar : PubMed/NCBI
|
|
10
|
Hersberger M, Muntwyler J, Funke H,
Marti-Jaun J, Schulte H, Assmann G, Lüscher TF and von Eckardstein
A: The CAG repeat polymorphism in the androgen receptor gene is
associated with HDL-cholesterol but not with coronary
atherosclerosis or myocardial infarction. Clin Chem. 51:1110–1115.
2005. View Article : Google Scholar : PubMed/NCBI
|
|
11
|
Klass O, Walker M, Siebach A, Stuber T,
Feuerlein S, Juchems M and Hoffmann MH: Prospectively gated axial
CT coronary angiography: Comparison of image quality and effective
radiation dose between 64- and 256-slice CT. Eur Radiol.
20:1124–1131. 2010. View Article : Google Scholar : PubMed/NCBI
|
|
12
|
Budoff MJ, Achenbach S, Blumenthal RS,
Carr JJ, Goldin JG, Greenland P, Guerci AD, Lima JA, Rader DJ,
Rubin GD, et al: American Heart Association Committee on
Cardiovascular Imaging and Intervention; American Heart Association
Council on Cardiovascular Radiology and Intervention; American
Heart Association Committee on Cardiac Imaging, Council on Clinical
Cardiology: Assessment of coronary artery disease by cardiac
computed tomography: A scientific statement from the American Heart
Association Committee on Cardiovascular Imaging and Intervention,
Council on Cardiovascular Radiology and Intervention, and Committee
on Cardiac Imaging, Council on Clinical Cardiology. Circulation.
114:1761–1791. 2006. View Article : Google Scholar : PubMed/NCBI
|
|
13
|
No authors listed: Expert consensus
document of Chinese Journal of Radiology on clinical applications
of cardiac and coronary artery imaging by multidetector row CT.
Zhong Hua Fang She Xue Za Zhi. 45:9–17. 2011.(In Chinese).
|
|
14
|
Sun Z: Multislice CT angiography in
coronary artery disease: Technical developments, radiation dose and
diagnostic value. World J Cardiol. 2:333–343. 2010. View Article : Google Scholar : PubMed/NCBI
|
|
15
|
Caussin C, Ohanessian A, Lancelin B, Rahal
S, Hennequin R, Dambrin G, Brenot P, Angel CY and Paul JF: Coronary
plaque burden detected by multislice computed tomography after
acute myocardial infarction with near-normal coronary arteries by
angiography. Am J Cardiol. 92:849–852. 2003. View Article : Google Scholar : PubMed/NCBI
|
|
16
|
Meijboom WB, Meijs MF, Schuijf JD, Cramer
MJ, Mollet NR, van Mieghem CA, Nieman K, van Werkhoven JM,
Pundziute G, Weustink AC, et al: Diagnostic accuracy of 64-slice
computed tomography coronary angiography: A prospective,
multicenter, multivendor study. J Am Coll Cardiol. 52:2135–2144.
2008. View Article : Google Scholar : PubMed/NCBI
|
|
17
|
Pontone G, Andreini D, Bartorelli AL,
Cortinovis S, Mushtaq S, Bertella E, Annoni A, Formenti A, Nobili
E, Trabattoni D, et al: Diagnostic accuracy of coronary computed
tomography angiography: A comparison between prospective and
retrospective electrocardiogram triggering. J Am Coll Cardiol.
54:346–355. 2009. View Article : Google Scholar : PubMed/NCBI
|
|
18
|
Hong C, Becker CR, Huber A, Schoepf UJ,
Ohnesorge B, Knez A, Brüning R and Reiser MF: ECG-gated
reconstructed multi-detector row CT coronary angiography: Effect of
varying trigger delay on image quality. Radiology. 220:712–717.
2001. View Article : Google Scholar : PubMed/NCBI
|
|
19
|
Utsunomiya D, Weigold WG, Weissman G and
Taylor AJ: Effect of hybrid iterative reconstruction technique on
quantitative and qualitative image analysis at 256-slice
prospective gating cardiac CT. Eur Radiol. 22:1287–1294. 2012.
View Article : Google Scholar : PubMed/NCBI
|
|
20
|
Eiber M, Holzapfel K, Frimberger M, Straub
M, Schneider H, Rummeny EJ, Dobritz M and Huber A: Targeted
dual-energy single-source CT for characterisation of urinary
calculi: Experimental and clinical experience. Eur Radiol.
22:251–258. 2012. View Article : Google Scholar : PubMed/NCBI
|
|
21
|
Muenzel D, Noel PB, Dorn F, Dobritz M,
Rummeny EJ and Huber A: Step and shoot coronary CT angiography
using 256-slice CT: Effect of heart rate and heart rate variability
on image quality. Eur Radiol. 21:2277–2284. 2011. View Article : Google Scholar : PubMed/NCBI
|
|
22
|
Zhang G, Cheng GX, Liu Z, Zhang J, Hou YQ,
Zheng H and Cui K: Diagnostic value of dual-source CT coronary
angiography in detecting coronary stenosis. Zhong Guo Yi Xue Ying
Xiang Xue Za Zhi. 18:348–352. 2010.(In Chinese).
|
|
23
|
Mao DB, Hua YQ, Zhang GZ, Wang MP, Wu WI,
Hu F, Ding QY and Ge XJ: Accuracy of evaluating coronary soft
plaque by multi-slice CT. Zhong Hua Fang She Xue Za Zhi.
40:722–725. 2006.(In Chinese).
|
|
24
|
Lv Z, Zhang ZZ, Zhou XH, Wang X, Zhang B,
Zhao L, Yang L, Wang Z and Zhang T: Diagnostic accuracy of
64-detector row CT in coronary artery stenosis caused by calcified
coronary artery plaques: A multicenter study. Zhong Guo Yi Xue Ying
Xiang Ji Shu. 26:674–678. 2010.(In Chinese).
|
|
25
|
Fu YC, Wei L and Guo Y: Application of 256
slice CT prospective and retrospective ECG-gated coronary
angiography. J Clin Radiol. 29:1192–1195. 2010.
|
|
26
|
Budde RP, Krings GJ and Leiner T:
Prospectively ECG-triggered 256-slice computed tomography findings
in a patient with dextrocardia, stent-treated coarctation, and
infracardial right-sided pulmonary vein deviation. Eur Heart J.
32:12132011. View Article : Google Scholar : PubMed/NCBI
|
|
27
|
Bardo DM, Asamato J, Mackay CS and Minette
M: Low-dose coronary artery computed tomography angiogram of an
infant with tetralogy of fallot using a 256-slice multidetector
computed tomography scanner. Pediatr Cardiol. 30:824–826. 2009.
View Article : Google Scholar : PubMed/NCBI
|
|
28
|
Efstathopoulos EP, Kelekis NL, Pantos I,
Brountzos E, Argentos S, Grebác J, Ziaka D, Katritsis DG and
Seimenis I: Reduction of the estimated radiation dose and
associated patient risk with prospective ECG-gated 256-slice CT
coronary angiography. Phys Med Biol. 54:5209–5222. 2009. View Article : Google Scholar : PubMed/NCBI
|
|
29
|
Korosoglou G, Mueller D, Lehrke S, Steen
H, Hosch W, Heye T, Kauczor HU, Giannitsis E and Katus HA:
Quantitative assessment of stenosis severity and atherosclerotic
plaque composition using 256-slice computed tomography. Eur Radiol.
20:1841–1850. 2010. View Article : Google Scholar : PubMed/NCBI
|
|
30
|
Hsiao EM, Rybicki FJ and Steigner M: CT
coronary angiography: 256-slice and 320-detector row scanners. Curr
Cardiol Rep. 12:68–75. 2010. View Article : Google Scholar : PubMed/NCBI
|
|
31
|
Pugliese F, Mollet NR, Runza G, van
Mieghem C, Meijboom WB, Malagutti P, Baks T, Krestin GP, de Feyter
PJ and Cademartiri F: Diagnostic accuracy of non-invasive 64-slice
CT coronary angiography in patients with stable angina pectoris.
Eur Radiol. 16:575–582. 2006. View Article : Google Scholar : PubMed/NCBI
|
|
32
|
Plass A, Grünenfelder J, Leschka S,
Alkadhi H, Eberli FR, Wildermuth S, Zünd G and Genoni M: Coronary
artery imaging with 64-slice computed tomography from cardiac
surgical perspective. Eur J Cardiothorac Surg. 30:109–116. 2006.
View Article : Google Scholar : PubMed/NCBI
|