Introduction
Preeclampsia (PE) is a severe pregnancy
complication, characterized by hypertension and large amounts of
urine protein (1). PE increases the
risk of red blood cell breakdown, impaired liver function and
kidney dysfunction (2,3). According to the World Health
Organization, approximately 2–8% of pregnancies are affected by PE
worldwide (4). Additionally, ~29,000
cases of mortality were reported in 2013 (5). However, a specific treatment for PE and
methods for its early diagnosis or prediction have not been
adequately developed. Therefore, understanding the molecular
mechanisms underlying PE is essential.
PE is know to be associated with the dysregulation
of susceptibility genes. Recently, the molecular mechanism and
therapy of PE has been investigated in a number of studies. For
instance, Yong et al (6) have
demonstrated that several susceptibility genes, including inhibin β
A, angiotensinogen, interleukin-6, interferon and transforming
growth factor β1 genes, serve an important role in the development
and progression of PE through apoptosis and cell signaling.
Similarly, expression of fms-like tyrosine kinase-1 and kinase
insert domain containing receptor has been reported to contribute
to the pathogenesis of PE (7,8). A
previous study has also indicated that the increased level of
vascular endothelial growth factor may be an important mechanism
underlying PE via regulating angiogenesis and blood flow (9). Furthermore, Long et al (10) have suggested that inactivating
killer-cell immunoglobulin-like receptors may affect the risk of PE
possibly by lowering the activation of uterine natural killer
cells. The gene V-set and immunoglobulin domain containing 4 has
been identified to be upregulated in the peripheral blood
mononuclear cells from PE patients (11). However, PE is a multi-system disorder
and its underlying molecular mechanism remains unclear.
Currently, microarray analysis is widely utilized to
study the development and progression of various diseases, as well
as to determine the underlying biomarkers of diseases, due to the
lower expense and advancements in this technique (12). The gene profile dataset E-GEOD-6573
established by Herse et al (13) screened differentially expressed genes
(DEGs) from PE and control tissue samples, based on the presence of
a 4-fold change in gene expression. The identification of DEGs and
Gene Ontology (GO) functional annotation of PE and control samples
are also performed in the gene profile dataset of E-GEOD-48424
provided by Textoris et al (14).
In the present study, the differential expression
network (DEN) strategy was employed to trace the dysfunctional
interactions associated with the development and progression of PE
(15). DEN is a novel network that
includes differential genes and networks, and also covers
non-differential interactions associated with the disease, which
are not considered in the differential network (15). In order to obtain further insight
into the mechanism underlying PE development and progression, two
gene expression microarray datasets of PE were downloaded from the
European Bioinformatics Institute (EMBL-EBI) database and merged,
followed by the identification of DEGs. In addition, DENs were
constructed by screening the differential interactions and
non-differential interactions. Subsequently, hub genes and disease
genes were extracted from the DEN. GO and pathway enrichment
analysis were also conducted for the genes in DEN. The results
suggest that hub genes and disease genes identified in the present
study provide a theoretical basis for the treatment of PE.
Materials and methods
Microarray data
In total, two microarray datasets were downloaded
from the EMBL-EBI database, including the E-GEOD-6573 (13) and E-GEOD-48424 datasets (14). Gene expression data from E-GEOD-6573,
containing abdominal adipose, muscle and placenta samples from 10
PE women and 10 women with uneventful pregnancies, were obtained
using the GPL570 platform of Affymetrix Human Genome U133 Plus 2.0
Array (Affymetrix, Inc., Santa Clara, CA, USA). The microarray data
of E-GEOD-48424 included 19 PE samples and 19 normal pregnancy
tissue samples and were obtained based on the GPL6480 platform of
Agilent-014850 Whole Human Genome Microarray 4×44 K G4112F (Agilent
Technologies, Santa Clara, CA, USA).
Data preprocessing
Prior to analysis, the expresso function of the Affy
package (16) was used to preprocess
the gene profile data of E-GEOD-6573. The specific steps of the
preprocessing were as follows: The ‘rma’ function (17) was applied to perform background
correction, and then normalization was performed using the quartile
function in order to eliminate the influence of nonspecific
hybridization (18). Subsequently,
the perfect match probe correction was performed via MAS (19), followed by the expression summary
through median polish. AffyBatch data were converted into
expression measurements and the featureFilter function was then
utilized to filter the data for removing the redundant and
irrelevant features. Finally, the probe sets were aligned to the
genes using the getSymbol function.
Simultaneously, processed data and the gene
annotation file of E-GEOD-48424 were downloaded. Subsequently, the
probe sets were mapped to the genes using the ‘getSymbol’ function
in Package ‘annotate’ (version 1.49.1; http://www.bioconductor.org/).
Identification of DEGs in PE
In the analysis performed in the present study, the
merge function from Package ‘inSilicoMerging’ (version 1.10.1;
https://www.bioconductor.org/packages/release/bioc/html/inSilicoMerging.html)
was used to merge the two microarray datasets into one global
dataset, in order to further obtain a merged data set by means of
the geNorm normalization method (20). Next, Significant Analysis of
Microarrays (R package; version 1.25; https://www.r-project.org/) was used to identify DEGs
in the PE samples relative to normal samples (21). The Benjamini-Hochberg approach
(22) was employed to adjust the raw
P-value into the false discovery rate (FDR). Several genes were
considered as DEGs when the |log2 fold change| was >2, and the
FDR was <0.05.
Construction of protein-protein
interactions (PPI) network
Initially, all human PPIs, involving 15,750 genes
and 248,584 interactions were downloaded from the Biological
General Repository for Interaction Datasets (BioGrid; http://thebiogrid.org/) database. Subsequently, all
genes of the two microarray datasets used in the present study were
aligned to the compiled PPI network to filter several unnecessary
interactions. A total of 9,427 genes with 151,836 interactions were
selected.
Spearman's correlation coefficient
calculation
In the current study, Spearman's correlation
coefficient was calculated to determine the interactions among
genes. Subsequent to obtaining gene expression values between
normal and PE samples, Spearman's correlation coefficient was
calculated for the 151,836 interactions in different conditions,
which were represented by the normal and PE samples, named as A1
and A2, respectively. Similarly, the absolute value of the
difference in the Spearman's correlation coefficient between the
two groups, defined as |A1-A2|, was also calculated.
Construction of DEN
Two PPI models were randomly constructed (one for
normal samples and the other for PE samples) to select gene
interactions for subsequent analysis, with 500,000 gene
interactions present in each model. Next, the Spearman's
correlation coefficients of the interactions in the two PPI models
(A1 and A2) were computed, and |A1-A2| was also calculated.
Subsequently, |A1-A2| was ranked in descending order, and |A1-A2|
was found to be 0.548 when the P value was 0.05. A differential
interaction was considered in cases where the |A1-A2| value was
>0.548 and at least one of A1 and A2 was >0.7. By contrast,
if the |A1-A2| value of a gene interaction was ≤0.548 and two
corresponding nodes (linked genes or coded proteins) were both
DEGs, the edge was regarded as a non-differential interaction. The
DEN was then constructed by incorporating all the differential and
non-differential interactions.
Identifying the disease genes
associated with PE in the DEN
The PE-associated genes (regarded as disease genes)
were obtained from the GeneCards database (www.genecards.org). Only those genes whose expressions
were examined in the DEN were selected in the present study.
Centrality analysis
The measures of centrality are broadly applied in
network analysis, and include the degree, closeness, betweenness
and Eigenvector centrality (23).
Among these, the degree is the simplest indicator of centrality.
Degree is defined as the number of links that a node has with other
nodes (24). In the present study,
the degree distribution was examined and the nodes with the top 1%
degrees of centrality were identified as the hub genes.
Functional enrichment analysis for the
genes in DEN
The GO database (www.geneontology.org) frequently provides biological
information on large-scale genes (25). In addition, the Kyoto Encyclopedia of
Genes and Genomes (KEGG; www.genome.jp/kegg) is a bioinformatics database that
includes a variety of biochemistry pathways (26), while the Database for Annotation,
Visualization and Integrated Discovery (DAVID; http://david.abcc.ncifcrf.gov/) is an analytic
tool used in the determination of the biological meaning for a
large number of genes (27). In the
current study, DAVID was applied for GO functional annotation and
KEGG pathway enrichment analysis of genes in the DEN. The
expression analysis systematic explorer test was applied to assess
the significant categories. Significant enrichment was determined
based on the presence of at least two target genes and a P-value of
<0.01 in the GO and pathways.
Results
Microarray data analysis
A total of 20,102 and 18,411 genes were identified
in the gene expression data of E-GEOD-6573 and E-GEOD-48424,
respectively. Furthermore, a total of 11,269 genes were obtained
subsequent to merging. Microarray analysis identified 225 genes as
DEGs, including 9 upregulated and 216 downregulated genes.
DEN construction
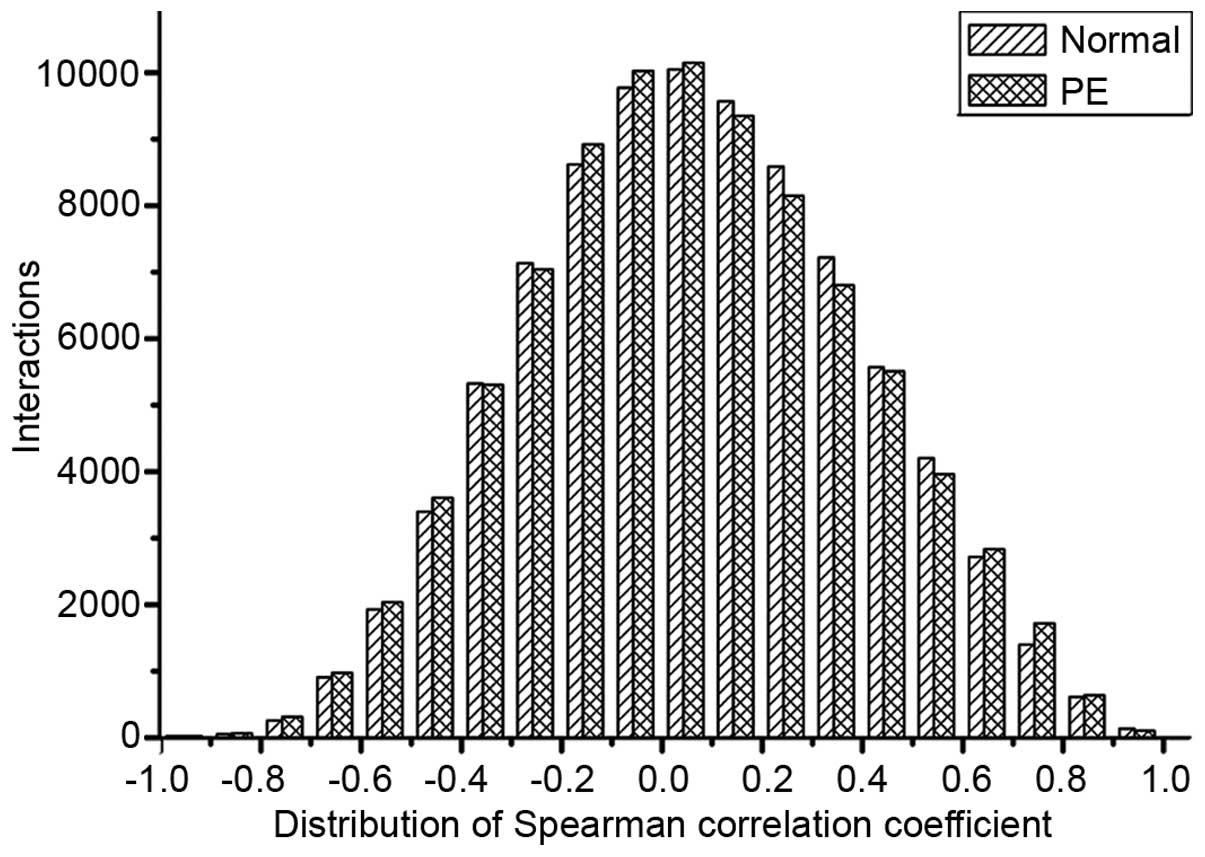
The distribution of Spearman's correlation
coefficient of interactions for the normal and PE conditions is
exhibited in Fig. 1. The mean
Spearman's correlation coefficients were found to be 0.0688 and
0.0640 in the normal and PE groups, respectively. A decrease was
identified in Spearman's correlation coefficient distribution
(0.1–0.6) of 33,653 interactions in the PE network relative to
35,035 interactions in the normal network. By contrast, an increase
in Spearman's correlation coefficient distribution (−0.2 to 0.1) of
interactions in PE (29,019 interactions) relative to those in the
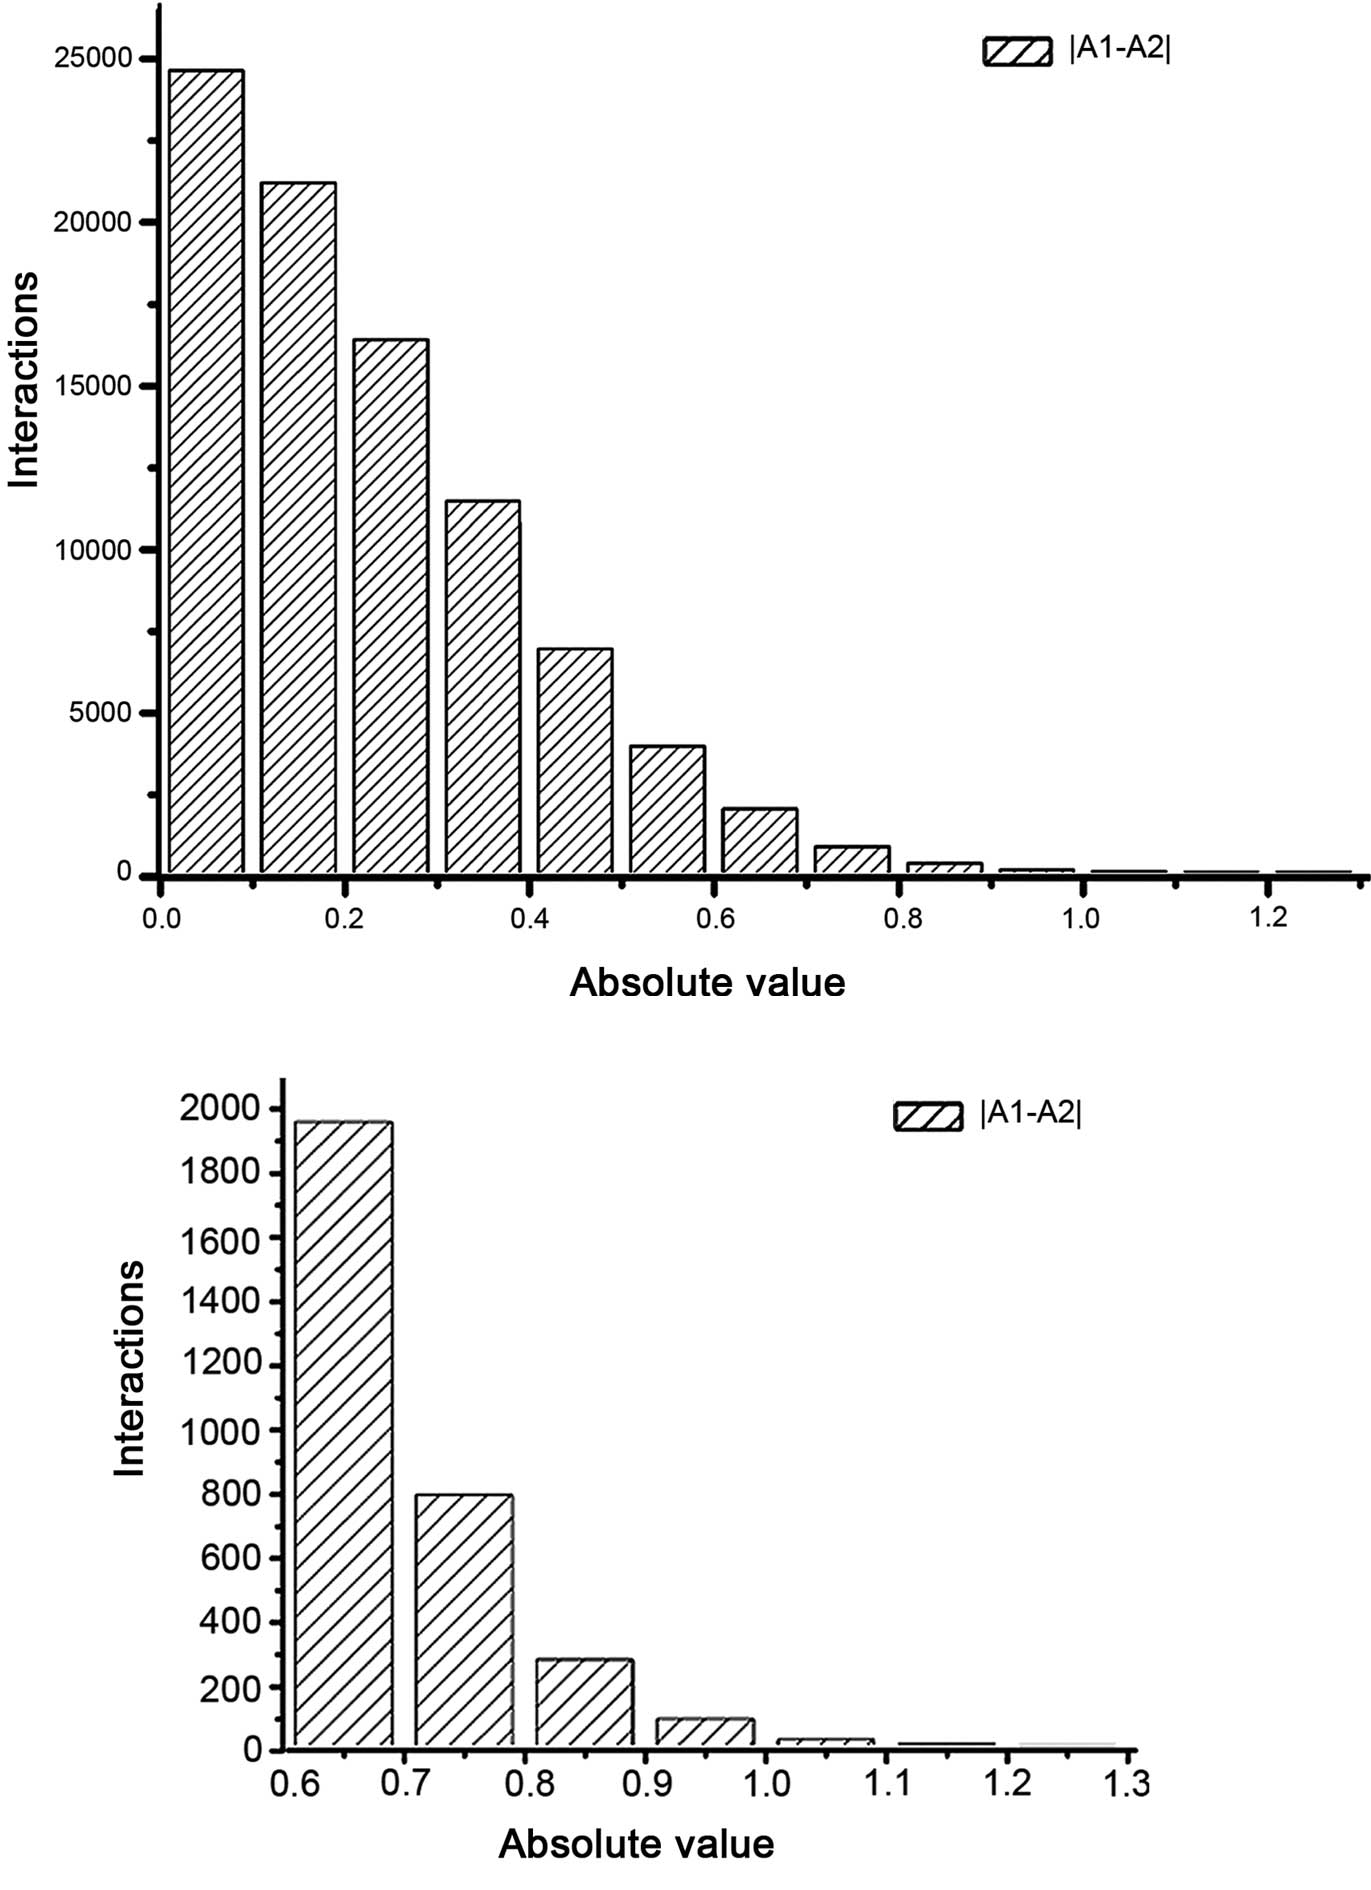
normal network (28,406 interactions) was observed. Next, the
|A1-A2| distribution of interactions for these two groups was
calculated (Fig. 2). A total of 283
differential interactions were identified, with a |A1-A2| of
>0.548, as well as at least one of the A1 and A2 values being
>0.7. Furthermore, 31 non-differential interactions were
observed in edges with |A1-A2| of ≤0.548 and DEGs in two
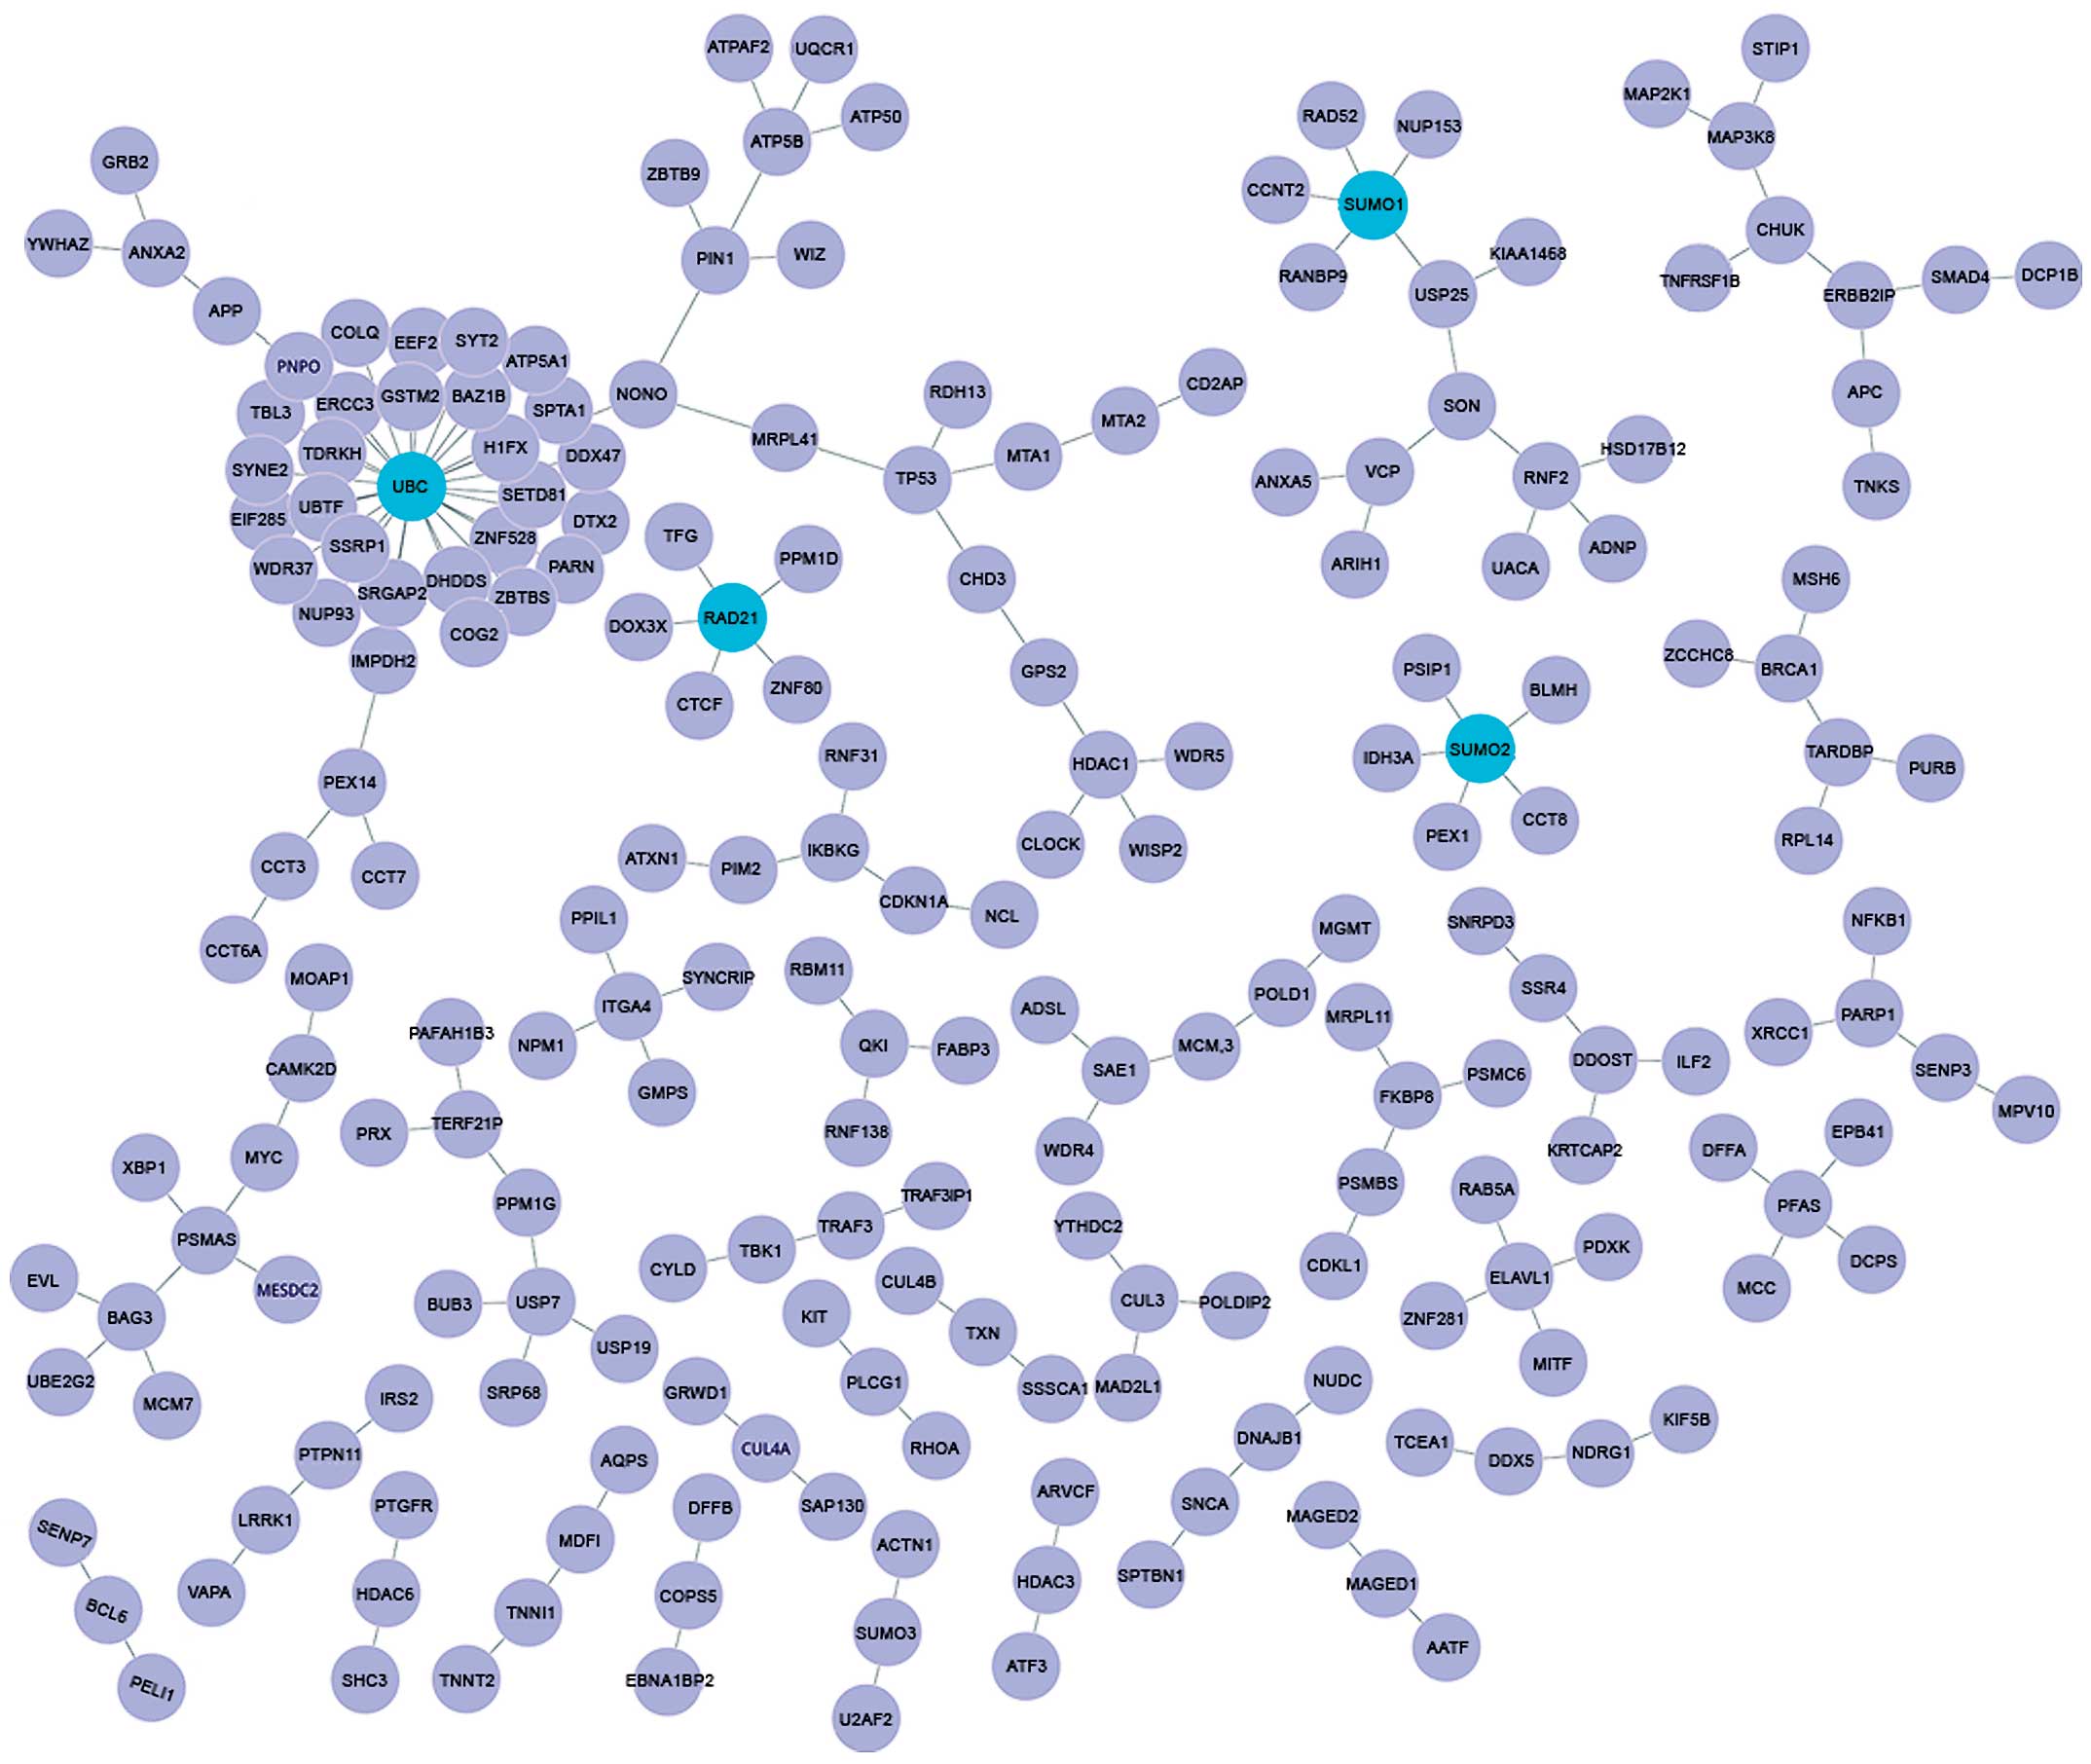
corresponding nodes. Hence, a total of 466 nodes and 314 gene
interactions were involved in the DEN. Fig. 3 shows the detailed main network.
Identifying the disease genes
associated with PE in DEN
In total, 20 disease genes with 55 differential
interactions were identified. Among those 20 disease genes,
ubiquitin C (UBC) was found to possess the highest connectivity
degree (degree, 29).
Centrality analysis
Among the 466 nodes in the DEN, 4 nodes presented
centrality degrees in the top 1%, as shown in Table I. These nodes involved the following
genes: UBC (degree, 29), small ubiquitin-like modifier 2
(SUMO2; degree, 5), SUMO1 (degree, 5), RAD21 homolog
(S. pombe) (RAD21; degree, 5).
 | Table I.Genes with the top 1% degrees of
centrality in the differential expression network. |
Table I.
Genes with the top 1% degrees of
centrality in the differential expression network.
| Gene symbol | Centrality
degree |
|---|
| UBC | 29 |
| SUMO2 | 5 |
| SUMO1 | 5 |
| RAD21 | 5 |
GO functional annotation and KEGG
enrichment analysis of genes in the DEN
Based on the presence of <2 target genes and
P<0.01, as shown in Table II,
the significant functions in the biological process (BP) term of GO
included negative regulation of macromolecule metabolic process,
regulation of programmed cell death, regulation of apoptosis and
cell cycle, while significant functions in the cellular component
(CC) term included the chromosomal part, nuclear and organelle
lumen. More specifically, UBC, a disease and hub gene, was
significantly involved in the regulation of programmed cell death,
as well as in the regulation of apoptosis in the BP. Genes such as
SUMO2 and SUMO1 were mainly involved in the
chromosome and chromosomal part in the CC.
| Table II.Top 10 BP and CC terms of GO
functional annotation of genes in the differential expression
network. |
Table II.
Top 10 BP and CC terms of GO
functional annotation of genes in the differential expression
network.
| Term | Term name | Count | P-value |
|---|
| GO-BP | Negative regulation
of macromolecule metabolic process | 72 |
2.32×10⁻¹⁸ |
| GO-BP | Regulation of
programmed cell death | 74 |
4.07×10⁻¹⁷ |
| GO-BP | Regulation of cell
death | 74 |
4.96×10⁻¹⁷ |
| GO-BP | Regulation of
apoptosis | 73 |
8.50×10⁻¹⁷ |
| GO-BP | Cell cycle | 66 |
1.09×10⁻¹³ |
| GO-BP | Ubiquitin-dependent
protein catabolic process | 34 |
5.84×10⁻¹³ |
| GO-BP | Response to DNA
damage stimulus | 41 |
5.26×10⁻¹² |
| GO-BP | Negative regulation
of molecular function | 38 |
1.33×10⁻¹¹ |
| GO-BP | Cellular response
to stress | 51 |
1.53×10⁻¹¹ |
| GO-BP | Negative regulation
of nucleobases | 48 |
1.77×10⁻¹¹ |
| GO-CC | Nuclear lumen | 125 |
1.01×10⁻³⁰ |
| GO-CC | Organelle
lumen | 140 |
9.76×10⁻³⁰ |
| GO-CC | Intracellular
organelle lumen | 138 |
1.31×10⁻²⁹ |
| GO-CC | Membrane-enclosed
lumen | 140 |
7.65×10⁻²⁹ |
| GO-CC | Nucleoplasm | 90 |
1.82×10⁻²⁶ |
| GO-CC | Non-membrane-bound
organelle | 151 |
1.29×10⁻¹⁹ |
| GO-CC | Intracellular
non-membrane-bound organelle | 151 |
1.29×10⁻¹⁹ |
| GO-CC | Chromatin
remodeling complex | 43 |
3.72×10⁻¹¹ |
| GO-CC | Chromosomal
part | 37 |
5.73×10⁻¹⁰ |
| GO-CC | Ribonucleoprotein
complex | 42 |
4.05×10⁻⁹ |
Notably, 27 pathways were obtained using KEGG
analysis. The top 10 pathways are presented in Table III. Among these, the most
significant pathway was found to be chronic myeloid leukemia. Other
significant pathways included the neurotrophin signaling pathway,
pathways in cancer and cell cycle. DEGs, including RAD21,
participated in the determined pathway, such as in the cell
cycle.
| Table III.Top 10 KEGG pathways of genes in the
differential expression network. |
Table III.
Top 10 KEGG pathways of genes in the
differential expression network.
| Term name | Count | P-value |
|---|
| Chronic myeloid
leukemia | 19 |
7.04×10⁻¹⁰ |
| Neurotrophin
signaling pathway | 22 |
2.22×10⁻⁸ |
| Pathways in
cancer | 35 |
3.64×10⁻⁷ |
| Acute myeloid
leukemia | 14 |
4.27×10⁻⁷ |
| Prostate
cancer | 16 |
2.67×10⁻⁶ |
| Cell cycle | 19 |
2.81×10⁻⁶ |
| Spliceosome | 19 |
3.16×10⁻⁶ |
| Adipocytokine
signaling pathway | 13 |
1.45×10⁻⁵ |
| RIG-I-like receptor
signaling pathway | 13 |
2.67×10⁻⁵ |
| ErbB signaling
pathway | 14 |
4.79×10⁻⁵ |
Discussion
In order to clarify the molecular mechanisms
underlying PE development, we comprehensively analyzed the gene
expression profiles in the E-GEOD-6573 and E-GEOD-48424 datasets
using DEN analysis. A total of 225 DEGs were selected from the PE
samples, and the hub genes were found to be UBC,
RAD21, SUMO2 and SUMO1, since they had higher
connectivity degrees in the DEN. Furthermore, UBC,
RAD21, SUMO2 and SUMO1 were markedly enriched
in the regulation of programmed cell death, as well as in the
regulation of apoptosis, cell cycle and chromosomal part.
The molecular network is characterized by the
intricate interactions that regulate gene expression and cellular
functions, thus playing an important role in disease development
and progression (28,29). The PPI and gene regulatory networks
have been developed to identify available genes on the basis of
biomolecular networks (30,31). Nevertheless, several genes may be
ignored if their expression is not found to be highly associated
across the entire dataset (32). On
the contrary, DEN is a novel network that not only includes
differential genes and networks, but also covers non-differential
interactions associated with disease, which are not considered in
differential networks (14).
Furthermore, a previous study has demonstrated that DEN analysis
may obtain 3–4 times more known disease genes compared with the
traditional DEG method (15). For
instance, the disease gene UBC identified in the current
study was not a DEG, and thus would have not been identified by the
traditional DEG method. Accordingly, the present results suggest
that DEN can fully extract disease genes and interactions more
accurately.
In the present study, we found that UBC was a
disease gene, and was involved in the regulation of programmed,
cell death, as well as in the regulation of apoptosis in the BP of
GO. It is well documented that increased trophoblast cell apoptosis
is a typical characteristic of PE placenta (33,34).
Dysregulation of ubiquitin-proteasome system is related with the
gestational trophoblast disorder (35,36).
Notably, the UBC gene encodes protein products required to further
generate free ubiquitin in eukaryotes (37). Furthermore, Kugawa and Aoki (37) have reported that UBC promoter
regulates to various types of stress, for example, pro-apoptotic
stimulus. Thus, we hypothesize that the UBC-mediated
apoptotic mechanism of PE through regulation of the
ubiquitin-proteasome system is greatly significant.
The abnormal placenta formation is known to be the
first stage of PE (38), and
placental trophoblast cells have abnormal cell cycle mechanisms
(39). Unek et al (40) have also indicated that placental
alterations of PE may be connected to the cell cycle arrest. In the
current study, the cell cycle pathway was identified, which is an
important pathway, involving the RAD21 gene that was
downregulated. RAD21, as a subunit of a cohesion complex, holds
sister chromatids together during the late stage of cell division.
Notably, the cohesion of sister chromatid in the period of DNA
replication serves a crucial role in the cell cycle of eukaryote
(41). Furthermore, Wong and Blobel
have indicated that RAD21 is localized at mitotic spindles
(42), whereas another study has
demonstrated that RAD21 serves a vital role in the
transition of phase S to G2 (43).
Similarly, in an RNA-sequencing analysis associated with colorectal
cancer, the underexpression of RAD21 was found to impair the
assembly of spindle or delay the progression of the S phase
(44,45). Based on the aforementioned results,
it is suggested that RAD21 may affect the risk of PE
development through the regulation of cell cycle.
SUMO2 and SUMO1 are two members of
SUMO proteins, which are small ubiquitin-associated modifiers and
regulate multiple cellular processes including DNA repair (46). Chromosomal DNA damage in pregnancy
may be a basic pathological feature of PE, and reducing DNA damage
may improve the health of the mother and the baby (47). In addition, the changes of placental
SUMOylation pathway and free SUMOs may contribute to the
etiopathogenesis of severe PE due to abnormal expression of
UBC9 (48). Emerging evidence
indicated that UBC9-mediated SUMOylation is helpful in
maintaining the genome integrity of replicating chromosomes
(49). Consistent with this
observation, the function annotation exhibited that SUMO2
and SUMO1 were significantly enriched in the chromosome and
chromosomal part GO terms. In light of all the aforementioned
findings, it can be concluded that SUMO2 and SUMO1
may serve an important role in PE progression via the
aforementioned functions.
In conclusion, UBC, RAD21,
SUMO2, SUMO1 and their enriched functions in the
regulation of programmed cell death, regulation of apoptosis, cell
cycle and chromosomal part may exert important roles in the
development and progression of PE. Therefore, they may be employed
as potential therapeutic target in the treatment of PE and enhance
the clinical therapeutic efficacy in the future. Nevertheless,
these hypotheses require confirmation using animal experiments in
further studies.
References
|
1
|
Eiland E, Nzerue C and Faulkner M:
Preeclampsia 2012. J Pregnancy. 2012:5865782012. View Article : Google Scholar : PubMed/NCBI
|
|
2
|
Al-Jameil N, Aziz Khan F, Fareed Khan M
and Tabassum H: A brief overview of preeclampsia. J Clin Med Res.
6:1–7. 2014.PubMed/NCBI
|
|
3
|
American College of Obstetricians
Gynecologists. Task Force on Hypertension in Pregnancy:
Hypertension in pregnancy. Report of the American college of
obstetricians and gynecologists' task force on hypertension in
pregnancy. Obstet Gynecol. 122:1122–1131. 2013.PubMed/NCBI
|
|
4
|
World Health Organization: WHO
recommendations for prevention and treatment of preeclampsia and
eclampsia. World Health Organization. Geneva: 2011.
|
|
5
|
GBD 2013 Mortality and Causes of Death
Collaborators: Global, regional and national age-sex specifi c
all-cause and cause-specifi c mortality for 240 causes of death,
1990–2013: A systematic analysis for the Global Burden of Disease
Study 2013. The Lancet. 385:117–171. 2015. View Article : Google Scholar
|
|
6
|
Yong HE, Melton PE, Johnson MP, Freed KA,
Kalionis B, Murthi P, Brennecke SP, Keogh RJ and Moses EK: [81-OR]:
Genome-wide transcriptome directed pathway analysis of maternal
preeclampsia susceptibility genes. Pregnancy Hypertens. 5:43–44.
2015.
|
|
7
|
Munaut C, Lorquet S, Pequeux C, Coulon C,
Le Goarant J, Chantraine F, Noël A, Goffin F, Tsatsaris V, Subtil D
and Foidart JM: Differential expression of VEGFR-2 and its soluble
form in preeclampsia. PloS One. 7:e334752012. View Article : Google Scholar : PubMed/NCBI
|
|
8
|
Tripathi R, Rath G, Jain A and Salhan S:
Soluble and membranous vascular endothelial growth factor
receptor-1 in pregnancies complicated by pre-eclampsia. Ann Anat.
190:477–489. 2008. View Article : Google Scholar : PubMed/NCBI
|
|
9
|
Sundrani DP, Reddy US, Joshi AA, Mehendale
SS, Chavan-Gautam PM, Hardikar AA, Chandak GR and Joshi SR:
Differential placental methylation and expression of VEGF, FLT-1
and KDR genes in human term and preterm preeclampsia. Clin
Epigenetics. 5:62013. View Article : Google Scholar : PubMed/NCBI
|
|
10
|
Long W, Shi Z, Fan S, Liu L, Lu Y, Guo X,
Rong C, Cui X and Ding H: Association of maternal KIR and fetal
HLA-C genes with the risk of preeclampsia in Chinese Han
population. Placenta. 36:433–437. 2015. View Article : Google Scholar : PubMed/NCBI
|
|
11
|
Sun CJ, Zhang L and Zhang WY: Gene
expression profiling of maternal blood in early onset severe
preeclampsia: Identification of novel biomarkers. J Perinat Med.
37:609–616. 2009.PubMed/NCBI
|
|
12
|
Nakanishi T, Oka T and Akagi T: Recent
advances in DNA microarrays. Acta Med Okayama. 55:319–328.
2001.PubMed/NCBI
|
|
13
|
Herse F, Dechend R, Harsem NK, Wallukat G,
Janke J, Qadri F, Hering L, Muller DN, Luft FC and Staff AC:
Dysregulation of the circulating and tissue-based renin-angiotensin
system in preeclampsia. Hypertension. 49:604–611. 2007. View Article : Google Scholar : PubMed/NCBI
|
|
14
|
Textoris J, Ivorra D, Ben Amara A,
Sabatier F, Ménard JP, Heckenroth H, Bretelle F and Mege JL:
Evaluation of current and new biomarkers in severe preeclampsia: A
microarray approach reveals the VSIG4 gene as a potential blood
biomarker. PloS One. 8:e826382013. View Article : Google Scholar : PubMed/NCBI
|
|
15
|
Sun SY, Liu ZP, Zeng T, Wang Y and Chen L:
Spatio-temporal analysis of type 2 diabetes mellitus based on
differential expression networks. Sci Rep. 3:22682013. View Article : Google Scholar : PubMed/NCBI
|
|
16
|
Gautier L, Cope L, Bolstad BM and Irizarry
RA: Affy-analysis of Affymetrix GeneChip data at the probe level.
Bioinformatics. 20:307–315. 2004. View Article : Google Scholar : PubMed/NCBI
|
|
17
|
Irizarry RA, Hobbs B, Collin F,
Beazer-Barclay YD, Antonellis KJ, Scherf U and Speed TP:
Exploration, normalization, and summaries of high density
oligonucleotide array probe level data. Biostatistics. 4:249–264.
2003. View Article : Google Scholar : PubMed/NCBI
|
|
18
|
Bolstad BM, Irizarry RA, Astrand M and
Speed TP: A comparison of normalization methods for high density
oligonucleotide array data based on variance and bias.
Bioinformatics. 19:185–193. 2003. View Article : Google Scholar : PubMed/NCBI
|
|
19
|
Pepper SD, Saunders EK, Edwards LE, Wilson
C and Miller CJ: The utility of MAS5 expression summary and
detection call algorithms. BMC Bioinformatics. 8:2732007.
View Article : Google Scholar : PubMed/NCBI
|
|
20
|
Taminau J, Meganck S, Lazar C, Steenhoff
D, Coletta A, Molter C, Duque R, de Schaetzen V, Weiss Solís DY,
Bersini H and Nowé A: Unlocking the potential of publicly available
microarray data using inSilicoDb and inSilicoMerging R/Bioconductor
packages. BMC Bioinformatics. 13:3352012. View Article : Google Scholar : PubMed/NCBI
|
|
21
|
Tusher VG, Tibshirani R and Chu G:
Significance analysis of microarrays applied to the ionizing
radiation response. Proc Natl Acad Sci USA. 98:5116–5121. 2001.
View Article : Google Scholar : PubMed/NCBI
|
|
22
|
Benjamini Y and Hochberg Y: Controlling
the false discovery rate: A practical and powerful approach to
multiple testing. J R Stat Soc Series B Stat Methedol. 57:289–300.
1995.
|
|
23
|
Borgatti SP: Centrality and AIDS.
Connections. 18:112–115. 1995.
|
|
24
|
Otte E and Rousseau R: Social network
analysis: A powerful strategy, also for the information sciences. J
Info Sci. 28:441–453. 2002. View Article : Google Scholar
|
|
25
|
Ashburner M, Ball CA, Blake JA, Botstein
D, Butler H, Cherry JM, Davis AP, Dolinski K, Dwight SS, Eppig JT,
et al: Gene ontology: Tool for the unification of biology. The gene
ontology consortium. Nat Genet. 25:25–29. 2000. View Article : Google Scholar : PubMed/NCBI
|
|
26
|
Kanehisa M and Goto S: KEGG: Kyoto
encyclopedia of genes and genomes. Nucleic Acids Res. 28:27–30.
2000. View Article : Google Scholar : PubMed/NCBI
|
|
27
|
da Huang W, Sherman BT and Lempicki RA:
Systematic and integrative analysis of large gene lists using DAVID
bioinformatics resources. Nat Protoc. 4:44–57. 2009. View Article : Google Scholar : PubMed/NCBI
|
|
28
|
He D, Liu ZP, Honda M, Kaneko S and Chen
L: Coexpression network analysis in chronic hepatitis B and C
hepatic lesions reveals distinct patterns of disease progression to
hepatocellular carcinoma. J Mol Cell Biol. 4:140–152. 2012.
View Article : Google Scholar : PubMed/NCBI
|
|
29
|
Liu ZP, Wang Y, Zhang XS and Chen L:
Network-based analysis of complex diseases. IET Syst Biol. 6:22–33.
2012. View Article : Google Scholar : PubMed/NCBI
|
|
30
|
Jeong H, Mason SP, Barabási AL and Oltvai
ZN: Lethality and centrality in protein networks. Nature.
411:41–42. 2001. View
Article : Google Scholar : PubMed/NCBI
|
|
31
|
Teichmann SA and Babu MM: Gene regulatory
network growth by duplication. Nat Genet. 36:492–496. 2004.
View Article : Google Scholar : PubMed/NCBI
|
|
32
|
de la Fuente A: From 'differential
expression' to 'differential networking'-identification of
dysfunctional regulatory networks in diseases. Trends Genet.
26:326–333. 2010. View Article : Google Scholar : PubMed/NCBI
|
|
33
|
Whitley GS, Dash PR, Ayling LJ, Prefumo F,
Thilaganathan B and Cartwright JE: Increased apoptosis in first
trimester extravillous trophoblasts from pregnancies at higher risk
of developing preeclampsia. Am J Pathol. 170:1903–1909. 2007.
View Article : Google Scholar : PubMed/NCBI
|
|
34
|
Longtine MS, Chen B, Odibo AO, Zhong Y and
Nelson DM: Villous trophoblast apoptosis is elevated and restricted
to cytotrophoblasts in pregnancies complicated by preeclampsia,
IUGR, or preeclampsia with IUGR. Placenta. 33:352–359. 2012.
View Article : Google Scholar : PubMed/NCBI
|
|
35
|
Fu JJ, Lin P, Lv XY, Yan XJ, Wang HX, Zhu
C, Tsang BK, Yu XG and Wang H: Low molecular mass polypeptide-2 in
human trophoblast: over-expression in hydatidiform moles and
possible role in trophoblast cell invasion. Placenta. 30:305–312.
2009. View Article : Google Scholar : PubMed/NCBI
|
|
36
|
Hass R and Sohn C: Increased oxidative
stress in pre-eclamptic placenta is associated with altered
proteasome activity and protein patterns. Placenta. 24:979–984.
2003. View Article : Google Scholar : PubMed/NCBI
|
|
37
|
Kugawa F and Aoki M: Expression of the
polyubiquitin gene early in the buprenorphine hydrochloride-induced
apoptosis of NG108-15 cells. DNA Seq. 15:237–245. 2004. View Article : Google Scholar : PubMed/NCBI
|
|
38
|
Roberts JM and Hubel CA: The two stage
model of preeclampsia: variations on the theme. Placenta. 30(Suppl
A): S32–S37. 2009. View Article : Google Scholar : PubMed/NCBI
|
|
39
|
Heazell AE, Buttle HR, Baker PN and
Crocker IP: Altered expression of regulators of caspase activity
within trophoblast of normal pregnancies and pregnancies
complicated by preeclampsia. Reprod Sci. 15:1034–1043. 2008.
View Article : Google Scholar : PubMed/NCBI
|
|
40
|
Unek G, Ozmen A, Mendilcioglu I, Simsek M
and Korgun ET: The expression of cell cycle related proteins PCNA,
Ki67, p27 and p57 in normal and preeclamptic human placentas.
Tissue Cell. 46:198–205. 2014. View Article : Google Scholar : PubMed/NCBI
|
|
41
|
Atienza JM, Roth RB, Rosette C, Smylie KJ,
Kammerer S, Rehbock J, Ekblom J and Denissenko MF: Suppression of
RAD21 gene expression decreases cell growth and enhances
cytotoxicity of etoposide and bleomycin in human breast cancer
cells. Mol Cancer Ther. 4:361–368. 2005.PubMed/NCBI
|
|
42
|
Wong RW and Blobel G: Cohesin subunit SMC1
associates with mitotic microtubules at the spindle pole. Proc Natl
Acad Sci USA. 105:15441–15445. 2008. View Article : Google Scholar : PubMed/NCBI
|
|
43
|
Birkenbihl RP and Subramani S: The rad21
gene product of Schizosaccharomyces pombe is a nuclear, cell
cycle-regulated phosphoprotein. J Biol Chem. 270:7703–7711. 1995.
View Article : Google Scholar : PubMed/NCBI
|
|
44
|
Guillou E, Ibarra A, Coulon V, Casado-Vela
J, Rico D, Casal I, Schwob E, Losada A and Méndez J: Cohesin
organizes chromatin loops at DNA replication factories. Genes Dev.
24:2812–2822. 2010. View Article : Google Scholar : PubMed/NCBI
|
|
45
|
Kong X, Ball AR Jr, Sonoda E, Feng J,
Takeda S, Fukagawa T, Yen TJ and Yokomori K: Cohesin associates
with spindle poles in a mitosis-specific manner and functions in
spindle assembly in vertebrate cells. Mol Biol Cell. 20:1289–1301.
2009. View Article : Google Scholar : PubMed/NCBI
|
|
46
|
Ulrich HD: SUMO modification: Wrestling
with protein conformation. Current Biol. 15:R257–R259. 2005.
View Article : Google Scholar
|
|
47
|
Furness DL, Dekker GA, Hague WM, Khong TY
and Fenech MF: Increased lymphocyte micronucleus frequency in early
pregnancy is associated prospectively with pre-eclampsia and/or
intrauterine growth restriction. Mutagenesis. 25:489–498. 2010.
View Article : Google Scholar : PubMed/NCBI
|
|
48
|
Baczyk D, Drewlo S and Kingdom J: Emerging
role of SUMOylation in placental pathology. Placenta. 34:606–612.
2013. View Article : Google Scholar : PubMed/NCBI
|
|
49
|
Branzei D, Sollier J, Liberi G, Zhao X,
Maeda D, Seki M, Enomoto T, Ohta K and Foiani M: Ubc9-and
mms21-mediated sumoylation counteracts recombinogenic events at
damaged replication forks. Cell. 127:509–522. 2006. View Article : Google Scholar : PubMed/NCBI
|