Introduction
Astrocytoma is a tumor of the astrocytic glial cells
and the most common type of central nervous system (CNS) neoplasm,
accounting for more than 60% of all primary brain tumors (1). Anaplastic astrocytoma (AA) is a high
grade malignant glioma [World Health Organization (WHO) grade III]
(2) of the CNS which develops from a
low grade diffuse astrocytoma (DA; WHO grade II) and invariably
progresses into lethal glioblastoma (WHO grade IV) (3). AA patients have an average survival
period of three years (4). However,
the treatment of AA is controversial, as there is no proven benefit
of adjuvant chemotherapy or supplementary treatments, and novel
chemotherapeutic approaches are required for the treatment of AA
(5).
Transcription factors (TFs) are proteins that are
able to activate or repress transcription by binding to specific
DNA sequences (6,7). In molecular biology, TFs regulate the
transcription of genes by promotion or suppression (6). MicroRNAs (miRNAs) are short noncoding
RNAs that are implicated in tumorigenesis and function as tumor
suppressors or oncogenes (8). TFs
and miRNAs are prominent regulators for gene expression (7).
miRNAs post-transcriptionally modulate gene
expression by negatively regulating the stability or translational
efficiency of their target mRNAs (9). Numerous prior studies have investigated
the associations between specific miRNAs and their target genes,
and a number of databases are available for accessing information
regarding miRNAs and their targets.
Host genes are genes that code miRNAs. Rodriguez
et al demonstrated that miRNAs are transcribed in parallel
with their host transcripts, and that the two transcription classes
of miRNAs (‘exonic’ and ‘intronic’) have been identified (10). Baskerville et al indicated
that intronic miRNA and its host gene are closely associated
(11). It has been suggested that
miRNAs and their host genes together or separately could contribute
to cancer progression (12).
To date, researchers have conducted numerous studies
of AA and knowledge of genes and miRNAs can be obtained (13). Acquired data are classified as
abnormally expressed data or related data according to the degree
of correlation with AA. The abnormally expressed genes and miRNAs
are fatal elements, as the abnormal expression of any one of them
may cause the nosogenesis of AA. Related genes and miRNAs play
auxiliary roles but not the vital ones. Abnormally expressed genes
are defined as genes exhibiting mutation, upregulation,
downregulation, overexpression, low-expression, SNP gene, loss of
expression, differential expression and inactivation (14). Abnormally expressed miRNAs primarily
exhibit upregulation, downregulation, overexpression,
low-expression, differentially expression, mutation and deletion
(15). Killela et al reported
that exome sequencing of AA frequently identified mutations in
IDH1, ATRX and TP53. Furthermore, they identified mutations of
novel genes, particularly in the Notch pathway genes NOTCH1 and
NOTCH2 (16). In the report of Guan
et al, 16 miRNAs were found to be differentially expressed
in AA (17).
The genes and miRNAs associated with AA can be found
in scattered form, which makes it difficult to analyze the
pathogeneses of AA systematically as experiments are conducted from
different angles. However, it may be possible to construct a
biological regulation network based on the existing associations
between genes and miRNAs (18). In
the present study, comprehensive genes and miRNAs associated with
AA were collected manually from databases and previous studies in
order to construct networks and identify the pathology. Three
networks were established; abnormally expressed, related and
global. Each network was combined with three associations between
miRNAs and their target genes, TFs regulating miRNAs and miRNAs
locating on their host genes. The abnormally expressed network is
the core regulation network which contains the abnormally expressed
genes and miRNAs and may indicates the underlying control mechanism
in AA. Certain pathways in the abnormally expressed network were
analyzed. When these pathways abnormally modulate, it may result in
the development of AA. Notably, according to the proposed mechanism
of TF binding, certain identified TFs were predicted using the
P-match method (19). In addition,
contrast tables of upstream and downstream of abnormally expressed
genes, abnormally expressed miRNAs and predicted TFs were extracted
to find the similarities and to determine differences between the
three networks. Crucial elements and pathways were focused on to
reveal the pathogeneses. The results may improve our understanding
of the pathogenesis of AA, thus guiding future studies in
identifying novel therapy strategies.
Materials and methods
Datasets of experimentally validated
interactions between genes and miRNAs
The experimentally validated dataset of human miRNAs
and their target genes was collected from the Tarbase (http://diana.imis.athena-innovation.gr/DianaTools/index.php?r=tarbase/index)
(20), miRTarBase (http://mirtarbase.mbc.nctu.edu.tw/) (21) and miRecords (http://c1.accurascience.com/miRecords/) (22). The dataset was defined as set
U1.
The dataset of human TFs regulating miRNAs was
acquired from TransmiR (http://www.cuilab.cn/transmir) (23) and was considered as set
U2.
The host genes of human miRNAs were extracted from
miRBase (http://www.mirbase.org/) (24) and NCBI. The dataset of host genes
including miRNAs was defined as set U3.
Collection of abnormally expressed
genes and miRNAs in AA
Genes and miRNAs are divided into two classes of
abnormally expressed and related by the importance of their roles
in AA, while abnormally expressed elements are involved in related
elements. Abnormally expressed genes and miRNAs of AA were
collected from published literature. There are numerous databases
of abnormally expressed genes and miRNAs such as the NCBI SNP
database (http://www.ncbi.nlm.nih.gov/SNP/), KEGG (www.genome.jp/kegg/pathway.html), Cancer
GeneticsWeb (http://www.cancerindex.org/geneweb/clink30.htm) and
mir2Disease (http://www.mir2disease.org/). However, the associated
materials of AA were not found in these databases, thus indicating
that the study of AA is lacking and requires further
investigation.
The datasets of abnormally expressed genes and
miRNAs were separately considered as set U4 and
U5.
Collection of related genes and miRNAs
in AA
All related miRNAs were found in pertinent
literatures. Related genes which affect tumor growth, migration,
radial therapy and clinical outcome of AA came from three data
sources including published literature, GeneCards database
(http://www.genecards.org/) (25) and P-match method. GeneCards is a
database of human genes that provides concise genomic related
information on all known and predicted human genes (25) and the first 100 genes associated with
AA were selected. Furthermore, an algorithmic P-match method, which
combines pattern matching and weight matrix approaches to identify
transcription factor binding sites in DNA sequences (19), was used to predict TFs that were
considered to be related genes. Prior to using the P-match method,
1,000 nt promoter region sequences of targets of abnormally
expressed miRNAs were downloaded from UCSC database (http://genome.ucsc.edu/) (26). Subsequently, the P-match method was
used to identify transcription factor binding sites (TFBSs) in
1,000 nt promoter region sequences and mapped TFBSs onto matrix
library in TRANSFAC database (http://www.gene-regulation.com/pub/databases.html).
Finally, the TFs of DNA sequence were acquired. The vertebrate
matrix was used and restricted to high quality matrix criteria.
Datasets of related genes and miRNAs in AA were
separately considered as set U6 and
U7. Symbols of the genes in this paper were
checked against the NCBI database (http://www.ncbi.nlm.nih.gov/gene).
Network construction at three
levels
In this study, three networks of transcription
processes related to AA were constructed, including abnormally
expressed, related and global networks. Sets U1,
U2 and U3 were combined to derive the global
network, thus indicating that the global network includes all the
experimentally validated relations between miRNAs and their
targets, TFs regulating miRNAs and miRNAs located on host
genes.
The abnormally expressed network was derived by
mapping abnormally expressed genes and miRNAs in addition to their
relations from the global network. If a gene and miRNA pair
contained separately in sets U4 and
U5 was found in the global network to form a
certain relation, the elements and the relation were included in
the abnormally expressed network.
Datasets U6 and
U7, that separately represent related genes and
miRNAs, were organized into an AA-related network using the same
method of referring to the relations in the global network. The
related network is also a mapping of the global network and it
includes the abnormally expressed network.
Finally, the software Cytoscape (version 3.0.0;
http://www.cytoscape.org/) was used to realize
network visualization, which assisted in analyzing the regulatory
pathways graphically.
Results
Abnormally expressed network of
AA
Using the methods and datasets mentioned above,
three networks were successfully constructed. The abnormally
expressed network was a core network that displays the regulatory
mechanism of AA. The abnormally expressed network contains
molecular elements that could be used in the diagnosis and
treatment of AA, in addition to numerous crucial regulatory
relations between the elements. This network indicates the
pathogenesis of AA in terms of the regulatory relations between
abnormally expressed genes and miRNAs.
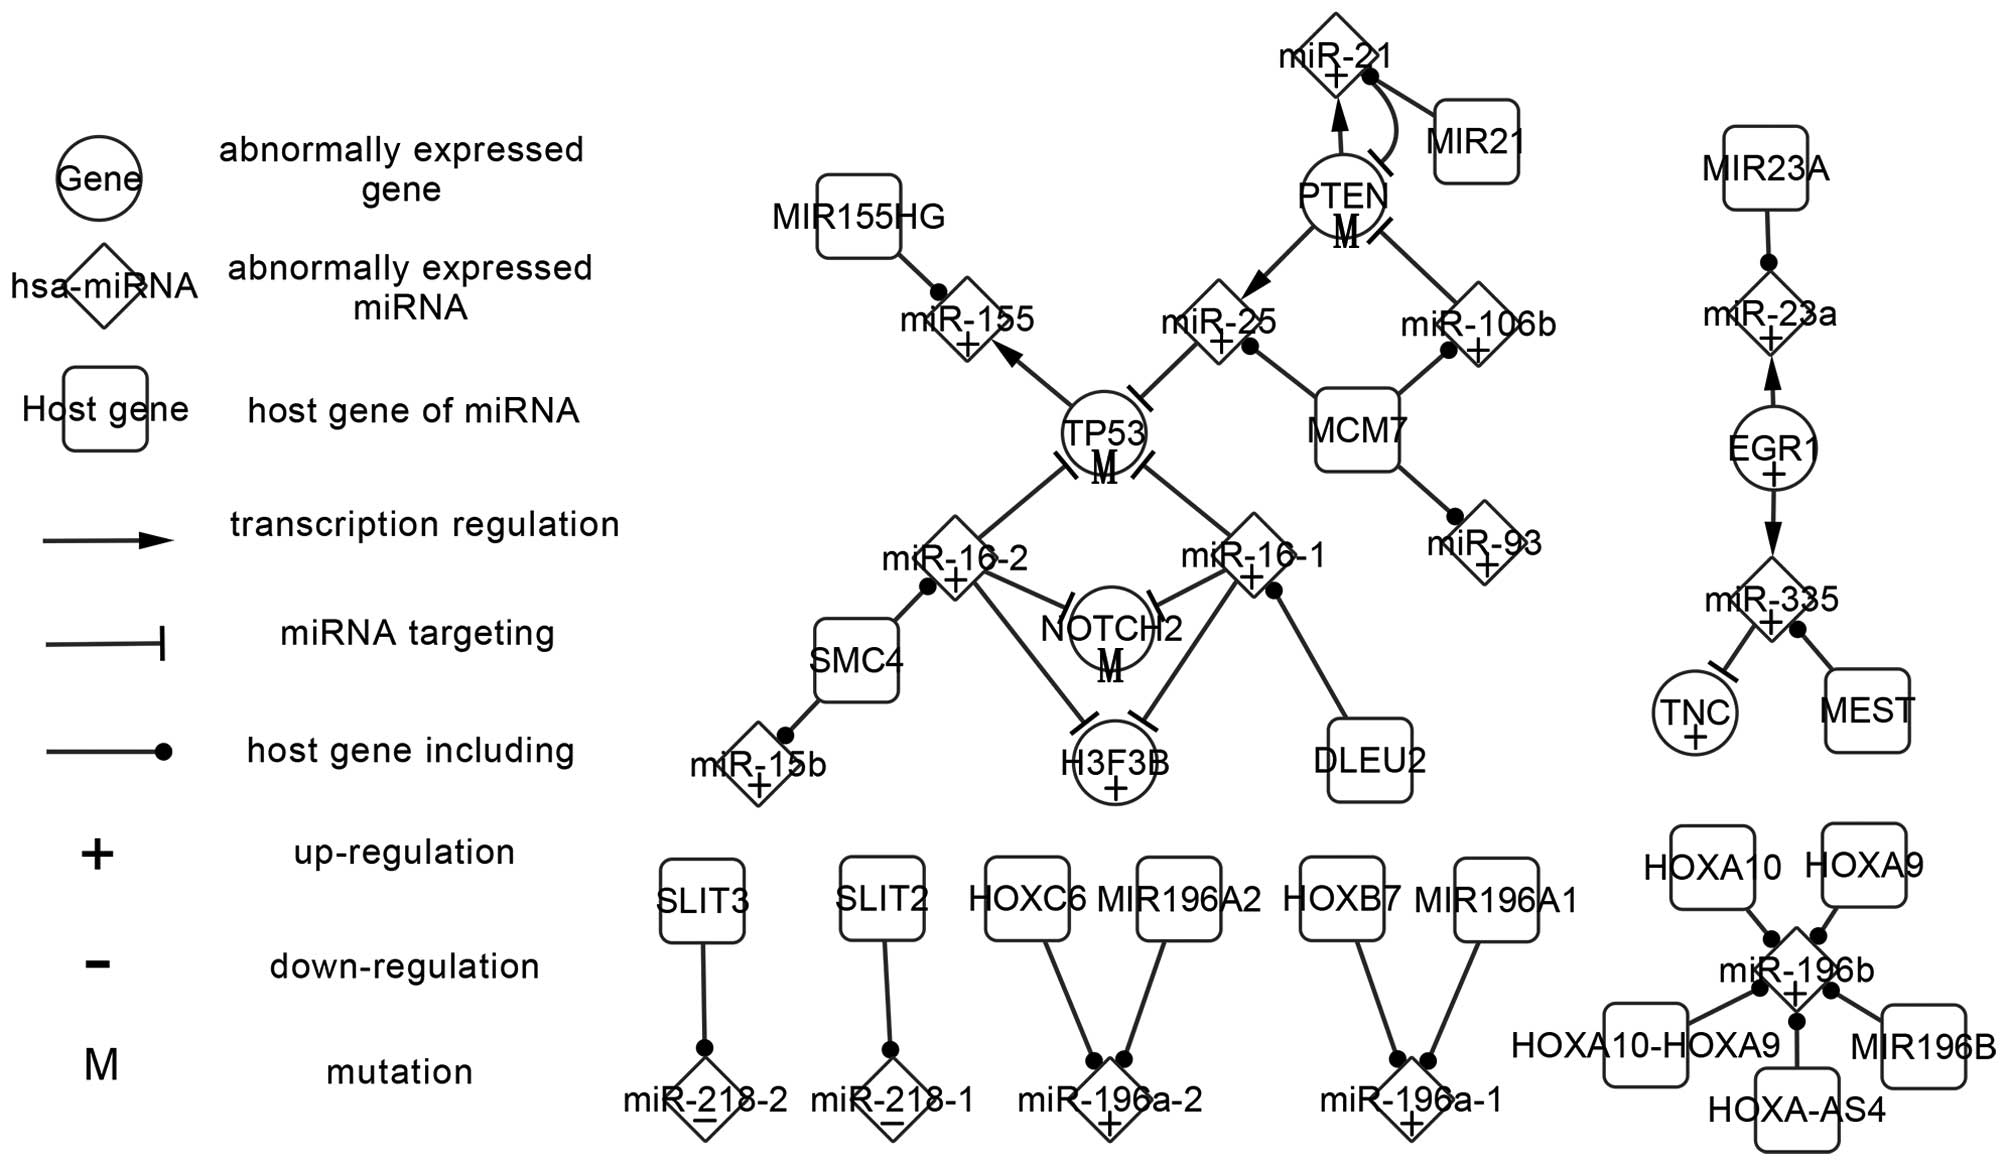
The abnormally expressed network is composed of 15
abnormally expressed miRNAs, six abnormally expressed genes and 18
host genes, including three types of relations between miRNAs
targeting genes, TFs regulating miRNAs and host genes, including
miRNAs. Other abnormally expressed genes and miRNAs that do not
exhibit regulatory relations with others were not included in this
study, though each of these may have significance. The differences
in these elements are presented in Fig.
1 according to the existing experiments. To investigate the
changes in genes and miRNAs in abnormally expressed network
contributes much to the network analysis.
Firstly, abnormally expressed TFs and miRNAs are
analyzed. There are three TFs in Fig.
1; PTEN, TP53 and EGR1. PTEN and TP53 are crucial genes in AA.
In patients with AA, PTEN and p53 mutations have been significantly
associated with reduced and prolonged survival, respectively
(27). The three TFs collectively
regulate five abnormally expressed miRNAs (miR-21, miR-25, miR-155,
miR-335 and miR-23a) and are targeted by a total of five miRNAs
(miR-25, miR-16-1, miR-16-2, miR-21 and miR-106b). EGR1 regulates
miR-335 and miR-23a, and is not itself targeted by any known miRNA.
PTEN regulates miR-21 and miR-25 while being targeted by miR-21 and
miR-106b. TP53 is targeted by miR-16-1, miR-16-2 and miR-25 while
regulating miR-155. Genes that are targeted by miRNAs, but do not
regulate any miRNAs, may be involved in AA. For example, TNC is the
target gene of miR-335 and regulates no further miRNAs as
successors. TNC may be involved in astrocytoma invasion,
gliomagenesis, cell motility, proliferation and the neoplastic
transformation of AA, and the upregulation of TNC may indicate the
presence and metastasis of AA (28).
PTEN and miR-21 form feedback loops (FBLs), via PTEN regulating the
expression of miR-21, with miR-21 in turn targeting PTEN. Certain
genes and miRNAs constitute a multistage regulation pathway, which
proceeds as follows: miR-21 or miR-106b → PTEN → miR-25 → TP53 →
miR-155. Any abnormal expression of the elements in this pathway
may influence the successors and impact the carcinogenesis of
AA.
Furthermore, miRNAs that exclusively targetted genes
have been investigated. In Fig. 1,
miR-16 (miR-16-1 and miR-16-2) and miR-106b belong to this category
of miRNAs, which are not regulated by TFs. miR-16-1 and miR-16-2
target TP53, H3F3B and NOTCH2, indicating that the two miRNAs have
some similarity of function. miR-106b targets PTEN and indirectly
influences the successors. This type of miRNA may result in the
abnormal regulatory network, functioning as start nodes.
Finally, host genes are included in the abnormally
expressed network when the corresponding miRNAs are abnormally
expressed. In Fig. 1, a host gene
could contain multiple miRNAs, with different miRNAs being produced
by a single host gene. miR-196b has five host genes, including
HOXA9, HOXA10, HOXA-AS4, HOXA10-HOXA9 and MIR196B. MCM7 may be a
crucial host gene in AA, as it includes three miRNAs (miR-25,
miR-106b and miR-93). miR-25 and miR-106b function in the PTEN
regulation pathway. miR21, which contains the key miRNA hsa-miR-21,
is similarly important. miR-16-1 and miR-16-2 are from different
host genes, DLEU2 and SMC4, though the two miRNAs have the same
targets in AA.
Furthermore, investigation of the changes of
abnormal genes and miRNAs may be of clinical relevance. The genes
in Fig. 1 show abnormally expressed
patterns of mutation, upregulation and downregulation when compared
to normal tissues. The abnormally expressed patterns of miRNAs
include up regulation and down regulation. The majority of the
miRNAs serve oncogenic function in the AA abnormally expressed
network. Modifying the abnormal expression of genes and miRNAs may
correct faulty regulation and prevent tumorigenesis. EGR1, which is
upregulated in AA (28), regulates
miR-335. Furthermore, the upregulation of miR-335 (29) in AA may incorrectly target TNC and
lead to the upregulation of TNC. The pathway indicates potential
approaches for the therapy of AA by adjusting the abnormal
expression in EGR1, miR-335 and TNC to normal expression levels.
Mutation of PTEN (27) may lead to
the upregulation of miR-25 (2),
while mutation of TP53 (30) may
result in the upregulation of miR-155 (2). In addition, Guan et al indicated
that elevated miR-196 expression levels were significantly
associated with poor survival in patients with AA (17). These findings suggest that the
mutation, upregulation or downregulation of genes and miRNAs may
contribute to tumorigenesis, and may have diagnostic and prognostic
value. If the regulatory network were adjusted to a normal
expression pattern, AA may hypothetically be prevented and cured.
Further studies are required with the aim of correcting the
abnormal expression to normal expression, based on the abnormally
expressed network.
Related network of AA
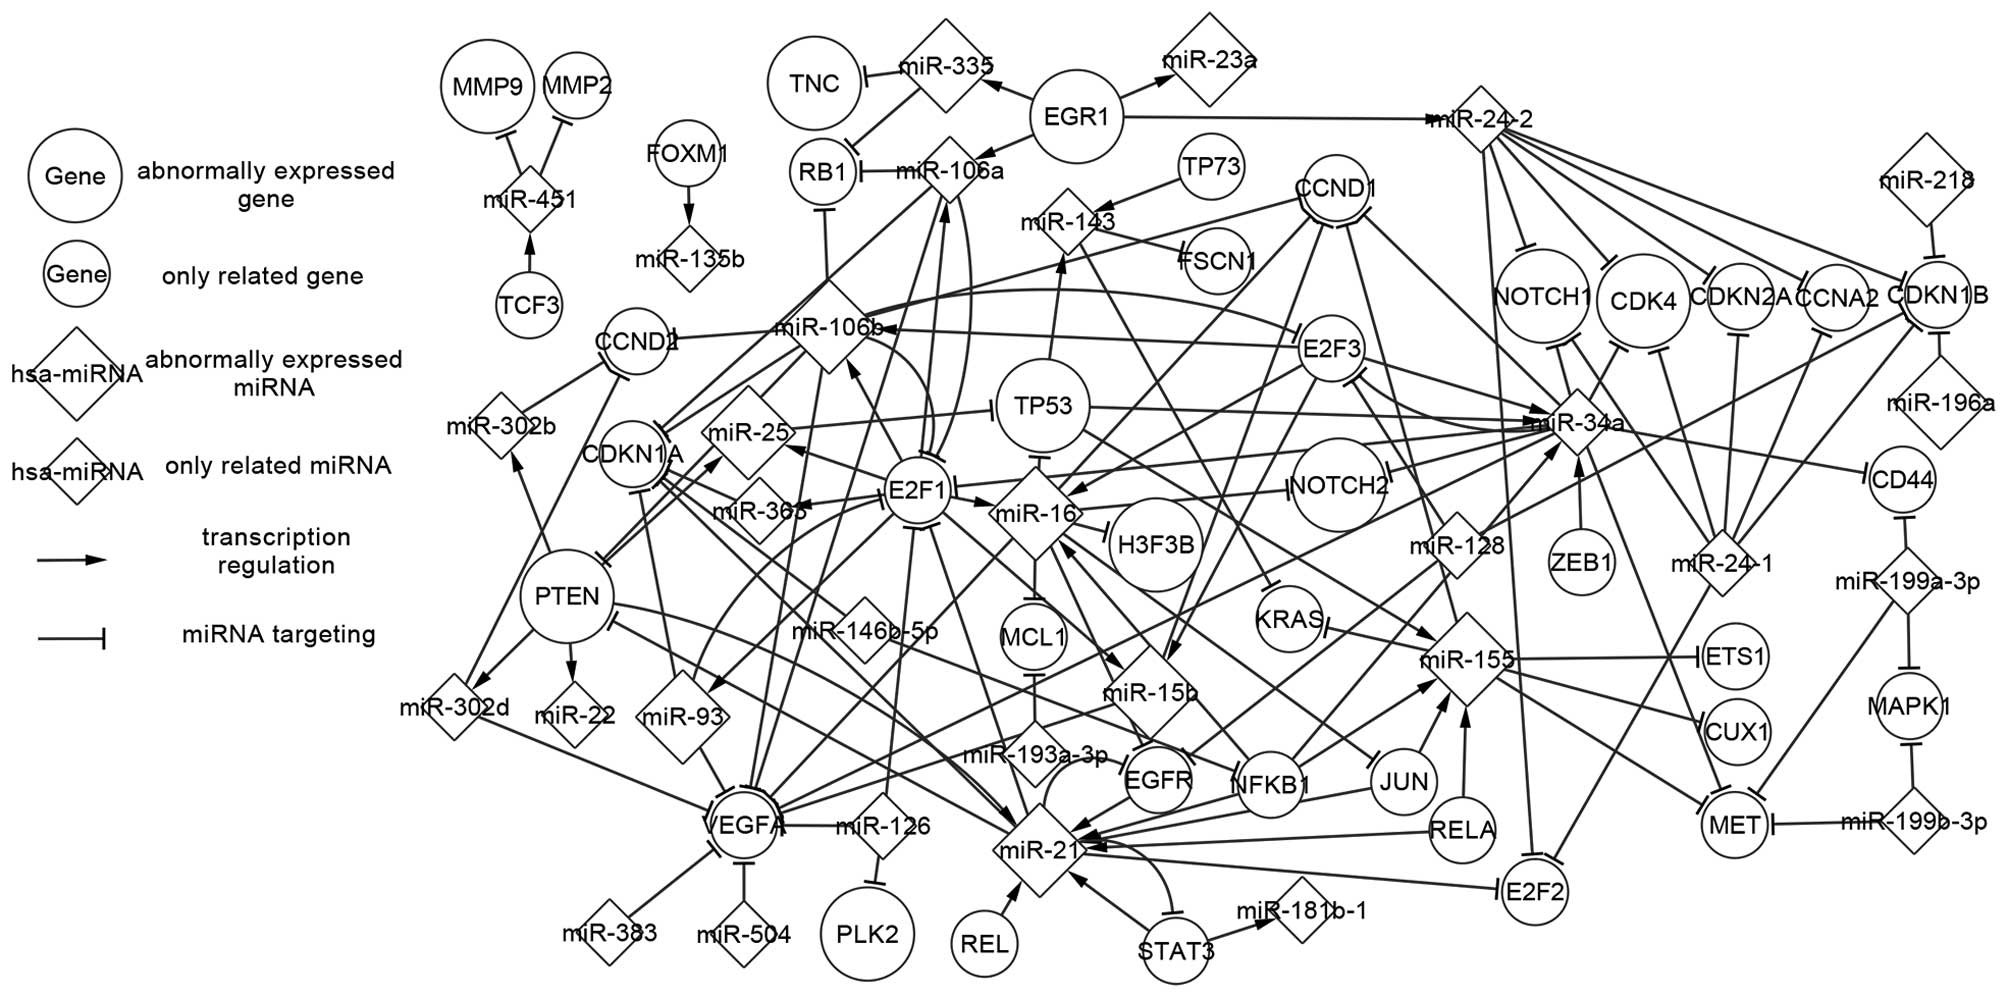
The related network contains the abnormally
expressed network, and also contains additional regulatory
relations not present in the abnormally expressed network. Fig. 2 displays 40 genes, including 10
abnormally expressed genes and 30 related genes (not abnormally
expressed), 30 miRNAs including 11 abnormally expressed miRNAs and
19 only related miRNAs. The abnormally expressed TFs are able to
regulate additional related miRNAs, and abnormally expressed miRNAs
could target at related genes. The additional related elements
interact with abnormally expressed elements as well as related
elements. In the related network, EGR1, an abnormally expressed TF,
regulates two more related miRNAs, including miR-106a and miR-24-2.
TP73 is a related TF that shares a high degree of similarity with
TP53 in its primary sequence and functions (30), and is involved in regulating a
related miRNA miR-143. Related genes such as CCND1, CDKN1A, CDKN1B
and VEGFA are targetted by abundant miRNAs. The AA-related network
shows increased topology relations compared with the abnormally
expressed network and aids in further understand of the
pathogenesis in AA.
Global network of AA
The global network contains all of the regulatory
relations between genes and miRNAs. It is an experimentally
validated biological network in the human body. It is just used as
a reference of the abnormally expressed network and related
network.
Regulatory network of predicted TFs
and abnormally expressed miRNAs
The predicted TFs were selected using the P-match
method mentioned above. They are considered to be related genes and
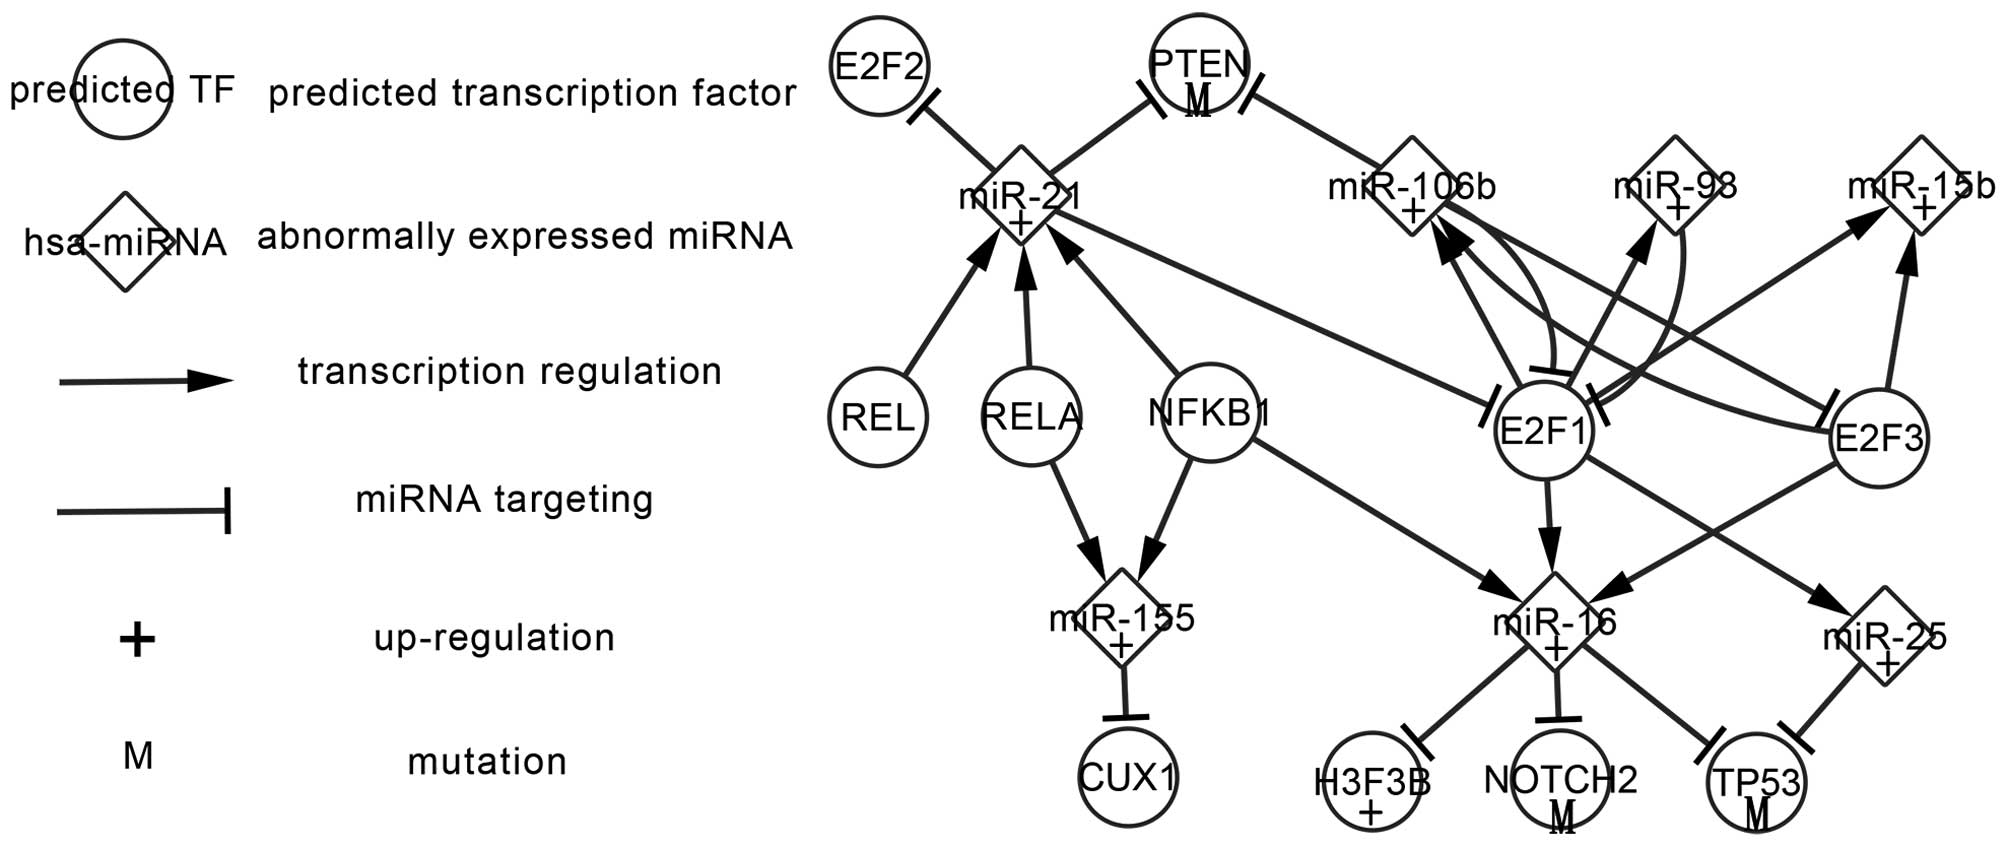
may be involved in the transcriptional regulation of AA. Fig. 3 displays regulatory relations between
seven predicted TFs, seven abnormally expressed miRNAs and four
abnormally expressed target genes in AA. A total of five predicted
TFs including REL, RELA, NFKB1, E2F1 and E2F3 have the possibility
to co-regulate seven abnormally expressed miRNAs, and these miRNAs
target abnormally expressed genes and predicted TFs. Among the
targets, PTEN, NOTCH2, H3F3B and TP53 are abnormally expressed
genes and can be indirectly regulated by the predicted TFs. E2F1
and E2F3 show features in common; both regulate miR-16, miR-106b
and miR-15b while being targeted by miR-106b. Furthermore, E2F1
regulates miR-25 and miR-93 and is targeted by miR-21 and miR-93
more strongly than E2F3. E2F1 and miR-106b, E2F1 and miR-93, E2F3
and miR-106b form FBLs. miR-21 is regulated by REL, RELA and NFKB1
and targets at E2F1, E2F2 and PTEN. RELA and NFKB1 co-regulate
miR-155 and miR-21. Interactions between TFs and abnormally
expressed miRNAs and targets may be involved in the regulatory
mechanism underlying AA. Furthermore, the validated changes of
abnormally expressed miRNAs and targets may aid in the
investigation of predicted TFs in future studies.
Comparison and analysis about
predecessors and successors of abnormally expressed genes
The abnormally expressed genes are crucial in
pathogenesis of AA. Nodes were classified according to the
regulatory relation of adjacent nodes in three level networks, thus
comparing and analyzing the regulatory pathway of each abnormally
expressed gene. A total of 43 abnormally expressed genes were
classified into five classes. The first class of abnormally
expressed genes has six types of adjacent nodes (three successors
and three precursor nodes), including TP53 and PTEN. Between 50 and
60% of AAs manifested TP53 mutations (31), which has significant interactions
between the TP53 and miRNAs in three networks.
The predecessors and successors of TP53 are
presented in three levels in Table
I. It shows that miR-16 and miR-25 target at TP53 and TP53
regulates miR-155 in the abnormally expressed network. In the
related network, TP53 additionally regulates miR-143 and miR-34a.
Experimentally validated miRNAs in global network support these
regulation relations. The predecessors of TP53 may influence the
successors by affecting TP53. Furthermore, TP53 is able to
indirectly influence more elements downstream via successors.
Similarly, TP53 can be controlled by other elements upstream
through the predecessors. For example, PTEN has indirect influence
on TP53 by regulating miR-25 in the abnormally expressed
network.
 | Table I.Regulatory relations between miRNAs
and TP53. |
Table I.
Regulatory relations between miRNAs
and TP53.
| A, miRNAs that
target TP53 |
|---|
|
|---|
| miRNA | Type of
network |
|---|
| hsa-miR-16 | Abnormally
expressed, related, global |
| hsa-miR-25 | Abnormally
expressed, related, global |
|
hsa-miR-125a-5p | Global |
| hsa-miR-125b | Global |
|
hsa-miR-125b-5p | Global |
| hsa-miR-1285 | Global |
| hsa-miR-15a | Global |
| hsa-miR-221 | Global |
| hsa-miR-222 | Global |
| hsa-miR-30d | Global |
| hsa-miR-380-5p | Global |
| hsa-miR-612 | Global |
|
| B, miRNAs regulated
by TP53 |
|
| miRNA | Type of
network |
|
| hsa-miR-155 | Abnormally
expressed, related, global |
| hsa-miR-143 | Related,
global |
| hsa-miR-34a | Related,
global |
| hsa-miR-107 | Global |
| hsa-miR-125b | Global |
| hsa-miR-145 | Global |
| hsa-miR-192 | Global |
| hsa-miR-194 | Global |
| hsa-miR-200a | Global |
| hsa-miR-200b | Global |
| hsa-miR-200c | Global |
| hsa-miR-215 | Global |
| hsa-miR-29 | Global |
| hsa-miR-29a | Global |
| hsa-miR-29c | Global |
| hsa-miR-34 | Global |
| hsa-miR-34b | Global |
| hsa-miR-34c | Global |
| hsa-miR-519d | Global |
The second class of abnormally expressed genes has
three types of adjacent nodes (three successors), including EGR1, a
TF in the abnormally expressed network.
The third class has three types of predecessor,
including H3F3B, NOTCH2 and TNC. They only act as target genes in
the abnormally expressed network.
The fourth class has two types of predecessor,
including CDK4, MMP9, NOTCH1 and PLK2. They are only targets and
show up in the related network.
The majority of abnormally expressed genes have no
adjacent nodes. These isolated genes are not discussed in the
present study.
Comparison and analysis of
predecessors and successors of abnormally expressed miRNAs
The regulatory pathway of each abnormally expressed
miRNA is analyzed using the same method. The 12 abnormally
expressed miRNAs can be classified into seven types. The first
class of abnormally expressed miRNAs has six adjacent nodes (three
predecessors and three successors), including miR-25, miR-21 and
miR-335. It has been well documented that miR-21 is overexpressed
in a number of types of human cancer, and can function as an
anti-apoptotic factor by downregulating the expression of tumor
suppressor genes, such as PTEN (32).
In Table II, miR-21
is regulated by PTEN and targets PTEN in the abnormally expressed
network. Notably, hsa-miR-21 and PTEN form FBLs. miR-21 is
regulated by seven genes while targeting six genes in the
AA-related network. Two pairs of FBLs are added; miR-21 and EGFR,
miR-21 and STAT3. In the global network, miR-21 has 19 predecessors
and 87 successors, which are necessary for identifying the
regulatory relations. The second class of abnormally expressed
miRNAs has three predecessors and two successors, including
miR-155. The third class of abnormally expressed miRNAs has five
adjacent nodes (three successors and two predecessors), including
miR-106b and miR-16. The fourth class has two successors and two
predecessors, including miR-15b and miR-93. The fifth class,
miR-23a, has three predecessors and no gene targets. The sixth
class has two predecessors; miR-196a and miR-218.
| Table II.Regulatory relations between genes
and miR-21 in three network types. |
Table II.
Regulatory relations between genes
and miR-21 in three network types.
| A, Genes that
target miR-21. |
|---|
|
|---|
| Gene | Type of
network |
|---|
| PTEN | Abnormally
expressed, related, global |
| EGFR, JUN | Related,
global |
| STAT3, NFKB1 | Related,
global |
| REL, RELA | Related,
global |
| BMP6, BMPR1A | Global |
| DDX5, ESR1 | Global |
| ETV5, FOXO3 | Global |
| NFIB, RASGRF1 | Global |
| REST, STAT4 | Global |
| TCF4 | Global |
|
| B, Genes that are
targeted by miR-21. |
|
| Gene | Type of
network |
|
| PTEN | Abnormally
expressed, related, global |
| CDKN1A, EGFR | Related,
global |
| STAT3, E2F1 | Related,
global |
| E2F2 | Related,
global |
| ACTA2, ANKRD46 | Global |
| APAF1, BASP1 | Global |
| BCL2, BMPR2 | Global |
| BTG2, CCR1 | Global |
| CDC25A,
CDK2AP1 | Global |
| CDK6, CFL2 | Global |
| DAXX, DERL1 | Global |
| EIF2S1, EIF4A2 | Global |
| ERBB2, FAM3C | Global |
| FAS, FMOD | Global |
| GLCCI1, HIPK3 | Global |
| HNRNPK, ICAM1 | Global |
| IL1B, IL6R | Global |
| ISCU, JAG1 | Global |
| JMY, LRRFIP1 | Global |
| MARCKS, MEF2C | Global |
| MSH2, MSH6 | Global |
| MTAP, MYC | Global |
| NCAPG, NCOA3 | Global |
| NFIB, NT-3 | Global |
| PCBP1, PDCD4 | Global |
| PDHA2, PELI1 | Global |
| PLAT, PLOD3 | Global |
| PPARA, PPIF | Global |
| PRRG4, PTX3 | Global |
| RASA1, RASGRP1 | Global |
| RECK, REST | Global |
| RHOB, RP2 | Global |
| RPS7, RTN4 | Global |
| SERPINB5,
SESN1 | Global |
| SGK3, SLC16A10 | Global |
| SOCS5, SOX5 | Global |
| SPATS2L, SPRY2 | Global |
| TGFB1, TGFBI | Global |
| TGFBR2, TGFBR3 | Global |
| TGFBR3, TGFBR3 | Global |
| TGFBR3, TGIF1 | Global |
| TIAM1, TIMP3 | Global |
| TM9SF3,
TNFAIP3 | Global |
| TOPORS,
TP53BP2 | Global |
| TP63, TPM1 | Global |
| WFS1, WIBG | Global |
miR-196b has no gene interactions and is an isolated
miRNA.
Comparison and analysis of
predecessors and successors of predicted TFs
Finally, the pathway of each predicted TF was
analyzed at three levels using the same method. Among the predicted
TFs, E2F1 has the most abundant adjacent nodes.
In Table III, E2F1
is targeted by three miRNAs, while regulating five miRNAs in the
abnormally expressed network. Six related miRNAs target E2F1 and
seven related miRNAs are regulated by E2F1. miRNAs in the global
network validated by experiments provide theoretical foundation for
the research. In the comparison table, miR-106b and miR-93 form
FBLs with E2F1 in the abnormally expressed network, while
hsa-miR-106a is added to form FBLs with E2F1 in the related
network.
| Table III.Regulatory relations between miRNAs
and E2F1 in three networks. |
Table III.
Regulatory relations between miRNAs
and E2F1 in three networks.
| A, miRNAs that
target E2F1. |
|---|
|
|---|
| miRNA | Type of
network |
|---|
| hsa-miR-106b | Abnormally
expressed, related, global |
| hsa-miR-21 | Abnormally
expressed, related, global |
| hsa-miR-93 | Abnormally
expressed, related, global |
| hsa-miR-106a | Related,
global |
| hsa-miR-126 | Related,
global |
| hsa-miR-34a | Related,
global |
| hsa-let-7a | Global |
|
hsa-miR-106a-5p | Global |
| hsa-miR-149* | Global |
| hsa-miR-17 | Global |
| hsa-miR-17–5p | Global |
| hsa-miR-20 | Global |
| hsa-miR-203a | Global |
| hsa-miR-20a | Global |
| hsa-miR-223 | Global |
| hsa-miR-23b | Global |
| hsa-miR-330-3p | Global |
| hsa-miR-331-3p | Global |
| hsa-miR-34a | Global |
| hsa-miR-93 | Global |
| hsa-miR-98 | Global |
|
| B, miRNAs regulated
by E2F1. |
|
| miRNA | Type of
network |
|
| hsa-miR-106b | Abnormally
expressed, related, global |
| hsa-miR-15b | Abnormally
expressed, related, global |
| hsa-miR-16 | Abnormally
expressed, related, global |
| hsa-miR-25 | Abnormally
expressed, related, global |
| hsa-miR-93 | Abnormally
expressed, related, global |
| hsa-miR-106a | Related,
global |
| hsa-miR-363 | Related,
global |
| hsa-let-7a | Global |
| hsa-let-7i | Global |
| hsa-miR-106 | Global |
| hsa-miR-15a | Global |
| hsa-miR-17 | Global |
| hsa-miR-18a,
−18b | Global |
| hsa-miR-195 | Global |
| hsa-miR-223 | Global |
| hsa-miR-19a,
−19b | Global |
| hsa-miR-20, −20a,
−20b | Global |
| hsa-miR-449,
−449a | Global |
| hsa-miR-449b,
−449c | Global |
| hsa-miR-91 | Global |
| hsa-miR-92,
−92a | Global |
Discussion
In the present study, a novel approach was developed
for the study of the relationships between genes and miRNAs
associated with AA, in order to clarify the underlying pathology of
AA. Based on the three types of experimentally validated relations,
three networks were constructed hierarchically; abnormally
expressed, related and global networks. Pathways were analyzed in
order to identify the regulatory features. Specific regulatory
relations have been validated in other cancer types; for example,
miR-21 is overexpressed in numerous types of human cancer and is
able to function as an anti-apoptotic factor by downregulating the
expression of the tumor suppressor gene PTEN (32). In the AA abnormally expressed
network, the pathway is extended to multistage regulation. miR-21
targets PTEN, while PTEN regulates miR-25 and miR-21, which form
FBLs. Furthermore, miR-25 targets TP53, while TP53 regulates
miR-155. The pathways, which include important transcriptional and
targeting regulation, may contribute to future gene therapy
development. The related network may also contribute to the
improved understanding of the pathogenesis of AA. In addition, the
predecessors and successors of abnormally expressed genes and
miRNAs were compared and analyzed to identify the similarities and
differences between the three networks. Furthermore, predicted TFs
were investigated in the three networks. The present study may aid
in elucidating the underlying pathogenesis of AA, by use of
topological networks. In future, with the increasing study of AA,
the occurrence, mechanism, improvement, metastasis and treatment of
AA may be improved.
Acknowledgements
This study was supported by the grants from the
National Natural Science Foundation of China (grant no. 60973091)
and Science and Technology Development Plan of Jilin Province
(grant no. 20130101166JC).
Glossary
Abbreviations
Abbreviations:
|
miRNA
|
microRNA
|
|
AA
|
anaplastic astrocytoma
|
|
TFs
|
transcription factors
|
|
targets
|
target genes
|
|
FBLs
|
feedback loops
|
|
NCBI
|
National Center for Biotechnology
Information
|
|
TFBSs
|
transcription factor binding sites
|
References
|
1
|
Landis SH, Murray T, Bolden S and Wingo
PA: Cancer statistics, 1999. CA Cancer J Clin. 49:8–31. 1999.
View Article : Google Scholar : PubMed/NCBI
|
|
2
|
Rao SA, Santosh V and Somasundaram K:
Genome-wide expression profiling identifies deregulated miRNAs in
malignant astrocytoma. Mod Pathol. 23:1404–1417. 2010. View Article : Google Scholar : PubMed/NCBI
|
|
3
|
Polishsetty RV, Gautam P, Gupta MK, Sharma
R, Uppin MS, Challa S, Ankathi P, Purohit AK, Renu D, Harsha HC, et
al: Heterogeneous nuclear ribonucleoproteins and their interactors
are a major class of deregulated proteins in anaplastic
astrocytoma: A grade III malignant glioma. J Proteome Res.
12:3128–3138. 2013. View Article : Google Scholar : PubMed/NCBI
|
|
4
|
Tanwar MK, Glibert MR and Holland EC: Gene
expression microarray analysis reveals YKL-40 to be a potential
serum marker for malignant character in human glioma. Cancer Res.
62:4364–4368. 2002.PubMed/NCBI
|
|
5
|
Ugur HC, Taspinar M, Ilgaz S, Sert F,
Canpinar H, Rey JA, Castresana JS and Sunguroglu A:
Chemotherapeutic resistance in anaplastic astrocytoma cell lines
treated with a temozolomide-lomeguatrib combination. Mol Biol Rep.
41:697–703. 2014. View Article : Google Scholar : PubMed/NCBI
|
|
6
|
Tran DH, Satou K, Ho TB and Pham TH:
Computational discovery of miR TF regulatory modules in human
genome. Bioinformation. 4:371–377. 2010. View Article : Google Scholar : PubMed/NCBI
|
|
7
|
Hobert O: Gene regulation by transcription
factors and microRNAs. Science. 319:W1785–W1786. 2008. View Article : Google Scholar
|
|
8
|
Bartel DP: MicroRNAs: Genomics,
biogenesis, mechanism, and function. Cell. 116:281–297. 2004.
View Article : Google Scholar : PubMed/NCBI
|
|
9
|
Zhi F, Zhou G, Shao N, Xia X, Shi Y, Wang
Q, Zhang Y, Wang R, Xue L, Wang S, et al: MiR-106a-5p inhibits the
proliferation and migration of astrocytoma cells and promotes
apoptosis by targeting FASTK. PLoS One. 8:e723902013. View Article : Google Scholar : PubMed/NCBI
|
|
10
|
Rodriguez A, Griffiths-Jones S, Ashurst JL
and Bradley A: Identification of mammalian microRNA host genes and
transcription units. Genome Res. 14:1902–1910. 2004. View Article : Google Scholar : PubMed/NCBI
|
|
11
|
Baskerville S and Bartel DP: Microarray
profiling of microRNAs reveals frequent coexpression with
neighboring miRNAs and host genes. RNA. 11:241–247. 2005.
View Article : Google Scholar : PubMed/NCBI
|
|
12
|
Cao G, Huang B, Liu Z, Zhang J, Xu H, Xia
W, Li J, Li S, Chen L, Ding H, et al: Intronic miR-301 feedback
regulates its host gene, ska2, in A549 cells by targeting MEOX2 to
affect ERK/CREB pathways. Biochem Biophys Res Commun. 396:978–982.
2010. View Article : Google Scholar : PubMed/NCBI
|
|
13
|
Sandro PC, Jose DA, Carlos AC, Cristovam
SN, Stela VP, Sonia MM, Marcelo JDS and Euclides TDR: Evaluation of
the microvascular density in astrocytomas in adults correlated
using SPECT-MIBI. Exp Ther Med. 1:293–299. 2010.
|
|
14
|
Wang K, Xu Z, Wang N, Xu T and Zhu M:
MicroRNA and gene networks in human diffuse large B-cell lymphoma.
Oncol Lett. 8:2225–2232. 2014.PubMed/NCBI
|
|
15
|
Zhu MH, Xu ZW, Wang KH, Wang N, Zhu MY and
Wang S: MicroRNA and gene networks in human Hodgkin's lymphoma. Mol
Med Rep. 8:1747–1754. 2013.PubMed/NCBI
|
|
16
|
Killela PJ, Pirozzi CJ, Reitman ZJ, Jones
S, Rasheed BA, Lipp E, Friedman H, Friedman AH, He Y, McLendon RE,
et al: The genetic landscape of anaplastic astrocytoma. Oncotarget.
5:1452–1457. 2014. View Article : Google Scholar : PubMed/NCBI
|
|
17
|
Guan YL, Mizoguchi M, Yoshimoto K, Hata N,
Shono T, Suzuki SO, Araki Y, Kuga D, Nakamizo A, Amano T, et al:
MiRNA-196 is upregulated in glioblastoma but not in anaplastic
astrocytoma and has prognostic significance. Clin Cancer Res.
16:4289–4297. 2010. View Article : Google Scholar : PubMed/NCBI
|
|
18
|
Li J, Xu ZW, Wang KH, Wang N, Li DQ and
Wang S: Networks of microRNAs and genes in retinoblastomas. Asian
Pac J Cancer Prev. 14:6631–6636. 2013. View Article : Google Scholar
|
|
19
|
Chekmenev DS, Haid C and Kel AE: P-Match:
Transcription factor binding site search by combining patterns and
weight matrices. Nucleic Acids Res. 33:W432–W437. 2005. View Article : Google Scholar : PubMed/NCBI
|
|
20
|
Papadopoulos GL, Reczko M, Simossis VA,
Sethupathy P and Hatzigeorgiou AG: The database of experimentally
supported targets: A functional update of TarBase. Nucleic Acids
Res. 37:D155–D158. 2009. View Article : Google Scholar : PubMed/NCBI
|
|
21
|
Hsu SD, Tseng YT, Shrestha S, Lin YL,
Khaleel A, Chou CH, Chu CF, Huang HY, Lin CM, Ho SY, et al:
miRTarBase update 2014: An information resource for experimentally
validated miRNA-target interactions. Nucleic Acids Res. 42:D78–D85.
2014. View Article : Google Scholar : PubMed/NCBI
|
|
22
|
Xiao F, Zuo Z, Cai G, Kang S, Gao X and Li
T: miRecords: An integrated resource for microRNA-target
interactions. Nucleic Acids Res. 37:D105–D110. 2009. View Article : Google Scholar : PubMed/NCBI
|
|
23
|
Wang J, Lu M, Qiu CX and Cui QH: TransmiR:
A transcription factor-microRNA regulation database. Nucleic Acids
Res. 38:D119–D122. 2010. View Article : Google Scholar : PubMed/NCBI
|
|
24
|
Kozomara A and Griffiths-Jones S: miRBase:
Integrating microRNA annotation and deep-sequencing data. Nucleic
Acids Res. 39:D152–D157. 2011. View Article : Google Scholar : PubMed/NCBI
|
|
25
|
Safran M, Dalah I, Alexander J, Rosen N,
Iny Stein T, Shmoish M, Nativ N, Bahir I, Doniger T, Krug H, et al:
GeneCards Version 3: The human gene integrator. Database (Oxford).
2010:baq0202010. View Article : Google Scholar : PubMed/NCBI
|
|
26
|
Fujita PA, Rhead B, Zweig AS, Hinrichs AS,
Karolchik D, Cline MS, Goldman M, Barber GP, Clawson H, Coelho A,
et al: The UCSC genome browser database: Update 2011. Nucleic Acids
Res. 39:D876–D882. 2011. View Article : Google Scholar : PubMed/NCBI
|
|
27
|
Smith JS, Tachibana I, Passe SM, Huntley
BK, Borell TJ, Iturria N, O'Fallon JR, Schaefer PL, Scheithauer BW,
James CD, et al: PTEN mutation, EGFR amplification and outcome in
patients with anaplastic astrocytoma and glioblastoma multiforme. J
Natl Cancer Inst. 93:1246–1256. 2001. View Article : Google Scholar : PubMed/NCBI
|
|
28
|
Chang CL: Genome-wide oligonucleotide
microarray analysis of gene-expression profiles of Taiwanese
patients with anaplastic astrocytoma and glioblastoma multiforme. J
Biomol Screen. 13:912–921. 2008. View Article : Google Scholar : PubMed/NCBI
|
|
29
|
Shu M, Zheng X, Wu S, Lu H, Leng T, Zhu W,
Zhou Y, Ou Y, Lin X, Lin Y, et al: Targeting oncogenic miR-335
inhibits growth and invasion of malignant astrocytoma cells. Mol
Cancer. 10:592011. View Article : Google Scholar : PubMed/NCBI
|
|
30
|
Anselmo NP, Rey JA, Almeida LO, Custodio
AC, Almeida JR, Clara CA, Santos MJ and Casartelli C: Concurrent
sequence variation of TP53 and TP73 genes in anaplastic
astrocytoma. Genet Mol Res. 8:1257–1263. 2009. View Article : Google Scholar : PubMed/NCBI
|
|
31
|
Ushio Y, Tada K, Shiraishi S, Kamiryo T,
Shinojima N, Kochi M and Saya H: Correlation of molecular genetic
analysis of p53, MDM2, P16, PTEN and EGFR and survival of patients
with anaplastic astrocytoma and glioblastoma. Front Biosci.
8:e281–e288. 2003. View
Article : Google Scholar : PubMed/NCBI
|
|
32
|
Zhi F, Chen X, Wang SN, Xia X, Shi Y, Guan
W, Shao N, Qu H, Yang C, Zhang Y, et al: The use of hsa-miR-21,
hsa-miR-181b and hsa-miR-106a as prognostic indicators of
astrocytoma. Eur J Cancer. 46:1640–1649. 2010. View Article : Google Scholar : PubMed/NCBI
|