Introduction
Recently increasing attention has been focused on
investigating the thickness of the retinal nerve fiber layer (RNFL)
in multiple sclerosis (MS) patients. The RNFL contains the proximal
portions of the axons that originate from ganglion cell neurons and
these axons account for >80% of the thickness of this layer
(1). Thus, quantification of the
RNFL by optical coherence tomography (OCT) has been proposed to
provide an indirect appraisal for retinal axonal loss (2–5). As
these axons are not myelinated and the visual system is often
affected in MS, RNFL measurements in MS patients that suffered from
optic neuritis (ON) may offer an effective approach for the study
of ON-related neurodegeneration. Indeed, MS patients with a history
of ON exhibit reduced RNFL thicknesses compared with healthy
control eyes (2–5). It has been reported that the majority
of patients sustained a thinning of the RNFL within a period of
only 3–6 months following acute ON (4). A significant thinning of the RNFL has
been observed in non-affected contralateral eyes in addition to the
eyes of MS subjects with no history of ON, suggesting that RNFL
damage may occur independently of clinically overt ON (2,3,5–7).
Accordingly, post-mortem analyses detected ON lesions in 94–99% MS
subjects, irrespective of any ON history (8–10).
However, RNFL reductions were less evident compared with those
observed following ON.
It has been demonstrated that following acquired
unilateral occipital damage a thinning of the RNFL and optic tract
occurs, confirming the existence of retrograde trans-synaptic
degeneration of neurons in the human visual pathway (11–13). A
significant association between visual cortex damage and RNFL
thinning has been shown in MS patients with no ON history,
indicating the presence of retrograde trans-synaptic
(trans-geniculate) degeneration in the retina (14–16).
Conversely, MS subjects who had previously suffered from ON exhibit
more intense atrophy in the visual cortex, implicating that the
damage cascade may also proceed in anterograde direction (14,15,17,18).
Notably, the RNFL thinning in MS patients appears to correlate with
global brain atrophy in general, which enhances the applicability
of using OCT in those subjects, as an association between the RNFL
and global measures of disability has been reported by several
authors (3,19–26).
Human interferon-β (IFNβ), which is a first-line disease modifying
drug for the therapy of relapsing-remitting MS (RRMS), has been
shown to have an impact on some of these global measures, including
the expanded disability status scale (EDSS) (27–29).
However, the proposed neuroprotective effect of IFNβ is highly
controversial (30,31). IFNβ is speculated to predominantly
target the systemic immune response; however, whether it modulates
axonal degeneration remains unknown (30,31).
Cross-sectional and acute ON OCT studies have not yet provided
evidence for any such role (32,33).
Thus, the aim of this prospective longitudinal OCT study was to
determine whether IFNβ treatment is able to impede retinal axonal
loss.
Materials and methods
Subjects
A total of 24 IFNβ-1b-treated and 24 subjects with
untreated RRMS according to revised McDonald criteria (2005) were
enrolled (34). The untreated cohort consisted of subjects who
refused MS disease-modifying therapy (n=17) or did not receive it
for >5 years (n=7). The following data were obtained from each
MS patient at the screening visit: Age, sex, co-morbidities,
co-medication, date of MS symptom onset, disease duration, prior
episodes of ON, prior MS medication, total number of relapses, last
relapse, and, for the IFNβ-1b group, start date of IFNβ-1b therapy.
Disease duration was defined as the time period between the first
recognized symptoms of MS and study inclusion. Subjects were aimed
to broadly match for age, gender and refraction (±2 diopters). None
of the enrolled MS subjects sustained an acute relapse and/or
received systemic steroid treatment within 30 days prior to study
entry. The untreated MS patients had been without immunomodulatory
treatment for at least one year prior to study entry. None of the
subjects were previously treated with teriflunomide, mitoxantrone
or cyclophosphamide. In addition, none of the subjects suffered
from any ophthalmological or neurological disorder other than MS.
The control group consisted of 12 healthy volunteers with no
history of ocular or neurological disease and with a visual acuity
of ≥1.0. The study was approved by the Institutional Review Board
of the Hannover Medical School (Hannover, Germany). All
participants signed an informed consent form detailing the purpose
of this study, the tests included in the exploratory protocol, and
the permission to stop participating in the study at any time.
Clinical assessment
The present study was a prospective longitudinal
study over a period of one year. Subjects were evaluated at
baseline and at 3, 6 and 12 months. All subjects underwent a
complete ophthalmic examination that included assessment of
best-corrected visual acuity, ocular motility, pupillary reflexes,
biomicroscopy of the anterior segment using a slit lamp, papillary
morphology with fundoscopic exam, and visual field examination of
each eye at baseline visit. At each visit, visual acuity tests were
performed using Landolt rings and RNFL thicknesses were quantified
by OCT. All examinations were conducted by a team of
ophthalmologists, optometrists and orthoptists.
In addition, the EDSS score and the two/three second
paced auditory serial addition test (PASAT) were assessed at each
visit. The EDSS score was ascertained by trained neurologists,
while the PASAT was performed by a trained study nurse. At each
visit, full-field VEP were recorded monocularly in a dark room
after occlusion of the other eye and elicited by 1.3 Hz pattern
reversal of a 50% contrast black-and-white checkerboard at a
viewing distance of 1 m (Viking Nicolet Quest; Natus Medical
Incorporated, Soltau, Germany). Silver chloride-plated disk
electrodes (GVB-geliMED, Bad Segeberg, Germany) were placed on the
scalp at the occipital (active electrode) and frontal (reference
electrode) areas. The latency and amplitude (peak-to-peak amplitude
of N75-Pl00) of the positive fundamental component (P100) were
analyzed.
RNFL imaging
OCT was performed with a time-domain (TD) OCT
(Stratus OCT Model 3000; Carl Zeiss Meditec AG, Jena, Germany).
RNFL images were acquired by taking three circular 3.4-mm scans,
centered on the optic disc, the mean of which was used to express
RNFL thickness (Fast RNFL thickness protocol). The ophthalmology
team which participated in this study complied with the majority of
the points listed in the OSCAR-IB criteria, such as retinal
pathology, obvious problems, centration of scans, control of
algorithm failure, illumination and beam placement. However, a
signal strength of ≥8 was considered acceptable in this study,
whereas signal strength of >15 is required to meet the OSCAR-IB
criteria (35,36).
Statistical analysis
Analyses were conducted using generalized estimating
equation (GEE) models with an exchangeable working correlation
structure to account for correlation between the two eyes from a
single participant (37,38). As it is well known that the GEE
estimator of the variance-covariance matrix of the parameter
estimates leads to inflated Type I error rates, the robust
covariance matrix was gauged via an iterative jackknife resampling
method (39). The free software
programming language R version 3.1.2 (https://cran.r-project.org.) with the package geepack
was used to perform all GEE analyses (40). For pairwise comparison of the
predicted marginal means, the R Package doBy was used. One-way
analysis of variance, Kruskal-Wallis test (comparison of three
independent groups) and the two-tailed Mann-Whitney U test
(comparison of two independent groups) were used for additional
statistical analysis according to data distribution as tested by
the Shapiro-Wilk test. For the latter, analyses were performed
using GraphPad Prism, version 5.02 (GraphPad Software, Inc., La
Jolla, CA, USA).
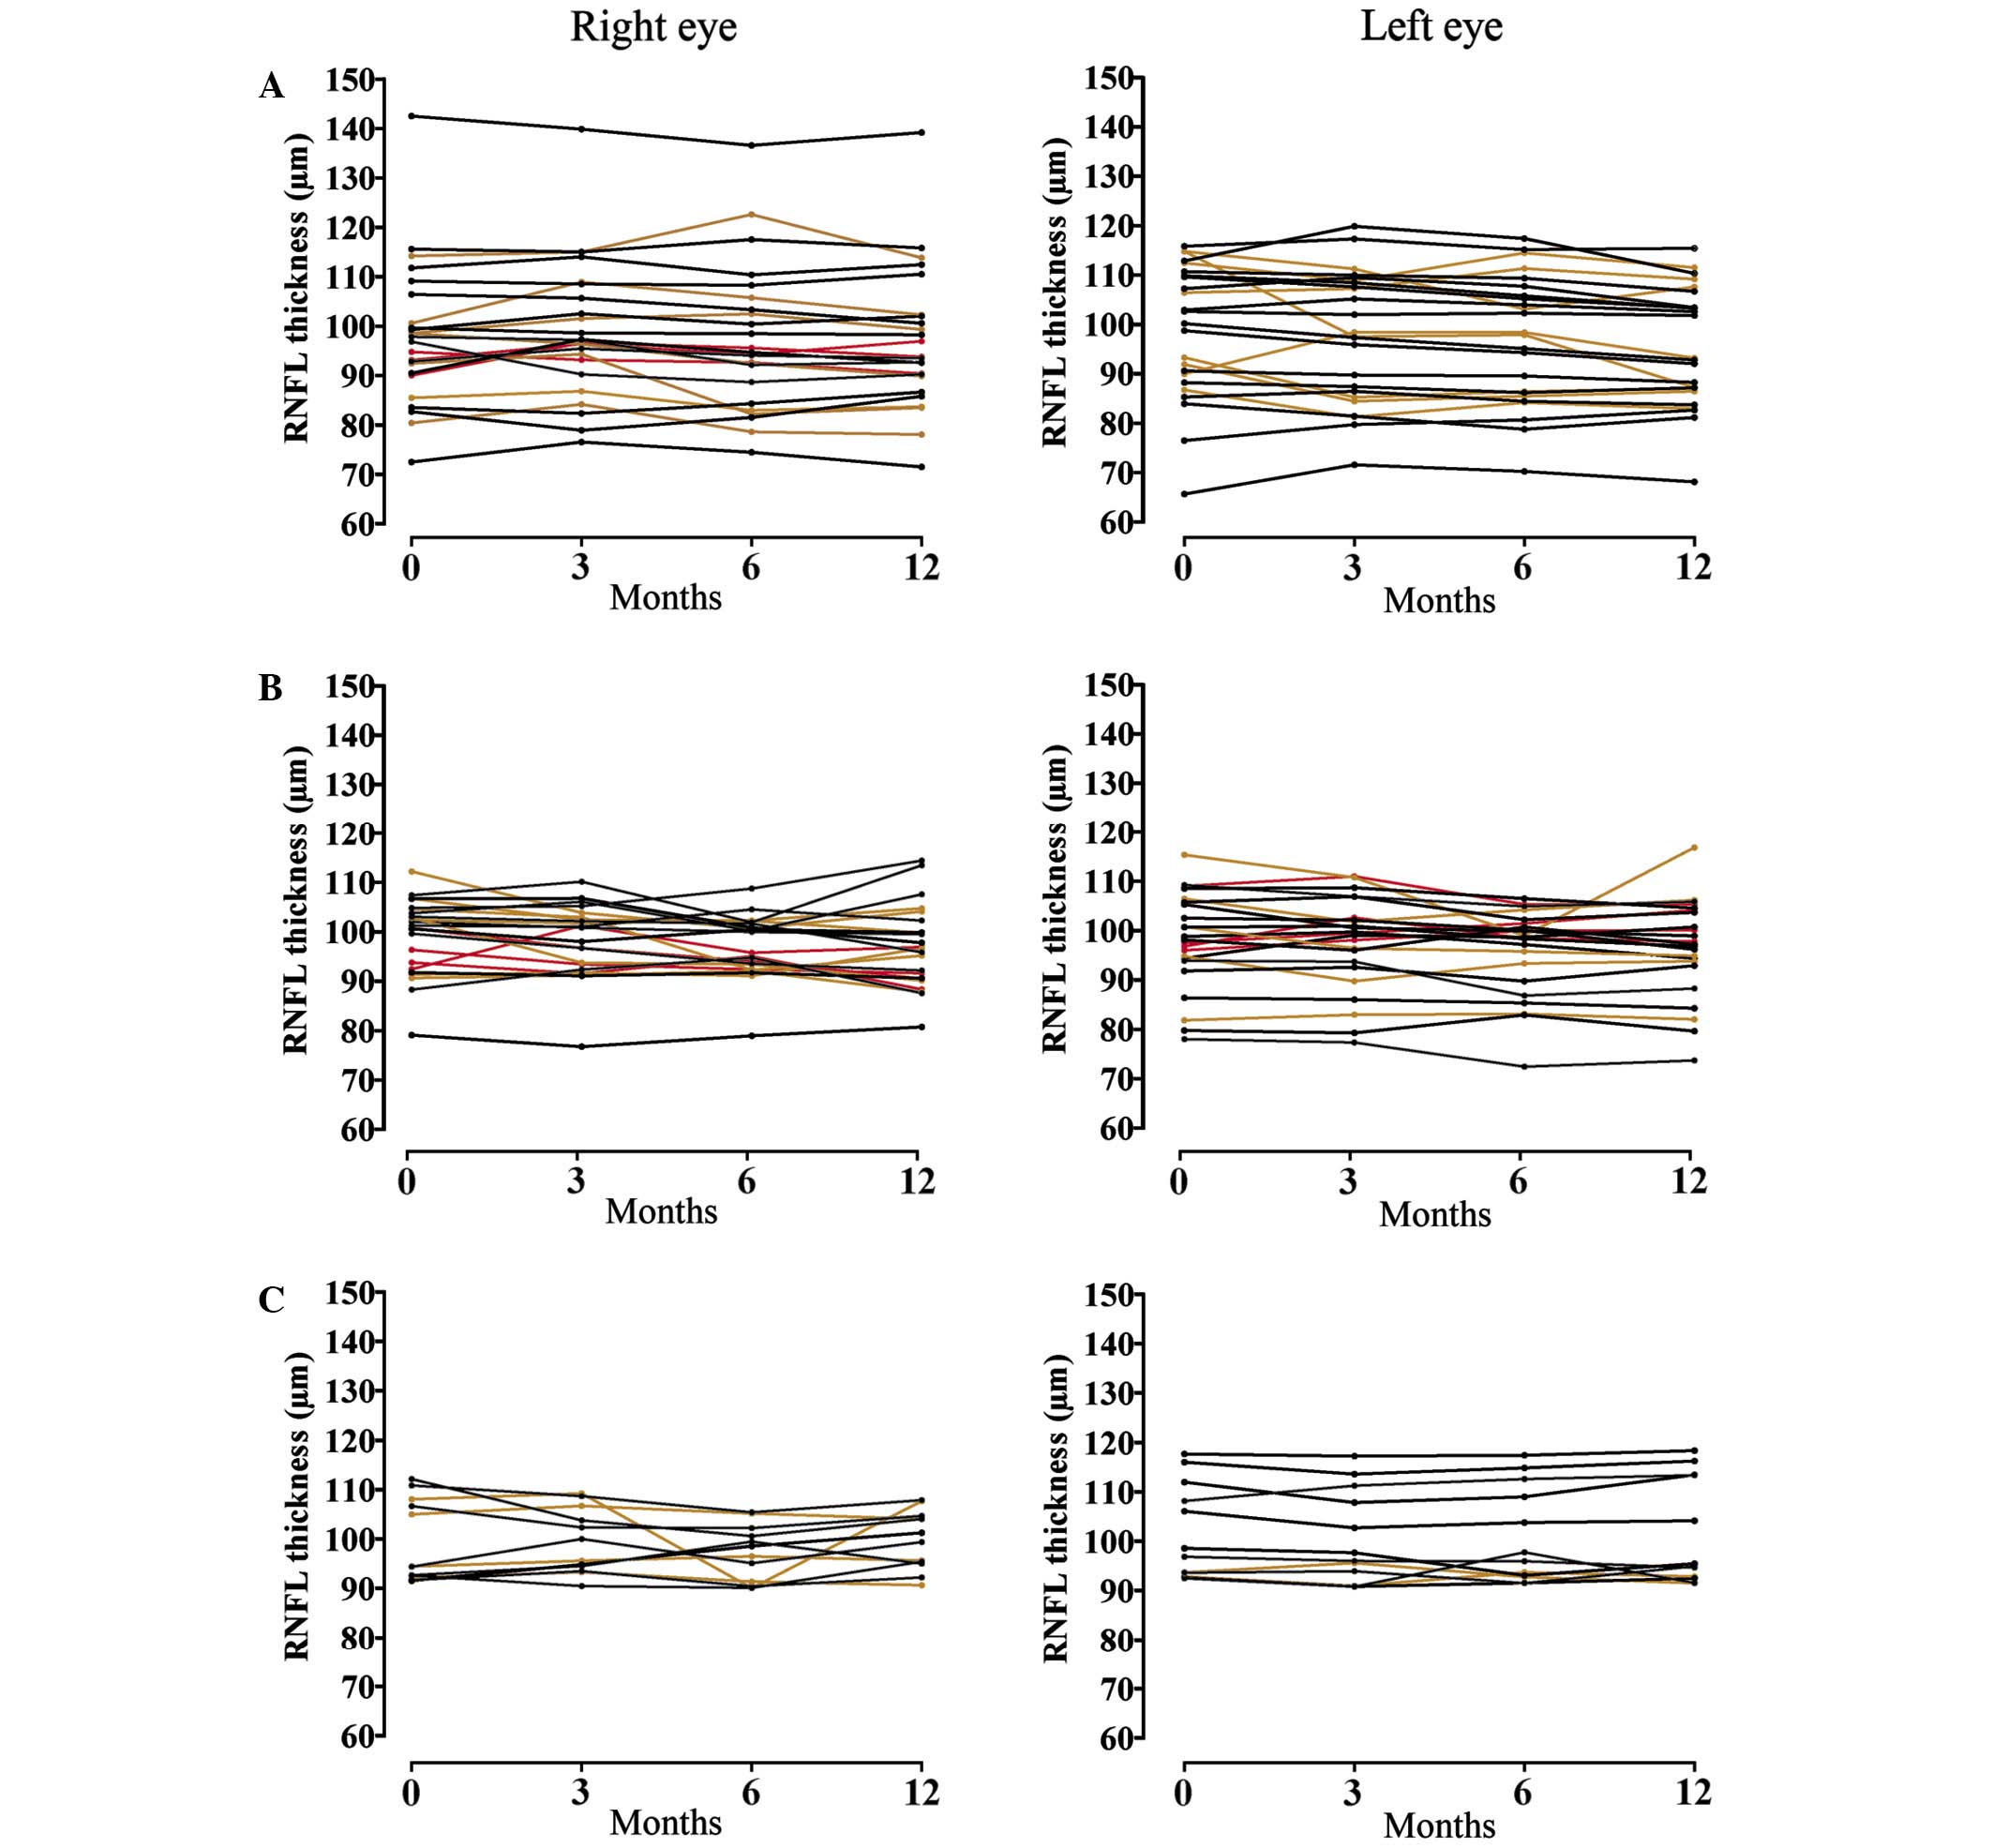
OCT scans were performed by more than one
ophthalmologist. Repeated RNFL data of healthy controls were used
to perform Bland-Altman analysis (data not shown). Prior to
Bland-Atman analysis, normal distribution of data were confirmed by
the Shapiro-Wilk test and relative and proportional bias were
excluded by one-sample t-test and linear regression, respectively
(data not shown). The Bland-Altman method is used to compare two
measurement techniques but it can also be applied to two
measurements obtained with the same technique (41). The resulting Bland-Altman plots
showed that 95% of the difference scores lie between the limits of
agreement as requested for this method (data not shown). The limits
of agreement revealed test-retest variability. Thus, intraclass
correlation coefficients (ICC) with a two-way mixed-effects model
for measures of absolute agreement as setting were assessed. The
obtained inter-rater ICC ranged between 0.89 and 0.97, indicating
the ‘sufficient’ consistency of the measurements. To estimate noise
by test-retest variation, single courses of repeated OCT values are
displayed in Fig. 1.
Results
Demographics and clinical
characteristics
The demographic details are summarized in Table I. The study analyzed 96 eyes from 48
patients with MS and 24 eyes from 12 healthy controls. The majority
of the participants were women: 80% in among the treated and
untreated MS groups and 66.7% in the control group. The mean and
median age of subjects was comparable between the two MS groups.
Although the EDSS score ranged between 1 and 4 in the untreated and
0 and 6 in the IFNβ-treated MS group, the mean and median EDSS was
almost identical in both MS groups. Subjects in the untreated group
had more relapses prior to study entry and significantly longer
disease duration (Mann-Whitney U test, P=0.0078, U=790.0). The mean
time since last relapse until study inclusion did not differ
significantly between both MS groups. During the study period, six
subjects suffered relapses in each MS group. Despite IFNβ
treatment, relapses occurred slightly more frequently in the
IFNβ-treated group (Tables I and
II). The patient history revealed
that 15 of the untreated and 18 of the IFNβ-treated MS patients
sustained ON (Table III). During
the study period, only two subjects suffered from ON and both of
them belonged to the group of untreated MS patients.
 | Table I.Demographic characteristics. |
Table I.
Demographic characteristics.
|
|
|
|
| Age (years) |
|---|
|
|
|
|
|
|
|---|
| Group | n | Female | Male | Mean | Minimum | Maximum | Median |
|---|
| Healthy
controls | 12 | 9 | 3 | 41.67±9.82 | 26 | 61 | 38.5 |
| Untreated MS | 24 | 20 | 4 | 46.46±11.09 | 29 | 69 | 47.0 |
| IFNβ-treated
MS | 24 | 20 | 4 | 45.63±10.54 | 28 | 63 | 47.5 |
| Table II.Clinical characteristics. |
Table II.
Clinical characteristics.
| Parameter | Untreated MS | IFNβ-treated
MS |
|---|
| Duration of IFNβ
treatment, years |
|
|
|
Mean | N/A | 2.6±3.1 |
|
Medium | N/A | 1 |
| EDSS |
|
|
|
Mean | 2.2±0.8 | 2.3±1.1 |
|
Medium | 2 | 2 |
| Disease duration,
years |
|
|
|
Mean | 13.6±9.8 | 8.3±6.0* |
|
Median | 10 | 8 |
| Relapses prior to
study, n |
|
|
|
Mean | 5.4±4.8 | 4.5±3.6 |
|
Medium | 5 | 3 |
| Time from last
relapse to study inclusion, years |
|
|
|
Mean | 1.8±2.3 | 1.6±2.1 |
|
Medium | 1 | 1 |
| Relapses during
study, n | 6 | 7 |
| Total subjects with
MS relapse, n | 6 | 6 |
| Table III.Measurements of the visual
system. |
Table III.
Measurements of the visual
system.
| Parameter | All MS
subjects | Untreated MS
subjects | IFNβ-treated MS
subjects | Healthy
controls |
|---|
| ON history |
|
|
Subjects with ON history, n
(%) | 15 (31.3) | 18
(37.5) | N/A |
|
| Last ON
prior to study, years (±SE) | 7.3 (±7.3) | 5.5 (±5.6) | N/A |
|
| ON
during study, n | 2 | 0 | N/A |
|
| Visual acuity,
(±SE) | 0.97 (±0.01) | 0.96 (±0.02) | 0.96 (±0.02) | 0.98 (±0.02) |
| With ON
history | 0.92 (±0.03) | 0.94 (±0.03) | 0.94 (±0.04) | N/A |
| Without
ON history | 0.98 (±0.02) | N/A |
|
|
|
Prolonged VEP latency | 0.94 (±0.03) | 0.98 (±0.01) | 0.92 (±0.06) | N/A |
| Normal
VEP latency | 0.99 (±0.01) | 0.97 (±0.02) | 0.99 (±0.01) | N/A |
| VEP latency, msec
(±SE) |
|
| Mean
P100 latency | 115.6
(±1.70)a | 116.3
(±2.44)a | 114.8
(±2.37)a | 103.0 (±1.28) |
| With ON
history | 119.7
(±2.29)a | 118.5
(±3.37)a | 120.6
(±3.06)a | N/A |
| Without
ON history | 114.0
(±1.71)a | 115.0
(±2.55)a | 112.6
(±2.14)a | N/A |
|
Prolonged latency | 123.8
(±1.82)a | 128.6
(±2.17)a | 128.0
(±2.64)a | N/A |
| Normal
latency | 111.1
(±1.14)a | 109.4
(±1.38)b | 108.4
(±1.36)b | N/A |
| VEP amplitude, µV
(±SE) |
|
| Mean
amplitude | 10.9 (±0.61) | 11.3 (±0.77) | 10.5 (±0.95) | 13.5 (±1.50) |
| With ON
history | 10.4 (±0.91) | 11.0 (±0.92) | 9.8
(±1.48) | N/A |
| Without
ON history | 10.6 (±0.51) | 11.0 (±0.83) | 10.2
(±0.58)c | N/A |
|
Prolonged latency | 9.8
(±0.60)c | 11.7 (±1.02) | 8.1
(±0.60)b | N/A |
| Normal
latency | 11.6 (±0.74) | 11.5 (±0.95) | 11.6 (±1.11) | N/A |
| RNFL thickness, µm
(±SEd) | 98.8/96.6
(±1.49/1.46) | 98.5/96.2
(±2.54/2.45) | 99.1/97.0
(±1.56/1.58) | 100.4/100.6
(±2.46/2.2) |
| With ON
history |
96.2/92.9c (±1.97/1.95) | 95.2/93.8
(±3.12/3.38) |
97.0/92.6c (±2.46/2.16) | N/A |
| Without
ON history | 100.1/98.5
(±1.65/1.62) | 100.1/97.4
(±2.79/2.62) | 100.1/99.3
(±1.68/1.68) | N/A |
|
Prolonged latency | 91.9b/89.7a (±1.95/1.71) | 88.9b/88.3 (±2.50/2.45) |
95.1/91.2b (±2.67/2.27) | N/A |
| Normal
latency | 102.3/100.3
(±1.52/1.69) | 103.3/100.1
(±2.46/2.75) | 101.4/99.9
(±1.58/1.69) | N/A |
RNFL thickness is decreased only in
the eyes of MS subjects with prolonged VEP latencies
As further analyses were conducted on paired data,
estimated marginal means were assessed using the GEE approach and
for pairwise comparisons (Table
III). In addition to IFNβ treatment or non-treatment, untreated
MS subjects were additionally grouped to those with/without ON and
those with/without prolonged VEP latency. The subgroup prolonged
VEP latency was selected as the ON history of each MS subject
partially coincided with prolonged VEP latencies. In total, 18 eyes
of the untreated (6 with prior ON history) and 14 eyes of the
IFNβ-treated MS subjects (10 with prior ON history) exhibited
prolonged VEP latencies at baseline.
Considering estimated marginal means, the visual
acuity did not significantly differ between all groups (Table III). As expected, MS subjects
exhibited longer P100 latencies of the VEP compared to healthy
controls (Table III). However, in
all subgroups there was no statistical difference in VEP latency
between IFNβ-treated and untreated MS subjects (Table III). Next, the amplitudes of the
P100 wave were compared between the groups. The VEP amplitudes
tended to be lower in the eyes of IFNβ-treated MS subjects, and
were significantly lower in cases with ON history or prolonged VEP
latency compared to VEP amplitudes obtained from healthy control
eyes (Table III). A statistical
difference in VEP amplitudes was detected between MS subjects with
prolonged and normal VEP latency (P<0.001). However, there was
no statistically significant difference in VEP amplitudes between
IFNβ-treated and untreated MS subjects in all subgroups (Table III).
Baseline and 12-month follow-up data for RNFL
thickness are shown in Table III.
Without classification to any subgroup, there was no difference in
the estimated marginal means of the RNFL thicknesses between
healthy control eyes and the eyes of MS subjects at baseline
(P=0.848). Similarly, no differences in RNFL thickness were
observed between healthy control eyes and the eyes of MS subjects
with or without ON history (GEE, P=0.375 and P=0.992,
respectively). Notably, eyes of MS subjects with prolonged VEP
latencies, in particular those of untreated MS subjects, exhibited
significantly lower RNFL thicknesses compared with healthy subjects
(GEE, P=0.007 and P=0.001, respectively). At the 12-month follow-up
OCT examination, a significantly lower RNFL thickness was detected
in the eyes of MS subjects with ON history compared with control
eyes. Again, there was no statistical difference in the RNFL
thicknesses between IFNβ-treated and untreated MS subjects.
IFNβ-treatment does not have an impact
on RNFL thinning
GEE model-based approaches were used for
investigation of covariates. The design of each model and results
are summarized in Tables IV and
V. The covariates age and total
number of (non-visual) relapses did not contribute significantly to
our GEE models (Table IV). MS
disease duration was strongly associated with the RNFL thickness
and each year was associated with an annual reduction in the RNFL
thickness by 0.61 µm (Table IV).
The regression coefficient B of the covariate time predicted a
monthly decrease in the RNFL thickness by 0.19 µm in eyes of MS
subjects, while this covariate was not predictive in healthy
control eyes (Table IV). A history
of ON was associated with lower RNFL thicknesses, while having no
ON history was associated with higher RNFL thicknesses (Table IV). Time was associated with a
monthly reduction in the RNFL thickness by 0.23 µm in cases with ON
history and 0.18 µm in MS subjects without ON history (Table IV).
| Table IV.Generalized analyses of different
covariates and their association with the RNFL thickness in the
healthy controls and entire MS cohort. |
Table IV.
Generalized analyses of different
covariates and their association with the RNFL thickness in the
healthy controls and entire MS cohort.
|
|
|
| 95% Wald CI |
|
|
|---|
|
|
|
|
|
|
|
|---|
| Parameter | B | SE | Lower | Upper | Wald
χ2 | P-value |
|---|
| Healthy control
subjects (n=24)a |
|
|
Intercept value | 111.21 | 4.03 |
14.14 |
29.95 | 230.70 |
<0.001 |
| Time
per month |
0.02 | 0.05 |
−0.08 |
0.11 |
0.10 |
0.754 |
| Age per
year |
−0.27 | 0.16 |
−0.58 |
0.05 |
2.81 |
0.090 |
| All MS subjects
(n=96)b |
|
|
Intercept value |
94.93 | 6.84 |
81.53 | 108.34 | 192.61 |
<0.001 |
| Time
per month |
−0.19 | 0.04 |
−0.28 |
−0.11 |
21.21 |
<0.001 |
| Age per
year |
0.18 | 0.17 |
−0.15 |
0.52 |
1.13 |
0.287 |
| Disease
duration per year |
−0.61 | 0.17 |
−0.95 |
−0.27 |
14.25 |
<0.001 |
| Total
relapses per relapse |
0.48 | 0.28 |
−0.07 |
1.03 |
2.89 |
0.089 |
| VEP latency and
amplitude of all subjects (n=120)c |
|
|
Intercept value |
118.95 | 8.13 | 103.01 | 134.88 | 214.00 |
<0.001 |
| VEP
latency per msec |
−0.21 | 0.07 |
−0.34 |
−0.07 |
9.22 |
0.002 |
| VEP
amplitude per µV |
0.29 | 0.10 |
−0.09 |
0.49 |
7.73 |
0.005 |
| ON history of MS
subjects (n=96)d |
|
|
Intercept value | 100.63 | 2.52 |
95.69 | 105.58 | 1,590.71 |
<0.001 |
| Group
with no ON history |
2.98 | 1.49 |
0.06 |
5.90 |
4.01 |
0.045 |
| Time
per month (no ON history) |
−0.18 | 0.05 |
−0.28 |
−0.08 |
12.76 |
<0.001 |
| Time
per month (ON history) |
−0.23 | 0.07 |
−0.37 |
−0.08 |
9.59 |
0.002 |
| ON vs.
ON history |
N/A | 1.49 |
0.05 |
5.88 |
3.96 |
0.046 |
| Prolonged VEP
latency of MS subjects (n=96)e |
|
|
Intercept value |
96.16 | 3.02 |
90.25 | 102.08 | 1,014.82 |
<0.001 |
| Normal
group |
7.99 | 2.00 |
4.07 |
11.91 |
15.94 |
<0.001 |
| Time
per month (normal) |
−0.20 | 0.05 |
−0.31 |
−0.10 |
15.00 |
<0.001 |
| Time
per month (prolonged) |
−0.18 | 0.06 |
−0.30 |
−0.06 |
8.67 |
0.003 |
|
Prolonged vs. normal |
N/A | 1.99 |
3.96 |
11.75 |
15.65 |
<0.001 |
| Table V.Generalized analyses of treatment
covariates and their association with the RNFL thickness;
allocation to treatment or no-treatment. |
Table V.
Generalized analyses of treatment
covariates and their association with the RNFL thickness;
allocation to treatment or no-treatment.
|
|
|
| 95% Wald CI |
|
|
|---|
|
|
|
|
|
|
|
|---|
| Parameter | B | SE | Lower | Upper | Wald
χ2 | P-value |
|---|
| All MS subjects
(n=96) |
|
|
Intercept value |
99.51 |
2.78 |
94.05 | 104.96 | 1,278.52 |
<0.001 |
| Group
with no treatment |
5.39 |
4.09 |
−2.63 |
13.41 |
1.74 |
0.188 |
| Time
per month (no treatment) |
−0.16 |
0.06 |
−0.32 |
−0.09 | 11.78 |
0.001 |
| Time
per month (treatment) |
−0.17 |
0.06 |
−0.30 |
−0.07 | 10.51 |
0.001 |
|
Treatment duration |
0.77 |
0.40 |
−0.08 |
1.55 |
3.77 |
0.052 |
| No
treatment vs. IFNβ treatment |
N/A |
4.10 |
−2.75 |
13.31 |
1.66 |
0.197 |
| MS subjects with ON
history (n=33) |
|
|
Intercept value | 123.18 | 14.04 |
95.66 | 150.69 | 76.99 |
<0.001 |
| Group
with no treatment |
2.04 |
5.43 |
−8.60 |
12.67 |
0.14 |
0.707 |
| Time
per month (no treatment) |
−0.02 |
0.11 |
−0.24 |
0.20 |
0.04 |
0.852 |
| Time
per month (treatment) |
−0.42 |
0.12 |
−0.66 |
−0.18 | 11.82 |
0.001 |
|
Treatment duration |
0.78 |
0.58 |
−0.35 |
1.92 |
1.84 |
0.175 |
| No
treatment vs. IFNβ treatment |
N/A |
5.48 |
−6.65 |
14.83 |
0.56 |
0.456 |
| MS subjects without
ON history (n=63) |
|
|
Intercept |
98.90 |
6.86 |
85.45 | 112.35 | 207.68 |
<0.001 |
| Group
with no treatment |
8.02 |
4.13 |
−0.87 |
16.12 |
3.76 |
0.053 |
| Time
per month (no treatment) |
−0.023 |
0.11 |
−0.45 |
−0.01 |
4.26 |
0.039 |
| Time
per month (treatment) |
−0.30 |
0.08 |
−0.20 |
0.14 |
0.013 |
0.723 |
|
Treatment duration |
0.95 |
0.44 |
0.09 |
1.81 |
4.64 |
0.031 |
| No
treatment vs. IFNβ treatment |
N/A |
4.08 |
−0.92 |
15.09 |
3.00 |
0.083 |
| MS subjects with
prolonged VEP latencies (n=32) |
|
|
Intercept value | 114.32 | 15.51 |
83.92 | 144.72 | 54.33 |
<0.001 |
| Group
with no treatment |
−4.35 |
6.37 | −16.83 |
8.14 |
0.47 |
0.495 |
| Time
per month (no treatment) |
−0.01 |
0.11 |
−0.20 |
0.22 |
0.02 |
0.903 |
| Time
per month (treatment) |
−0.42 |
0.12 |
−0.66 |
−0.18 | 11.38 |
0.001 |
|
Treatment duration |
0.66 |
0.60 |
−0.52 |
1.84 |
1.20 |
0.273 |
| No
treatment vs. IFNβ treatment |
N/A |
6.06 | −14.28 |
9.48 |
0.16 |
0.692 |
| MS subjects with
normal VEP latencies (n=64) |
|
|
Intercept value | 103.27 |
2.74 |
97.91 | 108.64 | 1,425.29 |
<0.001 |
| Group
with no treatment |
10.15 |
3.58 |
3.13 |
17.17 |
8.03 |
0.005 |
| Time
per month (no treatment) |
−0.30 |
0.08 |
−0.45 |
−0.15 | 14.71 |
0.000 |
| Time
per month (treatment) |
−0.12 |
0.06 |
−0.24 |
0.01 |
3.29 |
0.070 |
|
Treatment duration |
0.97 |
0.52 |
−0.06 |
2.00 |
3.43 |
0.064 |
| No
treatment vs. IFNβ treatment |
N/A |
3.29 |
1.89 |
14.79 |
6.42 |
0.011 |
Prolonged VEP latency was associated
with a reduction in the RNFL thickness by 7.99 µm
The covariate time, however, did not show an
appreciable difference in the regression coefficients between
subjects with and without prolonged VEP latency (Table IV). Comparison of the marginal means
confirmed significantly higher RNLF thickness values in MS subjects
without ON history (98.73±1.50 µm) or normal VEP latency
(100.53±1.32 µm) compared with those with ON history (95.75±1.71
µm) or prolonged P100 latency (92.55±1.97 µm) of the VEP,
respectively (Table IV).
In a second set of GEE analyses, we analyzed the
association between treatment and the RNFL thickness when
controlling for group (IFNβ treatment or no treatment) and
treatment duration. Time, disease duration, VEP latency and
amplitude were also entered in each model and the results are shown
in Table V. Considering all MS
subjects, no apparent difference was identified in the predicted
monthly decrease of the RNFL thickness. The decrease was estimated
to be 0.17 µm in case of IFNβ-treatment and 0.16 µm in case of no
treatment. Treatment duration and group allocation were not
significantly associated with the RNFL thickness, underlining that
treatment in general was not predictive for the RNFL thickness
(Table V). In subgroup analyses,
there were discrepant results. Accordingly, significant negative
associations were found for the covariate time in MS subjects
without ON and normal P100 latency of the VEP in case of no
treatment, while in case of treatment such associations were found
for MS subjects with ON and prolonged P100 latency of the VEP
(Table V). These findings may allude
to heterogeneity among our MS cohort. Notably, treatment duration
showed a significant positive association with the RNFL thickness,
but only in MS subjects without ON history. Furthermore, in this
subgroup group allocation did not reveal an association between
RNFL thickness and treatment (Table
V). In the subgroup of MS subjects with normal VEP latency,
comparison of the marginal means confirmed significantly higher
RNLF thickness values in untreated MS subjects (105.97±2.33 µm)
compared with IFNβ-treated subjects (97.63±1.72 µm) (Table V).
Inclusion of further longitudinal data (EDSS, two
and three second PASAT) in each of the above mentioned GEE models
did not result in any significant associations (data not shown).
Notably, since analysis of quadrant data using Stratus OCT is
highly prone to artefacts, particularly in longitudinal
measurements, and probably will to a certain extent reflect eye
position changes in subjects rather than actual measurement
differences, quadrant data were not analyzed.
Discussion
RNFL thickness is considered to be a relevant
parameter to infer axonal loss in patients with MS and/or ON.
Although stipulated in numerous studies, the number of longitudinal
studies and particularly those which investigated possible drug
effects on the RNFL in MS is limited (6,7,21). The study conducted by Talman et
al (42), which included 593
eyes, was among the first longitudinal OCT studies in MS patients.
Using a TD OCT, they observed a consistent decline in RNFL
thickness in the eyes of MS patients, even in those without history
of ON. Although in that study 87% of subjects were receiving
disease modifying therapies, treatments were not specified
(42). In another longitudinal study
(43), which included a total of 155
eyes, TD OCT was performed at two time points, with an interval of
one year. Treatment groups were well classified (IFNβ-1a, IFNβ-1b,
and glatiramer acetate); however, the number of study participants
per group was not stated. After a follow-up of one year, no
differences in RNFL loss were identified in treated compared with
the untreated MS subjects. With the exception of these two studies,
there are no other longitudinal OCT studies addressing the question
whether classical first-line treatment of MS (IFNβ and glatiramer
acetate) may impede RNFL thinning.
In the present study, GEE models were used to
identify significant associations between IFNβ treatment and the
peripapillary RNFL thicknesses obtained from four defined visits
over a period of one year. According to the present model-based
approach, the RNFL loss in the total MS cohort was estimated to be
0.16 µm per month of disease, which is consistent with the RNFL
loss observed in a previous study by Talman et al (42). Garcia-Martin et al (43), the authors of the aforementioned
second longitudinal study, have reported a reduction in RNFL
thickness of 3.48 µm per year. However, this discrepancy may be
ascribable to their different statistical approach, as the study by
Talman et al (42) and the
present study employed a GEE method adjusted for within-patient and
inter-eye correlations. In other longitudinal studies following
different objectives, RNFL thinning rates ranging between 0.3 and
4.6 µm per year in eyes of MS subjects have been reported (14,44–47).
Besides differences in statistical approaches, variations in the
rate of RNFL thinning may be explained by the composition of
cohorts, disease course and disease duration. The distinction
between benign (EDSS, ≤3; disease duration, ≥15 years) and
classical MS appears to play no role in the observed differences
(44). In the present study, the
monthly reduction in untreated MS subjects was predicted to be 0.16
and 0.17 µm in IFNβ-treated MS subjects. Treatment duration and
group allocation as independent and time-invariant covariates did
not reveal a significant association with RNFL thickness. Subgroup
analyses, however, provided disparate results, which was construed
as heterogeneity among the present MS cohort. However, none of
these analyses indicated that IFNβ treatment may have an impact on
the rate of RNFL loss.
According to Henderson et al (47), RNFL thinning is most probably not a
linear process. They speculate that there is more rapid RNFL loss
in earlier RRMS when subclinical inflammatory demyelination is
common and may involve the optic nerve, suggesting that the
dynamics of RNFL thinning may alter during the MS course (47). The lack of knowledge regarding the
time course of RNFL loss generally complicates the interpretation
of longitudinal OCT studies irrespective of whether time-domain or
newer generation of this device is used, such as spectral domain
OCT. It remains unclear whether this may have played a role in the
longitudinal OCT study of Serbecic et al (high resolution
spectral domain OCT, 27 subjects with RRMS and 10 subjects with
secondary progressive MS; observation period of ~two years) and
Henderson et al (TD OCT, 18 subjects with primary
progressive and 16 with secondary progressive MS, observation
period of ~18 months) (47,48). Measuring the RNFL loss following
acute ON would enable the study of a well-defined time frame of
pathology. Accordingly, Suehs et al examined changes in RNFL
thickness in subjects with clinically isolated syndrome manifested
as acute ON. However, at this rather early point of disease, they
did not detect any effect of IFNβ on RNFL thinning (32).
In a number of previous studies, as summarized in a
meta-analysis by Petzold et al (49), a clear RNFL reduction compared to
healthy controls has been reported. The present sample size is most
probably too small to detect such a difference and, in addition,
the majority of these previous studies enrolled MS subjects with
visual impairments, which may explain lower RNFL thicknesses in
their cohorts. The vast majority of MS subjects that were enrolled
in the present study had a stable visual acuity of 1.0, as assessed
using Landolt ring tests. This may explain higher RNFL thicknesses
and the lack of association between visual acuity and the RNFL
thickness in the present MS cohort. In general, visual acuity
testing appears to be a relatively insensitive measure of optic
nerve dysfunction in MS. Low-contrast visual acuity, visual field
testing, color vision, and stereopsis have been shown to more
effectively capture visual impairment among MS subjects (3,4,50,51). In
the present study, prolongation of the latency remained as a
functional surrogate marker, which elicited visual pathway
dysfunction. Furthermore, the eyes of MS subjects with prolonged
latencies exhibited lower RNFL thicknesses compared with healthy
control eyes and were associated with a strong RNFL reduction of
7.99 µm, indicating that demyelination is involved in promoting
axonal loss. In addition, both VEP parameters (i.e., amplitude and
P100 latency) revealed a significant association with the RNFL
thickness, corroborating the results of previous studies (2,52).
As expected, MS subjects with ON history exhibited
the highest rate in RNFL thinning, however, the predicted reduction
of 0.23 µm per month was slightly higher than in eyes without ON
history. Such a slight difference between eyes with and without ON
has been previously reported by Talman et al (42). In addition, Talman et al
observed that healthy control eyes also experience RNFL thinning,
which was estimated to be 0.49 µm over a 3-year period (28). The shorter duration of the present
study, the relatively small cohort size and the fact that the
structural changes in RNFL thickness may have been below the
detection limit of the TD OCT, may have played a role in not
detecting RNFL thinning in the control cohort.
Toledo et al (20) observed a marked correlation between
RNFL thickness and a visually dependent cognitive test (symbol
digit modality test), indicating that RNFL loss may reflect similar
pathological changes taking place in the brain. Among other
cognitive tests, Toledo et al identified a significant
correlation between the average RNFL thickness and the three second
PASAT. However, the authors did not focus on this result as they
did not detect a correlation with the thickness in the temporal
quadrant of the RNFL. In the present study, two and three second
PASAT was selected as a non-visual test, and no association was
detected with the RNFL thickness. Notably, visual dysfunction has
been shown to potentially impair test performance in visually
dependent cognitive tests, suggesting that those tests are more
likely to show correlation with RNFL parameters than non-visual
tests (53,54). It seems conceivable that this
association may also hold true in the other direction, i.e. decline
of visual test performance by cognitive impairment (55). The EDSS inadequately captures
dysfunction within the visual system, which may explain conflicting
results of a previous study (49).
No association between the EDSS and RNFL thickness was detected in
the present study.
Little is known about the effects of IFNβ on axonal
preservation. Increased neuronal survival in vitro and
increased nerve growth factor concentrations in glial and brain
cell cultures that were exposed to IFNβ have been reported
(56–58). Recently, IFNβ has been shown to
regulate genes involved in neuronal preservation, such as the
nuclear factor erythroid 2-related factor 2, and genes involved in
energy metabolism, such as the inhibition of IκB kinase (IKK) and
IKK-related kinases (59). A
previous clinical trial revealed an inconsistent impact of IFNβ on
general brain atrophy (60). A
reanalysis of the BEYOND study, which was a large, phase III,
clinical trial comparing IFNβ-1b treatment in two different doses
(250 and 500 µg) and glatiramer acetate, showed that IFNβ-1b
therapy was associated with a reduction in magnetic resonance
imaging-detected permanent black hole formation and evolution,
suggesting a possible neuroprotective effect (61). As black holes are multiple sclerosis
plaques detected in the chronic stage during axonal destruction,
they are indicative of neurodegeneration in MS (62). With respect to the RNFL, the present
data do not indicate that IFNβ is able to deter neurodegeneration,
although a neuroprotective effect by IFNβ therapy may be
conceivable by preventing optical relapses. MS subjects without ON
appear to be an ideal cohort for investigating the neuroprotective
properties of IFNβ on RNFL. However, it remains unclear whether
axonal loss in eyes without ON history is a result of several
episodes of subclinical ON or may be attributed to an unknown
mechanism of neurodegeneration. Reliable criteria to detect
subclinical ON have not yet been established.
In conclusion, over a period of one year no
significant association between IFNβ-1b treatment and RNFL thinning
was observed in MS subjects. The inherent limitation of this study
is the use of TD OCT, which has higher test-retest variability
compared with more recent spectral domain technology. Crucially,
measurement values from these different techniques are not
interchangeable (63). Longitudinal
studies that include a longer period are required not only to
examine treatment effects but also the dynamics of RNFL
thinning.
Acknowledgements
This study was financially supported by Bayer
HealthCare (Berlin, Deutschland) and is part of Mehdi Sadat's MD
thesis. For electrophysiological measurements, the authors thank
Ms. Mandy Wenzel, Ms. Madeleine Rambow, Ms. Patrizia Gerstenberger
and Ms. Claudia Wilmsmann (Department of Neurology, Hannover
Medical School). The authors thank Dr Jelena Skuljec for reviewing
this paper.
References
|
1.
|
Wirtschafter JD: Optic nerve axons and
acquired alterations in the appearance of the optic disc. Trans Am
Ophthalmol Soc. 81:1034–1091. 1983.PubMed/NCBI
|
|
2.
|
Trip SA, Schlottmann PG, Jones SJ, Altmann
DR, Garway-Heath DF, Thompson AJ, Plant GT and Miller DH: Retinal
nerve fiber layer axonal loss and visual dysfunction in optic
neuritis. Ann Neurol. 58:383–391. 2005. View Article : Google Scholar : PubMed/NCBI
|
|
3.
|
Fisher JB, Jacobs DA, Markowitz CE,
Galetta SL, Volpe NJ, Nano-Schiavi ML, Baier ML, Frohman EM,
Winslow H and Frohman TC: Relation of visual function to retinal
nerve fiber layer thickness in multiple sclerosis. Ophthalmology.
113:324–332. 2006. View Article : Google Scholar : PubMed/NCBI
|
|
4.
|
Costello F, Coupland S, Hodge W, Lorello
GR, Koroluk J, Pan YI, Freedman MS, Zackon DH and Kardon RH:
Quantifying axonal loss after optic neuritis with optical coherence
tomography. Ann Neurol. 59:963–969. 2006. View Article : Google Scholar : PubMed/NCBI
|
|
5.
|
Parisi V, Manni G, Spadaro M, Colacino G,
Restuccia R, Marchi S, Bucci MG and Pierelli F: Correlation between
morphological and functional retinal impairment in multiple
sclerosis patients. Invest Ophthalmol Vis Sci. 40:2520–2527.
1999.PubMed/NCBI
|
|
6.
|
Henderson AP, Trip SA, Schlottmann PG,
Altmann DR, Garway-Heath DF, Plant GT and Miller DH: An
investigation of the retinal nerve fibre layer in progressive
multiple sclerosis using optical coherence tomography. Brain.
131:277–287. 2008.PubMed/NCBI
|
|
7.
|
Pulicken M, Gordon-Lipkin E, Balcer LJ,
Frohman E, Cutter G and Calabresi PA: Optical coherence tomography
and disease subtype in multiple sclerosis. Neurology. 69:2085–2092.
2007. View Article : Google Scholar : PubMed/NCBI
|
|
8.
|
Ikuta F and Zimmerman HM: Distribution of
plaques in seventy autopsy cases of multiple sclerosis in the
United States. Neurology. 26:26–28. 1976. View Article : Google Scholar : PubMed/NCBI
|
|
9.
|
Toussaint D, Périer O, Verstappen A and
Bervoets S: Clinicopathological study of the visual pathways, eyes,
and cerebral hemispheres in 32 cases of disseminated sclerosis. J
Clin Neuroophthaloml. 3:211–220. 1983.
|
|
10.
|
Green AJ, McQuaid S, Hauser SL, Allen IV
and Lyness R: Ocular pathology in multiple sclerosis: Retinal
atrophy and inflammation irrespective of disease duration. Brain.
133:1591–1601. 2010. View Article : Google Scholar : PubMed/NCBI
|
|
11.
|
Jindahra P, Petrie A and Plant GT:
Retrograde trans-synaptic retinal ganglion cell loss identified by
optical coherence tomography. Brain. 132:628–634. 2009. View Article : Google Scholar : PubMed/NCBI
|
|
12.
|
Bridge H, Jindahra P, Barbur J and Plant
GT: Imaging reveals optic tract degeneration in hemianopia. Invest
Ophthalmol Vis Sci. 52:382–388. 2011. View Article : Google Scholar : PubMed/NCBI
|
|
13.
|
Cowey A, Alexander I and Stoerig P:
Transneuronal retrograde degeneration of retinal ganglion cells and
optic tract in hemianopic monkeys and humans. Brain. 134:2149–2157.
2011. View Article : Google Scholar : PubMed/NCBI
|
|
14.
|
Gabilondo I, Martínez-Lapiscina EH,
Martínez-Heras E, Fraga-Pumar E, Llufriu S, Ortiz S, Bullich S,
Sepulveda M, Falcon C, Berenguer J, et al: Trans-synaptic axonal
degeneration in the visual pathway in multiple sclerosis. Ann
Neurol. 75:98–107. 2014. View Article : Google Scholar : PubMed/NCBI
|
|
15.
|
Pfueller CF, Brandt AU, Schubert F, Bock
M, Walaszek B, Waiczies H, Schwenteck T, Dörr J, Bellmann-Strobl J,
Mohr C, et al: Metabolic changes in the visual cortex are linked to
retinal nerve fiber layer thinning in multiple sclerosis. PLoS One.
6:e180192011. View Article : Google Scholar : PubMed/NCBI
|
|
16.
|
Sinnecker T, Oberwahrenbrock T, Metz I,
Zimmermann H, Pfueller CF, Harms L, Ruprecht K, Ramien C, Hahn K,
Brück W, et al: Optic radiation damage in multiple sclerosis is
associated with visual dysfunction and retinal thinning - an
ultrahigh-field MR pilot study. Eur Radiol. 25:122–131. 2015.
View Article : Google Scholar : PubMed/NCBI
|
|
17.
|
Sepulcre J, Masdeu JC, Pastor MA, Goñi J,
Barbosa C, Bejarano B and Villoslada P: Brain pathways of verbal
working memory: A lesion-function correlation study. Neuroimage.
47:773–778. 2009. View Article : Google Scholar : PubMed/NCBI
|
|
18.
|
Audoin B, Fernando KT, Swanton JK,
Thompson AJ, Plant GT and Miller DH: Selective magnetization
transfer ratio decrease in the visual cortex following optic
neuritis. Brain. 129:1031–1039. 2006. View Article : Google Scholar : PubMed/NCBI
|
|
19.
|
Sepulcre J, Murie-Fernandez M,
Salinas-Alaman A, García-Layana A, Bejarano B and Villoslada P:
Diagnostic accuracy of retinal abnormalities in predicting disease
activity in MS. Neurology. 68:1488–1494. 2007. View Article : Google Scholar : PubMed/NCBI
|
|
20.
|
Toledo J, Sepulcre J, Salinas-Alaman A,
García-Layana A, Murie-Fernandez M, Bejarano B and Villoslada P:
Retinal nerve fiber layer atrophy is associated with physical and
cognitive disability in multiple sclerosis. Mult Scler. 14:906–912.
2008. View Article : Google Scholar : PubMed/NCBI
|
|
21.
|
Gordon-Lipkin E, Chodkowski B, Reich DS,
Smith SA, Pulicken M, Balcer LJ, Frohman EM, Cutter G and Calabresi
PA: Retinal nerve fiber layer is associated with brain atrophy in
multiple sclerosis. Neurology. 69:1603–1609. 2007. View Article : Google Scholar : PubMed/NCBI
|
|
22.
|
Grazioli E, Zivadinov R, Weinstock-Guttman
B, Lincoff N, Baier M, Wong JR, Hussein S, Cox JL, Hojnacki D and
Ramanathan M: Retinal nerve fiber layer thickness is associated
with brain MRI outcomes in multiple sclerosis. J Neurol Sci.
268:12–17. 2008. View Article : Google Scholar : PubMed/NCBI
|
|
23.
|
Siger M, Dziegielewski K, Jasek L, Bieniek
M, Nicpan A, Nawrocki J and Selmaj K: Optical coherence tomography
in multiple sclerosis: Thickness of the retinal nerve fiber layer
as a potential measure of axonal loss and brain atrophy. J Neurol.
255:1555–1560. 2008. View Article : Google Scholar : PubMed/NCBI
|
|
24.
|
Saidha S, Sotirchos ES, Oh J, Syc SB,
Seigo MA, Shiee N, Eckstein C, Durbin MK, Oakley JD, Meyer SA, et
al: Relationships between retinal axonal and neuronal measures and
global central nervous system pathology in multiple sclerosis. JAMA
Neurol. 70:34–43. 2013. View Article : Google Scholar : PubMed/NCBI
|
|
25.
|
Dörr J, Wernecke KD, Bock M, Gaede G,
Wuerfel JT, Pfueller CF, Bellmann-Strobl J, Freing A, Brandt AU and
Friedemann P: Association of retinal and macular damage with brain
atrophy in multiple sclerosis. PLoS One. 6:e181322011. View Article : Google Scholar : PubMed/NCBI
|
|
26.
|
Zimmermann H, Freing A, Kaufhold F, Gaede
G, Bohn E, Bock M, Oberwahrenbrock T, Young KL, Dörr J, Wuerfel JT,
et al: Optic neuritis interferes with optical coherence tomography
and magnetic resonance imaging correlations. Mult Scler.
19:443–450. 2013. View Article : Google Scholar : PubMed/NCBI
|
|
27.
|
The IFNβ Multiple Sclerosis Study Group:
Interferon beta-1b is effective in relapsing-remitting multiple
sclerosis. I. Clinical results of a multicenter, randomized,
double-blind, placebo-controlled trial. Neurology. 43:655–661.
1993. View Article : Google Scholar : PubMed/NCBI
|
|
28.
|
Jacobs LD, Cookfair DL, Rudick RA, Herndon
RM, Richert JR, Salazar AM, Fischer JS, Goodkin DE, Granger CV,
Simon JH, et al: The Multiple Sclerosis Collaborative Research
Group (MSCRG): Intramuscular interferon beta-1a for disease
progression in relapsing multiple sclerosis. Ann Neurol.
39:285–294. 1996. View Article : Google Scholar : PubMed/NCBI
|
|
29.
|
Ebers GC: PRISMS Study Group: Randomised
double-blind placebo-controlled study of interferon beta-1a in
relapsing/remitting multiple sclerosis. PRISMS (Prevention of
Relapses and Disability by Interferon beta-1a Subcutaneously in
Multiple Sclerosis) Study Group. Lancet. 352:1498–1504. 1998.
View Article : Google Scholar : PubMed/NCBI
|
|
30.
|
Goodin DS, Traboulsee A, Knappertz V,
Reder AT, Li D, Langdon D, Wolf C, Beckmann K, Konieczny A and
Ebers GC: 16-Year Long Term Follow-up Study Investigators:
Relationship between early clinical characteristics and long term
disability outcomes: 16 year cohort study (follow-up) of the
pivotal interferon β-1b trial in multiple sclerosis. J Neurol
Neurosurg Psychiatry. 83:282–287. 2012. View Article : Google Scholar : PubMed/NCBI
|
|
31.
|
Ebers GC, Traboulsee A, Li D, Langdon D,
Reder AT, Goodin DS, Bogumil T, Beckmann K, Wolf C and Konieczny A:
Investigators of the 16-year Long-Term Follow-Up Study: Analysis of
clinical outcomes according to original treatment groups 16 years
after the pivotal IFNB-1b trial. J Neurol Neurosurg Psychiatry.
81:907–912. 2010. View Article : Google Scholar : PubMed/NCBI
|
|
32.
|
Sühs KW, Hein K, Pehlke JR,
Käsmann-Kellner B and Diem R: Retinal nerve fibre layer thinning in
patients with clinically isolated optic neuritis and early
treatment with interferon-beta. PLoS One. 7:e516452012. View Article : Google Scholar : PubMed/NCBI
|
|
33.
|
Tugcu B, Soysal A, Kilic M, Yuksel B, Kale
N, Yigit U and Arpaci B: Assessment of structural and functional
visual outcomes in relapsing remitting multiple sclerosis with
visual evoked potentials and optical coherence tomography. J Neurol
Sci. 335:182–185. 2013. View Article : Google Scholar : PubMed/NCBI
|
|
34.
|
Polman CH, Reingold SC, Edan G, Filippi M,
Hartung HP, Kappos L, Lublin FD, Metz LM, McFarland HF, O'Connor
PW, et al: Diagnostic criteria for multiple sclerosis: 2005
revisions to the ‘McDonald Criteria’. Ann Neurol. 58:840–846. 2005.
View Article : Google Scholar : PubMed/NCBI
|
|
35.
|
Schippling S, Balk LJ, Costello F,
Albrecht P, Balcer L, Calabresi PA, Frederiksen JL, Frohman E,
Green AJ, Klistorner A, et al: Quality control for retinal OCT in
multiple sclerosis: Validation of the OSCAR-IB criteria. Mult
Scler. 21:163–170. 2015. View Article : Google Scholar : PubMed/NCBI
|
|
36.
|
Tewarie P, Balk L, Costello F, Green A,
Martin R, Schippling S and Petzold A: The OSCAR-IB consensus
criteria for retinal OCT quality assessment. PLoS One.
7:e348232012. View Article : Google Scholar : PubMed/NCBI
|
|
37.
|
Fan Q, Teo YY and Saw SM: Application of
advanced statistics in ophthalmology. Invest Ophthalmol Vis Sci.
52:6059–6065. 2011. View Article : Google Scholar : PubMed/NCBI
|
|
38.
|
Zeger SL and Liang KY: Longitudinal data
analysis for discrete and continuous outcomes. Biometrics.
42:121–130. 1986. View Article : Google Scholar : PubMed/NCBI
|
|
39.
|
Mancl LA and DeRouen TA: A covariance
estimator for GEE with improved small-sample properties.
Biometrics. 57:126–134. 2001. View Article : Google Scholar : PubMed/NCBI
|
|
40.
|
Højsgaard S, Halekoh U and Yan J: The R
Package geepack for Generalized Estimating Equations. J Stat Softw.
15:1–11. 2006.
|
|
41.
|
Araie M: Test-retest variability in
structural parameters measured with glaucoma imaging devices. Jpn J
Ophthalmol. 57:1–24. 2013. View Article : Google Scholar : PubMed/NCBI
|
|
42.
|
Talman LS, Bisker ER, Sackel DJ, Long DA
Jr, Galetta KM, Ratchford JN, Lile DJ, Farrell SK, Loguidice MJ,
Remington G, et al: Longitudinal study of vision and retinal nerve
fiber layer thickness in multiple sclerosis. Ann Neurol.
67:749–760. 2010.PubMed/NCBI
|
|
43.
|
García-Martín E, Pueyo V, Fernández J,
Almárcegui C, Dolz I, Martín J, Ara JR and Honrubia FM: Atrophy of
the retinal nerve fibre layer in multiple sclerosis patients.
Prospective study with two years follow-up. Arch Sociedad Esp
Oftalmol. 85:179–186. 2010.(In Spanish). View Article : Google Scholar
|
|
44.
|
Galetta KM, Graves J, Talman LS, Lile DJ,
Frohman EM, Calabresi PA, Galetta SL and Balcer LJ: Visual pathway
axonal loss in benign multiple sclerosis: A longitudinal study. J
Neuroophthalmol. 32:116–123. 2012. View Article : Google Scholar : PubMed/NCBI
|
|
45.
|
Kimbrough DJ, Sotirchos ES, Wilson JA,
Al-Louzi O, Conger A, Conger D, Frohman TC, Saidha S, Green AJ,
Frohman EM, et al: Retinal damage and vision loss in African
American multiple sclerosis patients. Ann Neurol. 77:228–236. 2015.
View Article : Google Scholar : PubMed/NCBI
|
|
46.
|
Waubant E, Maghzi AH, Revirajan N, Spain
R, Julian L, Mowry EM, Marcus J, Liu S, Jin C, Green A, et al: A
randomized controlled phase II trial of riluzole in early multiple
sclerosis. Ann Clin Transl Neurol. 1:340–347. 2014. View Article : Google Scholar : PubMed/NCBI
|
|
47.
|
Henderson AP, Trip SA, Schlottmann PG,
Altmann DR, Garway-Heath DF, Plant GT and Miller DH: A preliminary
longitudinal study of the retinal nerve fiber layer in progressive
multiple sclerosis. J Neurol. 257:1083–1091. 2010. View Article : Google Scholar : PubMed/NCBI
|
|
48.
|
Serbecic N, Aboul-Enein F, Beutelspacher
SC, Vass C, Kristoferitsch W, Lassmann H, Reitner A and
Schmidt-Erfurth U: High resolution spectral domain optical
coherence tomography (SD-OCT) in multiple sclerosis: The first
follow up study over two years. PLoS One. 6:e198432011. View Article : Google Scholar : PubMed/NCBI
|
|
49.
|
Petzold A, de Boer JF, Schippling S,
Vermersch P, Kardon R, Green A, Calabresi PA and Polman C: Optical
coherence tomography in multiple sclerosis: A systematic review and
meta-analysis. Lancet Neurol. 9:921–932. 2010. View Article : Google Scholar : PubMed/NCBI
|
|
50.
|
Sobaci G, Demirkaya S, Gundogan FC and
Mutlu FM: Stereoacuity testing discloses abnormalities in multiple
sclerosis without optic neuritis. J Neuroophthalmol. 29:197–202.
2009. View Article : Google Scholar : PubMed/NCBI
|
|
51.
|
Villoslada P, Cuneo A, Gelfand J, Hauser
SL and Green A: Color vision is strongly associated with retinal
thinning in multiple sclerosis. Mult Scler. 18:991–999. 2012.
View Article : Google Scholar : PubMed/NCBI
|
|
52.
|
Almarcegui C, Dolz I, Pueyo V, Garcia E,
Fernandez FJ, Martin J, Ara JR and Honrubia F: Correlation between
functional and structural assessments of the optic nerve and retina
in multiple sclerosis patients. Clin Neurophysiol. 40:129–135.
2010. View Article : Google Scholar
|
|
53.
|
Davis AS, Hertza J, Williams RN, Gupta AS
and Ohly JG: The influence of corrected visual acuity on visual
attention and incidental learning in patients with multiple
sclerosis. Appl Neuropsychol. 16:165–168. 2009. View Article : Google Scholar : PubMed/NCBI
|
|
54.
|
Bruce JM, Bruce AS and Arnett PA: Mild
visual acuity disturbances are associated with performance on tests
of complex visual attention in MS. J Int Neuropsychol Soc.
13:544–548. 2007. View Article : Google Scholar : PubMed/NCBI
|
|
55.
|
Wieder L, Gäde G, Pech LM, Zimmermann H,
Wernecke KD, Dörr JM, Bellmann-Strobl J, Paul F and Brandt AU: Low
contrast visual acuity testing is associated with cognitive
performance in multiple sclerosis: A cross-sectional pilot study.
BMC Neurol. 13:1672013. View Article : Google Scholar : PubMed/NCBI
|
|
56.
|
Boutros T, Croze E and Yong VW:
Interferon-beta is a potent promoter of nerve growth factor
production by astrocytes. J Neurochem. 69:939–946. 1997. View Article : Google Scholar : PubMed/NCBI
|
|
57.
|
Biernacki K, Antel JP, Blain M, Narayanan
S, Arnold DL and Prat A: Interferon beta promotes nerve growth
factor secretion early in the course of multiple sclerosis. Arch
Neurol. 62:563–568. 2005. View Article : Google Scholar : PubMed/NCBI
|
|
58.
|
Jin S, Kawanokuchi J, Mizuno T, Wang J,
Sonobe Y, Takeuchi H and Suzumura A: Interferon-beta is
neuroprotective against the toxicity induced by activated
microglia. Brain Res. 1179:140–146. 2007. View Article : Google Scholar : PubMed/NCBI
|
|
59.
|
Croze E, Yamaguchi KD, Knappertz V, Reder
AT and Salamon H: Interferon-beta-1b-induced short- and long-term
signatures of treatment activity in multiple sclerosis.
Pharmacogenomics J. 13:443–451. 2013. View Article : Google Scholar : PubMed/NCBI
|
|
60.
|
Zivadinov R, Reder AT, Filippi M, Minagar
A, Stüve O, Lassmann H, Racke MK, Dwyer MG, Frohman EM and Khan O:
Mechanisms of action of disease-modifying agents and brain volume
changes in multiple sclerosis. Neurology. 71:136–144. 2008.
View Article : Google Scholar : PubMed/NCBI
|
|
61.
|
Filippi M, Rocca MA, Camesasca F, Cook S,
O'Connor P, Arnason BG, Kappos L, Goodin D, Jeffery D, Hartung HP,
et al: Interferon β-1b and glatiramer acetate effects on permanent
black hole evolution. Neurology. 76:1222–1228. 2011. View Article : Google Scholar : PubMed/NCBI
|
|
62.
|
Sahraian MA, Radue EW, Haller S and Kappos
L: Black holes in multiple sclerosis: Definition, evolution, and
clinical correlations. Acta Neurol Scand. 122:1–8. 2010. View Article : Google Scholar : PubMed/NCBI
|
|
63.
|
Bock M, Brandt AU, Dörr J, Pfueller CF,
Ohlraun S, Zipp F and Paul F: Time domain and spectral domain
optical coherence tomography in multiple sclerosis: A comparative
cross-sectional study. Mult Scler. 16:893–896. 2010. View Article : Google Scholar : PubMed/NCBI
|