Introduction
Graves' ophthalmopathy (GO) is an autoimmune disease
that accounts for 15–28% of unilateral exophthalmos and 80% of
bilateral exophthalmos (1,2). In the early stage, patients with GO
commonly complain of photophobia, excess tearing, grittiness and
foreign-body sensations. Previous studies have indicated that the
occurrence of these symptoms is associated with a widened vertical
palpebral fissure and increased degree of exophthalmos (3,4). The
changes of these anatomic parameters may accelerate the evaporation
of tears, and subsequently lead to ocular surface damage and the
occurrence of associated symptoms (3,4).
However, decreased secretion of tears due to lacrimal gland
involvement in patients with GO has also been viewed as a potential
cause of associated symptoms in a number of studies (5–7).
Therefore, certain researchers have transferred their focus to the
lacrimal gland, in attempts to clarify the morphological or
functional changes of the lacrimal gland in patients with GO.
Previously, computed tomography (CT) imaging-based
studies conducted by Harris et al (8) and Bingham et al (9) found that the morphological measurements
of the lacrimal gland in patients with GO were significantly larger
than those of healthy controls, which could assist in the diagnosis
of GO. However, due to the lower soft tissue resolution and use of
ionizing radiation, CT has been almost completely replaced by
magnetic resonance (MR) imaging in the imaging examination of
patients with GO. In addition, besides the diagnosis, the accurate
staging of GO patients is also very important, considering that
different treatment strategies are required for patients with
active and inactive GO (10–12). However, studies focusing on
quantitative measurements of the lacrimal gland in the staging of
GO patients have been lacking.
Therefore, the present study aimed to determine the
efficacy of quantitative measurements of the lacrimal gland in the
diagnosis and staging of patients with GO, on the basis of 3-T MR
imaging.
Materials and methods
Patients
The protocol of this retrospective study was
reviewed and approved by the institutional review board of the
First Affiliated Hospital of Nanjing Medical University (Nanjing,
China). The requirement for written informed consent was waived due
to the retrospective nature of the study. A retrospective review of
the institution's database identified 38 consecutive patients with
GO who had undergone MR imaging examination for pretreatment
evaluation from June 2013 to December 2014. Among these patients,
33 patients (mean age, 48.4±13.9 years; male/female ratio, 12:21)
were finally enrolled in the study based on the following inclusion
criteria: i) Fulfillment of the criteria of the European Group on
Graves' Orbitopathy (EUGOGO) for the diagnosis of GO (13); ii) no prior history of steroid
therapy, radiotherapy or surgical decompression; and iii) adequate
image quality for imaging assessment. All 33 GO patients had
bilateral orbits involved, with a mean disease duration of 7 months
(range, 1–24 months).
The assessment of disease activity was performed
according to the modified seven-point formulation of the clinical
activity score (CAS) (14),
including: i) Spontaneous retrobulbar pain; ii) pain on attempted
up or down gaze; iii) redness of the eyelids; iv) redness of the
conjunctiva; v) swelling of the eyelids; vi) inflammation of the
caruncle and/or plica; and vii) conjunctival edema. The CAS is the
sum of all items present, and assessment of disease activity was
performed for each eye individually. Following assessment by an
experienced endocrinologist, eyes with a CAS of ≥3 were accepted
into the active stage group; otherwise, they were accepted into the
inactive stage group. Finally, a total of 26 eyes were defined as
active with a mean CAS of 4±1; the other 40 eyes were defined as
inactive with a mean CAS of 1±1. In addition, 24 healthy volunteers
(mean age, 50.0±12.9 years; male/female ratio, 8:16) were included
in the healthy control (HC) group.
MR examination
MR examinations were performed with a 3-T MR scanner
(Verio; Siemens Healthcare GmbH, Erlangen, Germany) with a
12-channel head coil. Imaging protocols comprises axial T1-weighted
imaging [repetition time (TR)/echo time (TE), 600/10 msec], axial,
coronal and sagittal T2-weighted imaging (TR/TE, 3,500–4,000/79
msec) with fat suppression (FS). The other detailed imaging
parameters were as follows: Field of view (FOV), 200 mm; matrix,
384×384; slice thickness, 3 mm; gap, 0 mm.
Imaging processing
Due to the difficulty in distinguishing palpebral
from orbital lobes on MR imaging, the lacrimal gland was viewed as
a whole entity during the measurement (15,16).
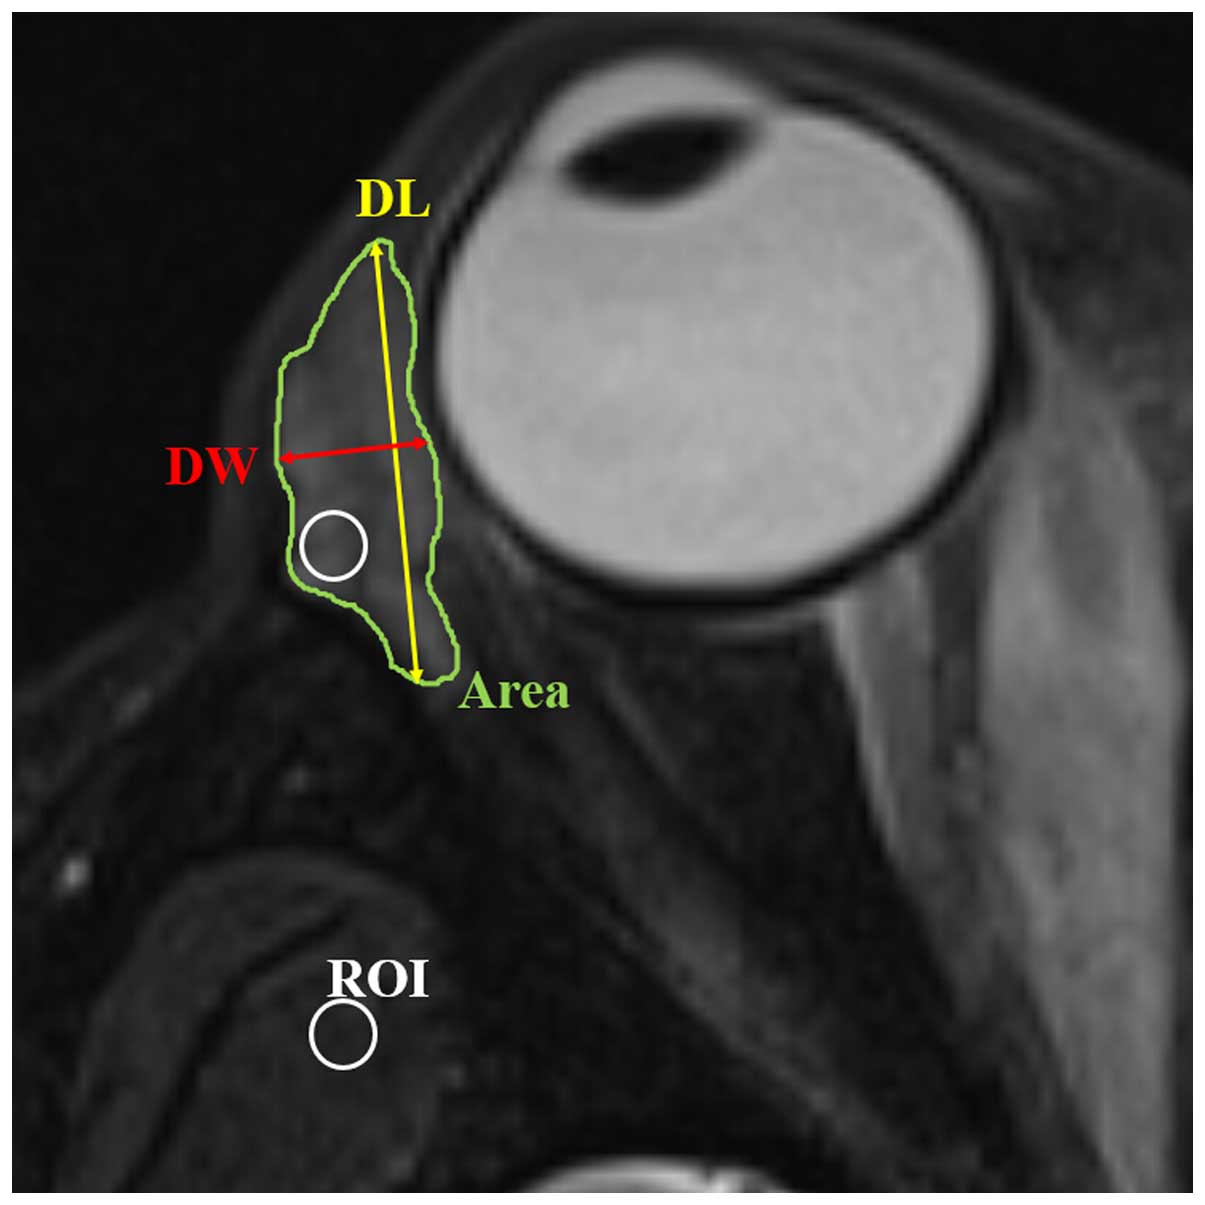
Quantitative measurements of the lacrimal gland were performed
based on both coronal and axial T2-weighted imaging with FS, and
the parameters included: i) Axial and coronal length, width and
largest area of the lacrimal gland: according to the methods of
Huang et al (16), the axial
and coronal image in which the lacrimal gland appeared the largest
was chosen. The axial and coronal largest areas of lacrimal gland
were obtained using an operator-defined region of interest (ROI)
approach (Figs. 1 and 2). The axial length of the lacrimal gland
was defined from the most anterior tip to the most posterior tip.
The axial width was measured from the lateral edge to the medial
edge at its widest point perpendicular to the length line on the
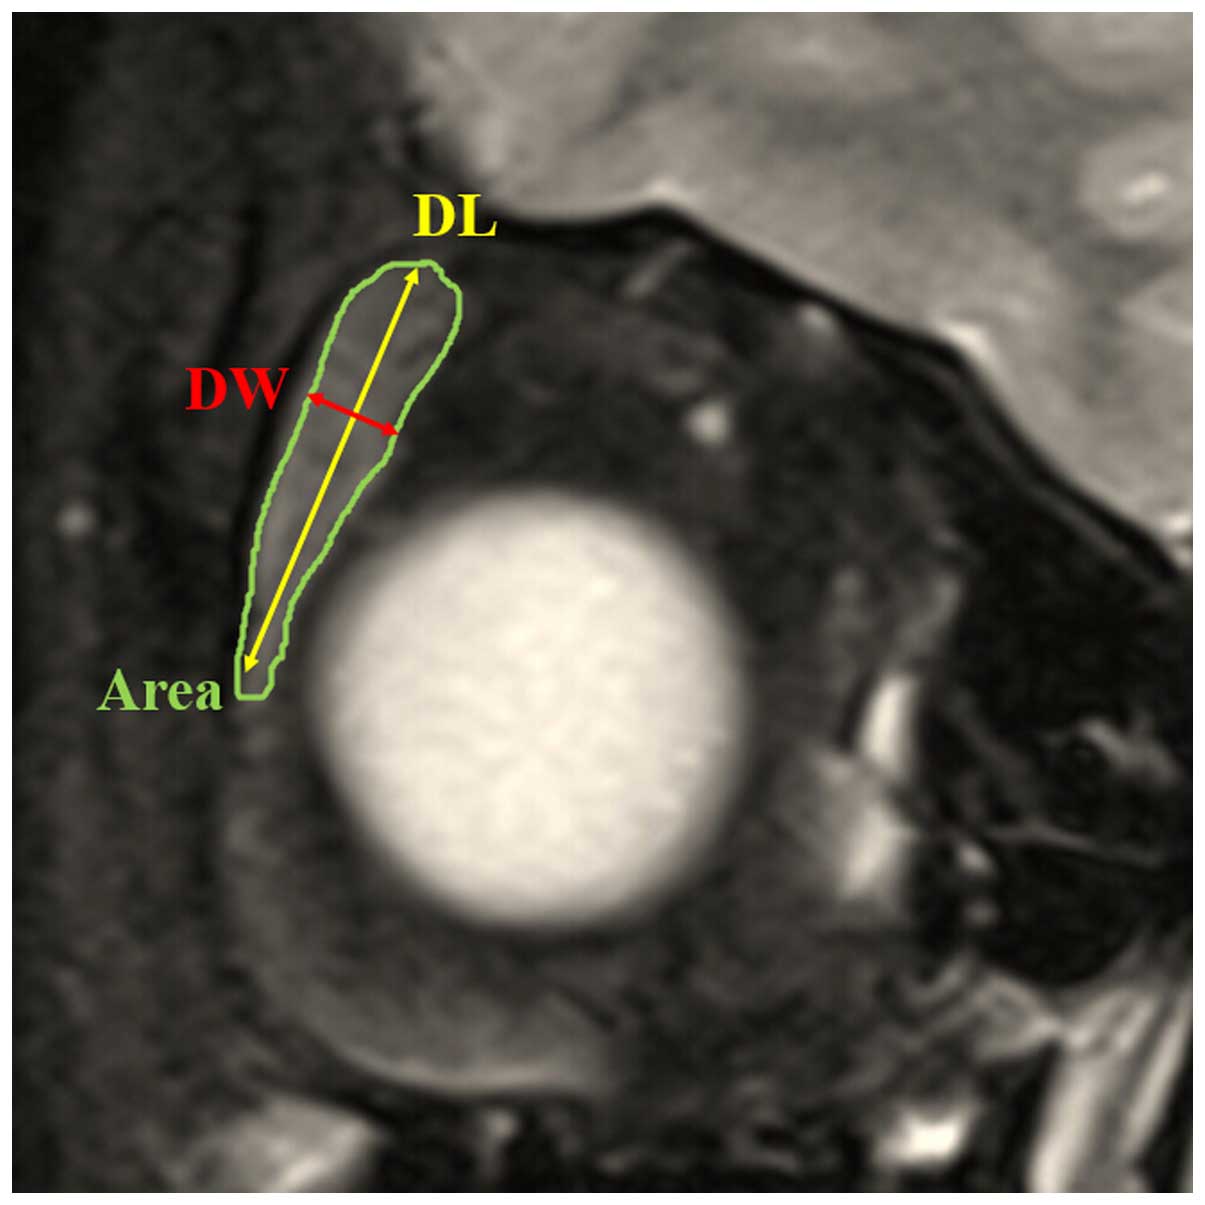
axial images (Fig. 1). The coronal
length of the lacrimal gland was defined from the superior tip to
the inferior tip. The coronal width of the lacrimal gland was
measured from the lateral edge to the medial edge at its widest
point perpendicular to the length line on the coronal images
(Fig. 2). ii) Volume of lacrimal
gland: Following the delineation of the border of lacrimal gland in
each section on the axial images, the gland volume was obtained
from the sum of the areas multiplied by the slice interval
(Fig. 1). iii) Signal intensity
ratio (SIR) of the lacrimal gland to the ipsilateral temporal
muscle: The SIR was calculated based on signal intensity (SI) from
fat-suppressed T2-weighted imaging, using the following formula:
SIR = SIlacrimal gland/SIipsilateral
temporal muscle. The SI of the lacrimal gland and the
adjacent ipsilateral temporal muscle was measured using a ‘hotspot’
ROI method (17). The ‘hotspot’ ROI
method meant that the area of the ROI was almost 10–15% of the
whole cross-sectional area of the lacrimal gland (Fig. 1). The ROI placed on the lacrimal
gland demonstrated the portion having a relatively higher signal
intensity.
A previous study indicated that there is no metrical
difference between the left and right lacrimal gland of healthy
control subjects (15); therefore,
quantitative data of bilateral lacrimal glands in the control group
were analyzed together in the present study. The quantitative
measurements were performed independently by two neuroradiologists
(with 3 and 15 years of experience, respectively), and the mean
values of their measurements were used for further statistical
analysis.
Statistical analysis
Interobserver agreements between the two
radiologists' measurements were assessed using the intraclass
correlation coefficient (ICC). Numerical data were averaged and
reported as means ± standard deviation. The Kolmogorov-Smirnov's
test was performed to determine whether the quantitative parameters
were normally distributed. The Student's t-test and
Chi-square test were performed to compare the differences of age
and gender between GO and HC groups. The Student's t-test
was performed to compare all the quantitative measurements of the
lacrimal gland between the GO and HC groups, or between active and
inactive GO groups. Receiver operating characteristic (ROC)
analyses were further used to evaluate the diagnostic value of the
significant parameters in discriminating patients with GO from
healthy controls, and discriminating active from inactive GO.
P<0.05 was considered to indicate a statistically significant
difference. Statistical analysis was performed using SPSS software,
version 17.0 (SPSS, Inc., Chicago, IL, USA).
Results
Comparison of quantitative
measurements between the GO and HC groups
Excellent interobserver agreement was achieved for
all quantitative measurements (ICC>0.900). No significant
difference was found in either age or gender between the GO and HC
groups (P>0.05). All quantitative measurements were
significantly larger in the GO group than in the HC group
(P<0.05), with the exception of the coronal length (P=0.150).
Detailed results for the comparisons of all quantitative
measurements between the GO and HC groups are shown in Table I.
 | Table I.Difference in quantitative
measurements of lacrimal gland between the GO and HC groups. |
Table I.
Difference in quantitative
measurements of lacrimal gland between the GO and HC groups.
| Measurement | GO (66 eyes) | HC (48 eyes) | P-value |
|---|
| Axial width (mm) |
5.7±3.1 |
3.8±0.8 | <0.001 |
| Axial length
(mm) |
16.2±3.5 |
14.0±1.9 | <0.001 |
| Axial area
(mm2) |
68.74±25.40 |
43.73±18.57 | <0.001 |
| Coronal width
(mm) |
5.4±1.0 |
4.3±0.7 | <0.001 |
| Coronal length
(mm) |
16.2±3.5 |
15.3±2.7 |
0.150 |
| Coronal area
(mm2) |
69.18±22.97 |
54.96±19.11 |
0.001 |
| Volume
(cm3) |
0.713±0.300 |
0.445±0.194 | <0.001 |
| SIR |
2.49±0.46 |
2.17±0.32 | <0.001 |
Diagnostic performance of quantitative
measurements for discriminating between the GO and HC groups
Axial and coronal width demonstrated the best
efficacy in the discrimination of the GO group from the HC group
(AUC=0.853 and 0.810, respectively). The AUC results that were
determined using all the significant quantitative parameters in the
discrimination between the GO and HC groups are shown in Table II.
| Table II.Diagnostic performance of significant
quantitative measurements of the lacrimal gland for discriminating
between patients with Graves' ophthalmopathy and healthy
controls. |
Table II.
Diagnostic performance of significant
quantitative measurements of the lacrimal gland for discriminating
between patients with Graves' ophthalmopathy and healthy
controls.
| Measurement | AUC | SE | 95% CI | P-value |
|---|
| Axial width | 0.853 | 0.034 | 0.782–0.920 | <0.001 |
| Coronal width | 0.810 | 0.041 | 0.730–0.890 | <0.001 |
| Axial area | 0.805 | 0.044 | 0.718–0.891 | <0.001 |
| Volume | 0.768 | 0.044 | 0.681–0.854 | <0.001 |
| Axial length | 0.732 | 0.048 | 0.637–0.827 | <0.001 |
| SIR | 0.705 | 0.052 | 0.536–0.740 |
0.001 |
| Coronal area | 0.681 | 0.051 | 0.581–0.781 | <0.001 |
Comparison of quantitative
measurements between the active and inactive GO groups
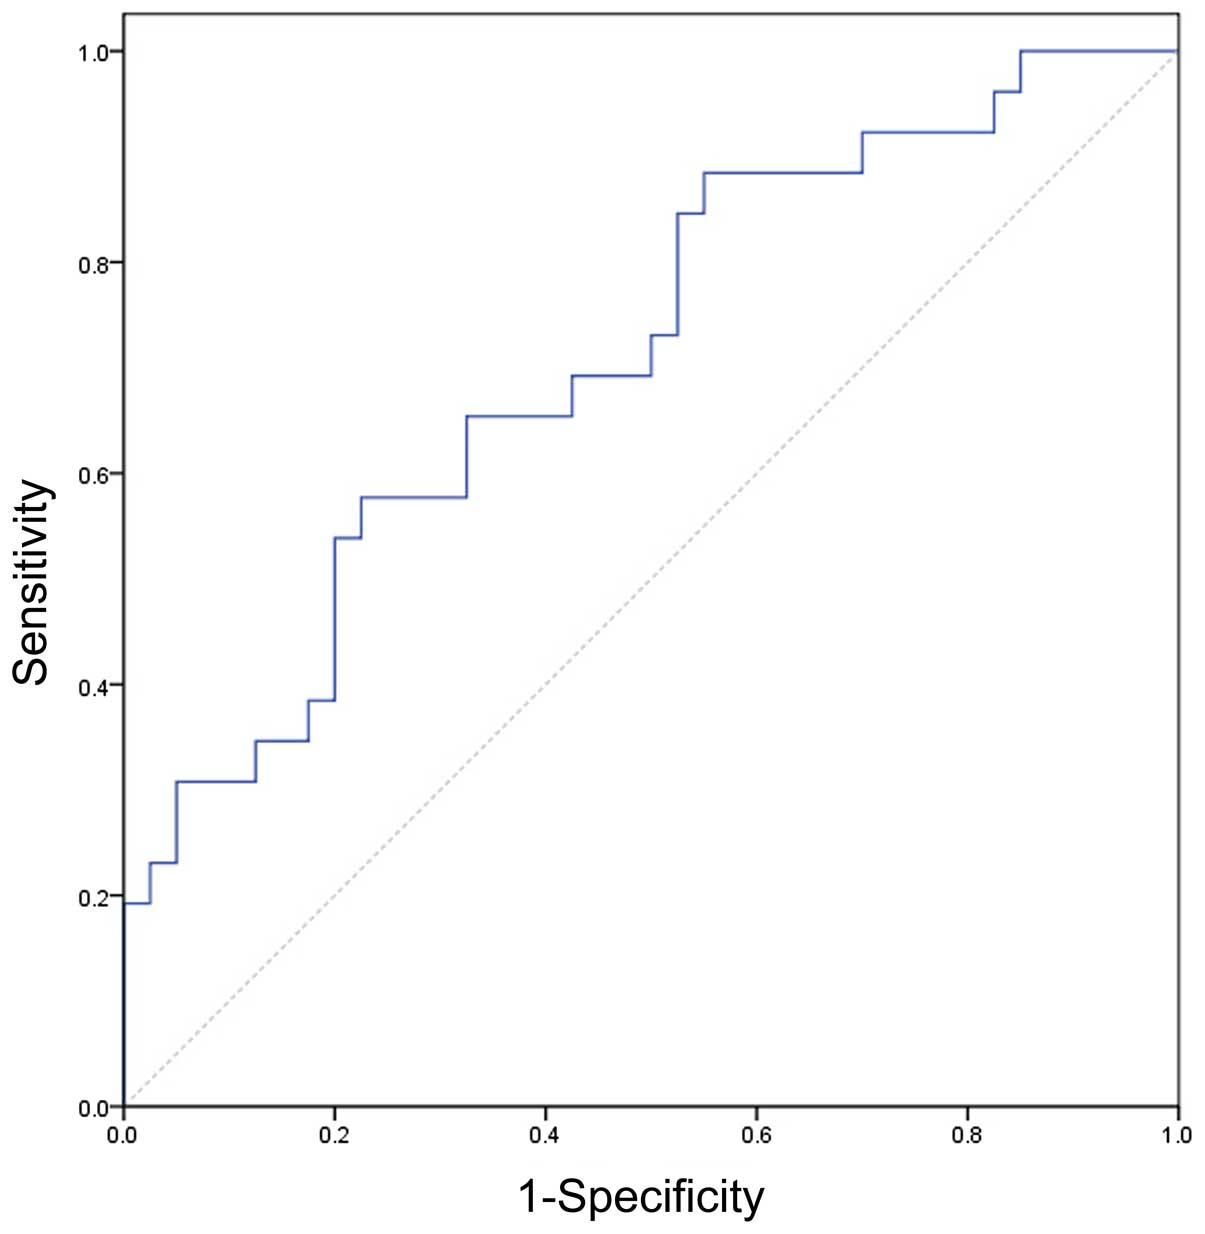
Only SIR demonstrated a significant difference
between patients with active and inactive GO (P=0.001). Detailed
comparisons and P-values for the quantitative measurements between
patients with active and inactive GO are displayed in Table III. Setting a SIR of 2.57 as the
threshold value, the optimal diagnostic value was achieved (AUC,
0.711; sensitivity, 57.7%; specificity, 77.5%). The ROC curve using
the SIR to discriminate active from inactive GO is shown in
Fig. 3.
| Table III.Difference in quantitative
measurements of lacrimal gland between active and inactive Graves'
ophthalmopathy. |
Table III.
Difference in quantitative
measurements of lacrimal gland between active and inactive Graves'
ophthalmopathy.
| Measurement | Inactive (40
eyes) | Active (26 eyes) | P-value |
|---|
| Axial width (mm) |
6.1±3.8 |
5.1±1.1 | 0.194 |
| Axial length
(mm) |
15.9±3.4 |
16.7±3.7 | 0.363 |
| Axial area
(mm2) |
68.63±20.97 |
68.90±31.49 | 0.966 |
| Coronal width
(mm) |
5.4±0.9 |
5.4±1.2 | 0.866 |
| Coronal length
(mm) |
16.3±2.8 |
16.0±4.5 | 0.711 |
| Coronal area
(mm2) |
68.42±17.6 |
70.36±29.74 | 0.766 |
| Volume
(cm3) |
0.737±0.250 |
0.676±0.367 | 0.425 |
| SIR |
2.34±0.36 |
2.72±0.51 | 0.001 |
Discussion
The present study evaluated the efficacy of
quantitative measurements of the lacrimal gland, based on 3-T MR
imaging, in the diagnosis and staging of GO patients. The results
can be summarized as follows. First, the study showed that, with
the exception of the coronal length, all other quantitative
measurements of the lacrimal gland demonstrated a significant
difference between the GO and HC groups. Among these measurements,
the axial and coronal width of the lacrimal gland demonstrated the
best diagnostic value for patients with GO. Secondly, it was found
that the SIR of the lacrimal gland to the ipsilateral temporal
muscle based on fat-suppressed T2-weighted imaging might be helpful
in staging GO. To the best of our knowledge, the present study was
the first to evaluate the efficacy of quantitative measurements of
the lacrimal gland, particularly the SIR, in the discrimination
between active and inactive GO.
The finding in the present study, that all
quantitative measurements of the lacrimal gland in patients with
GO, with the exception of coronal length, were significantly larger
than those in the HC group, is similar to observations in previous
studies (8,9,16).
Furthermore, ROC analyses showed that axial and coronal width
demonstrated the best diagnostic value for GO patients. As to the
reason, it might be due to the enlargement of the lacrimal gland in
GO patients mainly occurring in the left-to-right direction, but
not in the anterior-posterior or up-down direction, as shown by a
previous study (16).
Another main finding of the present study was that
SIR was the only significant quantitative parameter for
distinguishing between active and inactive GO, while the other
morphological measurements were not different between the two
groups. By contrast, Huang et al reported that
two-dimensional measurements of the lacrimal gland differed
significantly between active and inactive GO groups (16). However, only 24 GO patients were
enrolled in their study, and the relatively small sample size might
be responsible for the conflicting results between these two
studies. In the present study, SIR was the only significant
quantitative parameter for discriminating active from inactive GO.
Concerning the possible reason, it is hypothesized that, in the
active stage, the main physiopathological changes of the lacrimal
gland include inflammatory infiltrations, proliferating fibroblasts
and interstitial edema, which would increase the signal intensity
of the lacrimal gland on fat-suppressed T2-weighted imaging
(10,12). While in the inactive stage, the main
physiopathological changes are lacrimal fibrosis, glycosaminoglycan
deposition and fatty infiltrations, which would reduce the signal
intensity of the lacrimal gland (10–12).
Thus, SIR could demonstrate a significant difference between active
and inactive GO groups. ROC analysis indicated that an SIR of 2.57
might be the optimal threshold value for discriminating between
active and inactive GO. Considering the relatively small sample
size, the exact threshold value of SIR requires clarification in a
further study with a larger sample size. We consider that our
results could be a robust basis for further larger prospective
studies.
In the present study, for further usage in a
clinical setting, all the MR imaging-based quantitative
measurements of the lacrimal gland were performed on the principle
of ‘simple and convenient’, after reviewing several previous
studies (8,9,15,16). The
image section in which the lacrimal gland appeared the largest was
selected for the measurement of gland width, length and largest
area, and a sum-of-area method was applied for the measurement of
gland volume. All the measurements were easily performed and
reproducible. A ‘hotspot’ ROI approach was used during the
calculation of SIR, similar to the method presented by Mayer et
al (17). Compared with the
whole-area ROI approach, the ‘hotspot’ method might be less
reproducible. However, the ‘hotspot’ method may better demonstrate
focal inflammation, which is crucial in reflecting the local
physiopathology of the involved lacrimal gland, particularly
considering the heterogeneous changes in the MR imaging of GO
patients (10).
The present study has several limitations. First,
the sample size was relatively small. However, we consider that the
results could be a robust basis for further larger prospective
studies. Secondly, the anatomical changes observed by MR imaging
were not correlated with functional or pathological changes of the
lacrimal gland. Further studies with a larger sample size are
needed to associate the anatomical measurements of the lacrimal
gland with functional or pathological assessment, so as to clarify
the involvement of the lacrimal gland in the pathogenesis of GO
from the viewpoint of imaging.
In conclusion, the present study showed that
quantitative measurements of the lacrimal gland based on 3-T MR
imaging, particularly the axial and coronal width, are able to
assist in the diagnosis of GO. Furthermore, the SIR of the lacrimal
gland to the ipsilateral temporal muscle based on fat-suppressed
T2-weighted imaging might be helpful in staging GO. Therefore, it
is suggested that, during the assessment of the MR imaging results
of patients with GO, the lacrimal gland should be quantitatively
measured, and viewed as a reference standard in the diagnosis and
staging of GO.
References
|
1
|
Iyer S and Bahn R: Immunopathogenesis of
Graves' ophthalmopathy: The role of the TSH receptor. Best Pract
Res Clin Endocrinol Metab. 26:281–289. 2012. View Article : Google Scholar : PubMed/NCBI
|
|
2
|
Ludgate M and Baker G: Unlocking the
immunological mechanisms of orbital inflammation in thyroid eye
disease. Clin Exp Immunol. 127:193–198. 2002. View Article : Google Scholar : PubMed/NCBI
|
|
3
|
Gilbard JP and Farris RL: Ocular surface
drying and tear film osmolarity in thyroid eye disease. Acta
Ophthalmol (Copenh). 61:108–116. 1983. View Article : Google Scholar : PubMed/NCBI
|
|
4
|
Khurana AK, Sunder S, Ahluwalia BK and
Malhotra KC: Tear film profile in Graves' ophthalmopathy. Acta
Ophthalmol (Copenh). 70:346–349. 1992. View Article : Google Scholar : PubMed/NCBI
|
|
5
|
Chang TC, Huang KM, Chang TJ and Lin SL:
Correlation of orbital computed tomography and antibodies in
patients with hyperthyroid Graves' disease. Clin Endocrinol (Oxf).
32:551–558. 1990. View Article : Google Scholar : PubMed/NCBI
|
|
6
|
Eckstein AK, Finkenrath A, Heiligenhaus A,
Renzing-Köhler K, Esser J, Krüger C, Quadbeck B, Steuhl KP and
Gieseler RK: Dry eye syndrome in thyroid-associated ophthalmopathy:
Lacrimal expression of TSH receptor suggests involvement of
TSHR-specific autoantibodies. Acta Ophthalmol Scand. 82:291–297.
2004. View Article : Google Scholar : PubMed/NCBI
|
|
7
|
Jacobson DH and Gorman CA: Endocrine
ophthalmopathy: Current ideas concerning etiology, pathogenesis and
treatment. Endocr Rev. 5:200–220. 1984. View Article : Google Scholar : PubMed/NCBI
|
|
8
|
Harris MA, Realini T, Hogg JP and
Sivak-Callcott JA: CT dimensions of the lacrimal gland in Graves
orbitopathy. Ophthal Plast Reconstr Surg. 28:69–72. 2012.
View Article : Google Scholar : PubMed/NCBI
|
|
9
|
Bingham CM, Harris MA, Realini T, Nguyen
J, Hogg JP and Sivak-Callcott JA: Calculated computed tomography
volumes of lacrimal glands and comparison to clinical findings in
patients with thyroid eye disease. Ophthal Plast Reconstr Surg.
30:116–118. 2014. View Article : Google Scholar : PubMed/NCBI
|
|
10
|
Bhatti MT and Dutton JJ: Thyroid eye
disease: Therapy in the active phase. J Neuroophthalmol.
34:186–197. 2014. View Article : Google Scholar : PubMed/NCBI
|
|
11
|
Bartalena L, Pinchera A and Marcocci C:
Management of Graves' ophthalmopathy: Reality and perspectives.
Endocr Rev. 21:168–199. 2000. View Article : Google Scholar : PubMed/NCBI
|
|
12
|
Tortora F, Prudente M, Cirillo M, Elefante
A, Belfiore MP, Romano F, Cappabianca S, Carella C and Cirillo S:
Diagnostic accuracy of short-time inversion recovery sequence in
Graves' ophthalmopathy before and after prednisone treatment.
Neuroradiology. 56:353–361. 2014. View Article : Google Scholar : PubMed/NCBI
|
|
13
|
European Group on Graves' Orbitopathy
(EUGOGO). Wiersinga WM, Perros P, Kahaly GJ, Mourits MP, Baldeschi
L, Boboridis K, Boschi A, Dickinson AJ, Kendall-Taylor P, Krassas
GE, et al: Clinical assessment of patients with Graves'
orbitopathy: The European Group on Graves' orbitopathy
recommendations to generalists, specialists and clinical
researchers. Eur J Endocrinol. 155:387–389. 2006. View Article : Google Scholar : PubMed/NCBI
|
|
14
|
Mourits MP, Prummel MF, Wiersinga WM and
Koornneef L: Clinical activity score as a guide in the management
of patients with Graves' ophthalmopathy. Clin Endocrinol (Oxf).
47:9–14. 1997. View Article : Google Scholar : PubMed/NCBI
|
|
15
|
Tamboli DA, Harris MA, Hogg JP, Realini T
and Sivak-Callcott JA: Computed tomography dimensions of the
lacrimal gland in normal caucasian orbits. Ophthal Plast Reconstr
Surg. 27:453–456. 2011. View Article : Google Scholar : PubMed/NCBI
|
|
16
|
Huang D, Luo Q, Yang H and Mao Y: Changes
of lacrimal gland and tear inflammatory cytokines in
thyroid-associated ophthalmopathy. Invest Ophthalmol Vis Sci.
55:4935–4943. 2014. View Article : Google Scholar : PubMed/NCBI
|
|
17
|
Mayer EJ, Fox DL, Herdman G, Hsuan J,
Kabala J, Goddard P, Potts MJ and Lee RW: Signal intensity,
clinical activity and cross-sectional areas on MRI scans in thyroid
eye disease. Eur J Radiol. 56:20–24. 2005. View Article : Google Scholar : PubMed/NCBI
|