Introduction
Sepsis is a bloodstream infection (BSI) that is
typically associated with severe, whereas bacteremia is the
presence of viable bacteria in the bloodstream and, as it may cause
no symptoms, may resolve without treatment. In some cases,
bacteremia may lead to sepsis. Blood culture has been commonly used
as a traditional approach for the detection of sepsis. However,
blood cultures are time-consuming and at least 2–5 days of culture
is necessary to identify the bacterial or fungal organism in the
blood. Moreover, the sensitivity of blood cultures declines
significantly if antibiotic therapy has been initiated, or when
fastidious or slow-growing pathogens are cultured (1). Therefore, other types of test, such as
a complete blood count and a chemistry panel are ordered along with
or prior to the blood culture to determine whether the patient has
a BSI.
The red blood cell distribution width (RDW) and
platelet distribution width (PDW) are parts of a routine complete
blood count. RDW is a means of evaluating the variability in size
of erythrocytes and has been used widely in the differential
diagnosis of anemia (2). PDW is
measure of variation in platelet size, which may be an indicator of
active platelet release (3). A
number of previous investigations have shown that RDW and PDW are
significantly associated diseases including chronic spontaneous
urticaria and gram-negative bacteremia (3–5).
Furthermore, RDW has also been regarded as a prognostic marker for
certain diseases, such as stable angina pectoris (6,7).
Zahorec first proposed the use of the ratio of
neutrophil and lymphocyte counts [neutrophil lymphocyte count ratio
(NLCR)] as an marker of infection in clinical applications
(8). Recently, an investigation by
Loonen et al (1) demonstrated
that NLCR was a rapidly available biomarker, which appeared most
promising in differentiating patients with BSI from those without
BSI for subsequent pathogen identification (1). NLCR has been suggested to be a better
predictor of bacteremia than routine parameters such as C-reactive
protein (CRP) levels, white blood cell count and neutrophil count
(9).
CRP is an acute-phase protein mostly produced by the
liver following the onset of inflammation. Procalcitonin (PCT) is
normally produced by C-cells in the thyroid gland as a precursor to
calcitonin (10). It is present in
low levels in the blood of healthy subjects. Recently, CRP and PCT
have been investigated for potential to serve as important tools
for the early diagnosis of bacterial infection in clinical
applications (11,12).
In the present study, the RDW, PDW and NLCR
parameters, which are parts of a complete blood count, were
compared with the traditional parameters CRP and PCT for ability to
predict sepsis in patients with or without positive blood
cultures.
Materials and methods
Patients
The clinical and laboratory data of 120 consecutive
patients who were tested by blood culture at the Affiliated Fuding
Hospital of Fujian University of Traditional Chinese Medicine
(Fuding, China) between January 2014 and March 2015 were
retrospectively analyzed. Clinical and laboratory data were
regarded as eligible when a patient met the following inclusion
criteria: i) The presence of two or more diagnostic criteria for
systemic inflammatory response syndrome (SIRS) and suspected or
documented infection (13); ii) all
blood samples of the studied patient were collected simultaneously
during the same septic episode (14). The exclusion criteria were as
follows: i) Patients with hematological diseases such as
hematological malignancy, metastatic bone marrow infiltration by
malignancy, recovery after bone marrow hyperplasia or acute
bleeding (15); ii) absence of at
least two SIRS diagnostic criteria (13); iii) samples not collected
simultaneously from the same studied patient. The patients were
classified into two groups according to the results of the blood
culture. Patients with a positive blood culture constituted the
positive group and those with a negative blood culture were
classified into the negative group. There were 33 males and 27
females with a mean age of 62.6±14.9 years (range, 21–89 years) in
the positive group, and 40 males and 20 females with a mean age of
66.0±15.3 years (range, 24–90 years) in the negative group. The
protocol was approved by the ethics committee of the Affiliated
Fuding Hospital of Fujian University of Traditional Chinese
Medicine.
Blood samples were extracted from peripheral venous
puncture of the patients, directly injected into Bactec bottles,
and incubated in a Bactec incubator (BD Diagnostics, Franklin
Lakes, NJ, USA). Blood culture bottles were incubated for 7 days at
37°C. Positive cultures were Gram-stained, and subcultured on solid
media for subsequent analysis. Identification of microorganisms was
conducted with conventional techniques and with an API system
(bioMérieux, Marcy-l'Étoile, France).
Marker determination
CRP analysis was performed using the Dimension Vista
1500 Intelligent Lab system (Siemens Healthcare GmbH, Erlangen,
Germany) according to the manufacturer's protocol. Complete blood
cell counts and mean corpuscular volume (MCV) were determined using
a Sysmex XE-2100 hematology analyzer (Sysmex Corporation, Kobe,
Japan). The NLCR was determined by dividing the absolute neutrophil
count by the absolute lymphocyte count, and PCT levels were
measured using a Cobas E411 analyzer (Roche Diagnostics, Basel,
Switzerland).
Statistical analysis
Categorical and continuous variables were expressed
as frequency, mean ± standard deviation, or median and
interquartile range. Testing of data for normal distribution was
carried out by means of the Kolmogorov-Smirmov test. Comparison of
continuous variables between the two groups was performed using the
Mann-Whitney U test. Receiver operating characteristic (ROC) curve
analyses were conducted for the single markers and the combination
RDW + PDW + NLCR in the prediction of blood culture positivity. The
area under the ROC curve (AUC) was calculated for each marker, and
the standard error and 95% confidence interval (95% CI) were
determined. The sensitivity, specificity, accuracy, positive
predictive value (PPV) and negative predictive value (NPV) were
calculated in accordance with the ROC curves. In all tests,
P<0.05 was considered to indicate a statistically significant
difference. Statistical analysis was performed using the SPSS
version 22.0 software package (IBM SPSS, Armonk, NY, USA).
Results
Study population
The current study was performed on a total of 120
patients who underwent blood culture tests in hospital. The major
attributes of the patients in the study are presented in Table I. Statistical analysis demonstrated
that there was no significant difference with respect to age or
gender.
 | Table I.Major attributes of the two
groups. |
Table I.
Major attributes of the two
groups.
| Attribute | Positive group
(n=60) | Negative group
(n=60) | Student's t-test | χ2 | P-value |
|---|
| Age (mean ± SD,
years) | 62.6±14.9 | 66.0±15.3 | −1.234 |
| 0.220 |
| Gender, n (%) |
|
|
| 1.259 | 0.190 |
| Male | 33 (55.0) | 40 (66.7) |
|
|
|
Female | 27 (45.0) | 20 (33.3) |
|
|
Kolmogorov-Smirmov test
The statistical distribution of every tested marker
in each group was analyzed by means of a Kolmogorov-Smirmov test.
The results were Z=0.123–0.407, P<0.01, indicating non-normal
distribution, and non-parametric tests were conducted in the
following statistical analysis.
Levels of markers in the two
groups
The concentrations of PCT and CRP, and the RDW, PDW
and NLCR values were significantly higher in the positive group
compared with those in negative group. However, no significant
difference in MCV was observed between the two groups (Table II).
| Table II.Mean results for markers in the two
groups [median (P25-P75)]. |
Table II.
Mean results for markers in the two
groups [median (P25-P75)].
| Group | PCT (ng/ml) | CRP (mg/l) | MCV (%) | RDW (%) | PDW (%) | NLCR (%) |
|---|
| Positive | 9.27
(1.34–38.53) | 147.0
(55.9–200.0) | 90.6 (86.6–93.3) | 14.1 (13.4–15.2) | 12.4 (11.1–15.1) | 16.9 (9.8–26.5) |
| Negative | 0.18 (0.05–0.86) | 55.9
(19.7–119.2) | 91.6 (88.2–94.4) | 13.6 (12.7–14.7) | 11.6 (10.6–12.6) | 8.38 (4.4–16.0) |
| Z-value | −6.270 | −3.586 | −3.586 | −2.318 | −2.544 | −4.078 |
| P-value | <0.001 | <0.001 | 0.274 | 0.020 | 0.011 | <0.001 |
Evaluation of markers and ROC
analysis
The sensitivity, specificity, Youden's index
(sensitivity + specificity − 1) and diagnostic accuracy of PCT,
CRP, RDW, PDW, NLCR and the combination RDW + PDW + NLCR were
calculated on the basis of the ROC curves and logistic regression
(Table III). Among the tested
markers, PCT had the highest sensitivity (91.70%) and accuracy
(80.60%) and the PDW had the highest specificity (84.70%) for
predicting sepsis.
| Table III.Comparison of performance
characteristics of individual markers and a marker combination in
predicting sepsis. |
Table III.
Comparison of performance
characteristics of individual markers and a marker combination in
predicting sepsis.
| Markers | Cut off | Sensitivity (%) | Specificity (%) | Accuracy (%) | PPV (%) | NPV (%) | Youden's index
(%) |
|---|
| PCT | 0.37 | 91.70 | 69.50 | 80.60 | 75.00 | 89.34 | 61.20 |
| CRP | 126.25 | 53.30 | 79.70 | 66.50 | 72.40 | 63.10 | 33.00 |
| RDW | 13.45 | 73.30 | 49.20 | 61.20 | 59.10 | 64.80 | 22.50 |
| PDW | 13.35 | 38.30 | 84.70 | 61.50 | 71.50 | 57.90 | 23.10 |
| NLCR | 9.37 | 81.10 | 62.70 | 71.92 | 68.51 | 76.87 | 43.80 |
| Combination | – | 80.00 | 62.70 | 71.40 | 68.20 | 75.80 | 42.70 |
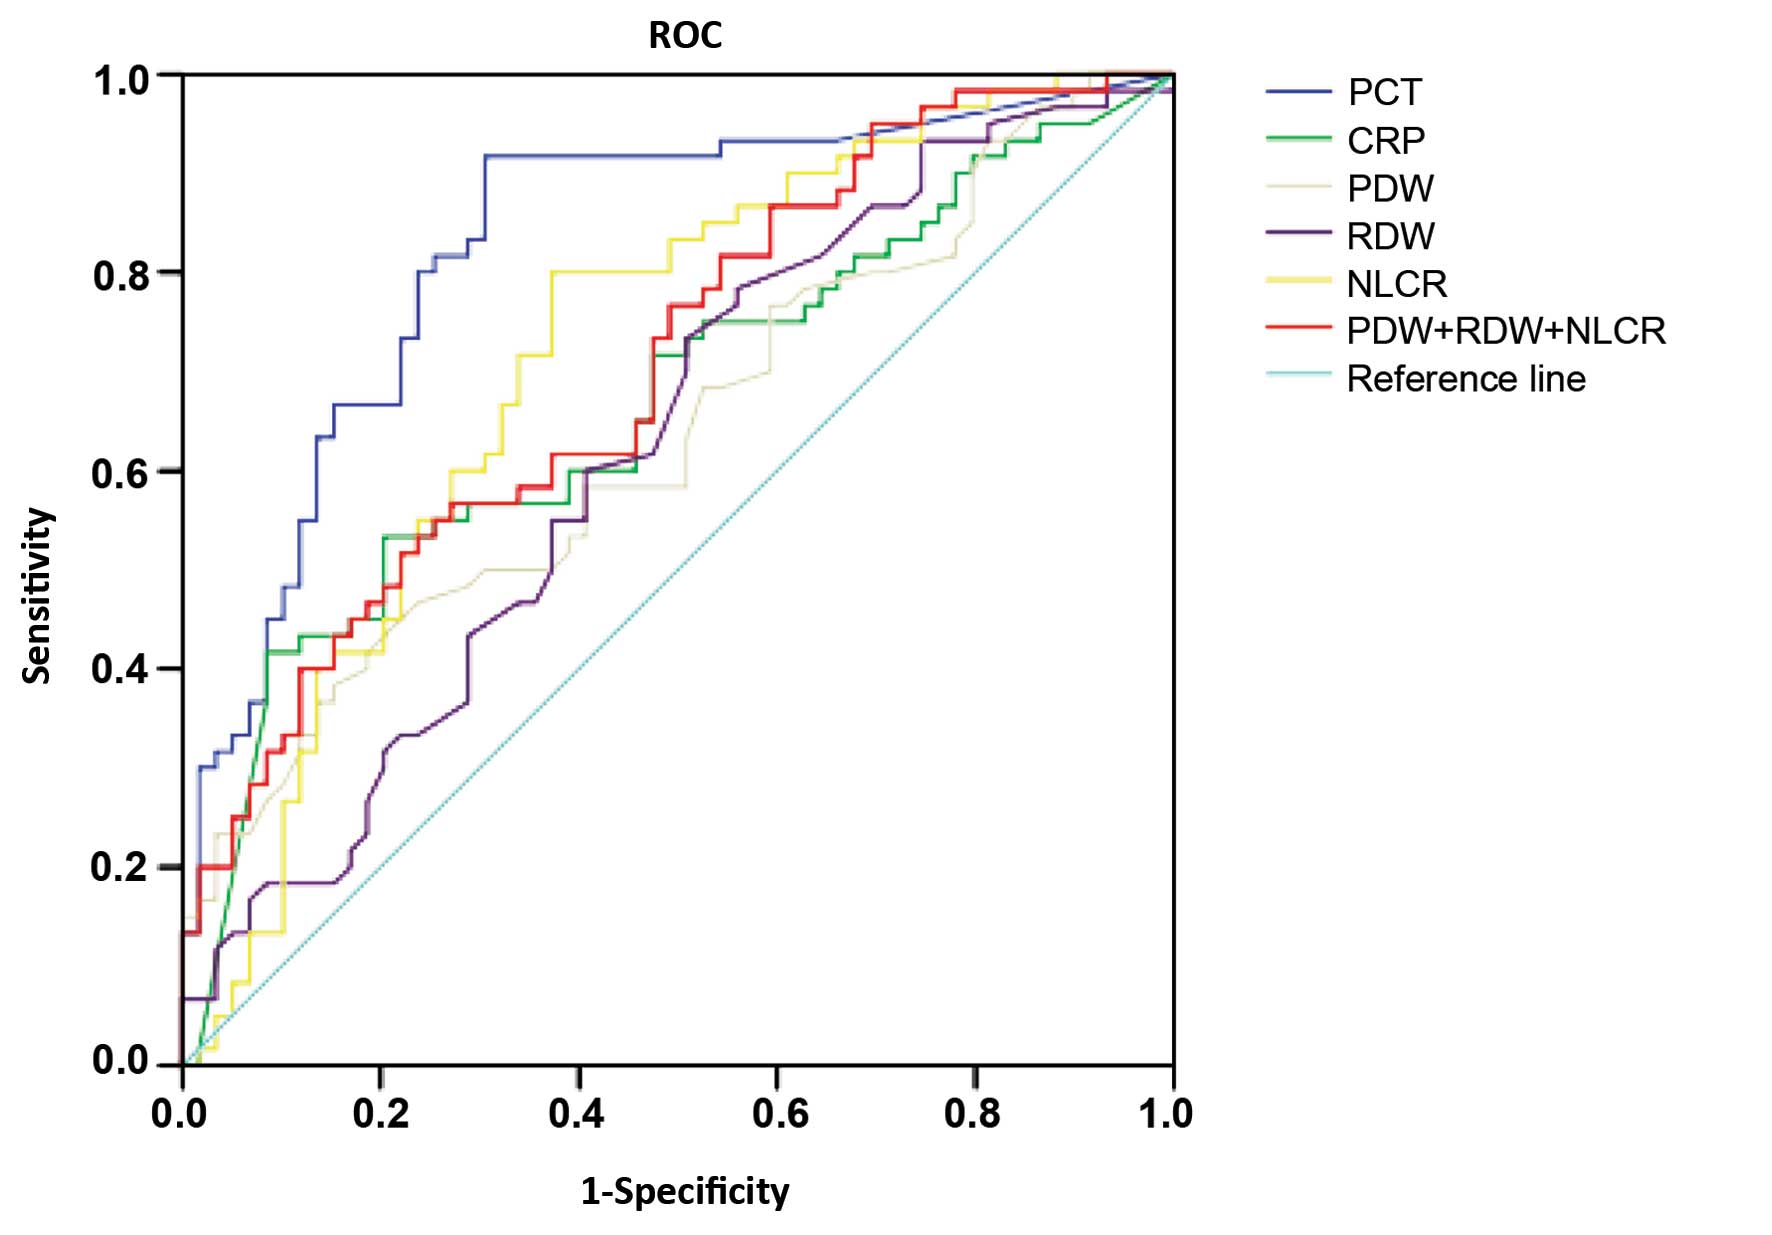
The ROC curves for the analysis of markers in
patients with positive blood culture compared with those in
patients without positive blood culture were plotted. The AUCs of
the markers are shown in Table IV.
The largest AUC was 0.829 (95% CI: 0.754–0.905) for PCT, while the
AUC was 0.666 (95% CI: 0.568–0.764) for CRP. The ROC analysis,
conducted to evaluate the diagnostic accuracy along with the
specificity, sensitivity, PPV and NPV of the optimal cut-off values
of the different markers in the prediction of sepsis are shown in
Fig. 1. PCT had the greatest
accuracy, at the cut-off value of 0.37 ng/ml (91.70% sensitivity
and 69.50% specificity). NLCR had the second best accuracy, at the
cutoff value of 9.37% (81.10% sensitivity and 62.70%
specificity).
| Table IV.Area under the ROC curve of each
tested marker. |
Table IV.
Area under the ROC curve of each
tested marker.
|
|
|
|
| 95% confidence
interval |
|---|
|
|
|
|
|
|
|---|
| Markers | AUC | SE | P-value | Lower bound | Upper bound |
|---|
| PCT | 0.829 | 0.039 | <0.001 | 0.754 | 0.905 |
| CRP | 0.666 | 0.050 |
0.002 | 0.568 | 0.764 |
| PDW | 0.636 | 0.051 |
0.010 | 0.537 | 0.741 |
| RDW | 0.621 | 0.051 |
0.023 | 0.520 | 0.722 |
| NLRC | 0.718 | 0.047 | <0.001 | 0.625 | 0.811 |
| Combination | 0.704 | 0.047 | <0.001 | 0.612 | 0.796 |
Discussion
Sepsis and severe sepsis are major causes of
morbidity and mortality (16). Early
identification of the pathogen in sepsis plays a pivotal role in
its adequate treatment, and it has been shown that when the
appropriate treatment is initiated promptly the BSI-related
mortality rate is reduced (17). By
contrast, a delay in the diagnosis and treatment of sepsis will
result in the rapid progression of circulatory failure, multiple
organ dysfunction and eventually death (15). As a result, specific markers and
molecular diagnostic assays (18)
have been developed for rapid laboratory diagnosis in order to
improve the clinical management of sepsis (14).
The present study concentrated on six markers that
may be employed for the rapid diagnosis of sepsis. Consistent with
findings of a previous study (14),
PCT performed better than other markers of inflammation, with the
highest accuracy being found at the cutoff of 0.37 ng/ml, with a
sensitivity of 91.70% and a specificity of 69.50%. Likewise, in a
study of 571 patients, Leli et al (14) found that predicting bacteremia in
patients with suspected sepsis using the optimal cutoff value of
>0.5 ng/ml for PCT resulted in a sensitivity and specificity of
94 and 64%, respectively. Furthermore, the present study found the
largest AUC was 0.829 (95% CI: 0.754–0.905) for PCT, while the AUC
was 0.666 (95% CI: 0.568–0.764) for CRP. These findings are in
agreement with a previous investigation by Müller et al
(19), which found AUCs of 0.82 (95%
CI: 0.77–0.86) for PCT and 0.67 (95% CI: 0.59–0.74) for CRP.
PDW is an index of platelet size heterogeneity and
has been shown to be a marker of platelet function and activation
(3). RDW is a measure of the
variation of red blood cell size or red blood cell volume and is
used in the differentiation of anemia (20). PDW and RDW can be obtained
automatically as parts of the complete blood count. In the present
study, the area under the ROC curves of RDW, PDW and NLCR were
0.621 (95% CI: 0.520–0.722), 0.636 (95% CI: 0.537–0.741) and 0.718
(95% CI: 0.625–0.811), respectively. These results are similar to
those of previous studies. A study by Guclu et al (21) found that the AUC of PDW was 0.733
(95% CI: 0.678–0.783) with a sensitivity of 59.31% and a
specificity of 76.22%. An investigation by Ku et al
(4) observed that the AUC of RDW was
0.764 (95% CI: 0.650–0.879). Therefore, the two indices PDW and RDW
have diagnostic power in the discrimination of bacteremia. The
results indicate that the elevated PDW, RDW values observed at the
onset of inflammation are significantly associated with the
presence of bacteremia. In the present study it was found that the
AUC of the NLCR ROC curve was the second largest among the tested
markers. The NLCR has been demonstrated to be a marker of infection
with discriminatory capacity in predicting bacteremia (9). In a previous study, NLCR was regarded
as a better marker than PCT in predicting bacteremia in patients
suspected of having sepsis (9). On
the basis of the data in the present study, it may be suggested
that the finding of an increased PDW, RDW or NLCR value should
alert clinicians to initiate or to change antibiotic treatment. The
present study also revealed that if RDW, PDW and NLCR are
considered together, the combination of the three tested parameters
of the complete blood count has a higher diagnostic power than each
single marker alone for the prediction of bacteremia.
In conclusion, PCT showed the best diagnostic
performance among the tested markers. The combination of the three
parameters of the complete blood count, namely RDW, PDW and NLCR,
exhibited a high diagnostic performance similar to that of
procalcitonin. NLCR was found to have a high diagnostic efficiency
for the prediction of sepsis, with a greater sensitivity and
accuracy than CRP. The RDW, PDW and NLCR values are obtained easily
using automated hematological analysis and are cost-efficient
measures. These three markers are rapidly available, inexpensive
and easy to determine. The combination of these three tested
parameters could be considered as a marker to distinguish
bacteremia from nonbacteremia.
Glossary
Abbreviations
Abbreviations:
|
RDW
|
red blood cell distribution width
|
|
PDW
|
platelet distribution width
|
|
NLCR
|
neutrophil-lymphocyte count ratio
|
|
PCT
|
procalcitonin
|
|
CRP
|
C-reactive protein
|
|
ROC
|
receiver operating characteristic
|
|
AUC
|
area under ROC curve
|
|
BSI
|
bloodstream infection
|
|
SIRS
|
systemic inflammatory response
syndrome
|
|
PPV
|
positive predictive value
|
|
NPV
|
negative predictive value
|
|
CI
|
confidence interval
|
|
SE
|
standard error
|
References
|
1
|
Loonen AJ, de Jager CP, Tosserams J,
Kusters R, Hilbink M, Wever PC and van den Brule AJ: Biomarkers and
molecular analysis to improve bloodstream infection diagnostics in
an emergency care unit. PLoS One. 9:e873152014. View Article : Google Scholar : PubMed/NCBI
|
|
2
|
Miyamoto K, Inai K, Takeuchi D, Shinohara
T and Nakanishi T: Relationships among red cell distribution width,
anemia and interleukin-6 in adult congenital heart disease. Circ J.
79:1100–1106. 2015. View Article : Google Scholar : PubMed/NCBI
|
|
3
|
Kasperska-Zajac A, Grzanka A, Jarzab J,
Misiołek M, Wyszyńska-Chłap M, Kasperski J and Machura E: The
association between platelet count and acute phase response in
chronic spontaneous urticaria. Biomed Res Int. 2014:6509132014.
View Article : Google Scholar : PubMed/NCBI
|
|
4
|
Ku NS, Kim HW, Oh HJ, Kim YC, Kim MH, Song
JE, Oh DH, Ahn JY, Kim SB, Jeong SJ, et al: Red blood cell
distribution width is an independent predictor of mortality in
patients with gram-negative bacteremia. Shock. 38:123–127. 2012.
View Article : Google Scholar : PubMed/NCBI
|
|
5
|
Celik A, Aydin N, Ozcirpici B, Saricicek
E, Sezen H, Okumus M, Bozkurt S and Kilinc M: Elevated red blood
cell distribution width and inflammation in printing workers. Med
Sci Monit. 19:1001–1005. 2013. View Article : Google Scholar : PubMed/NCBI
|
|
6
|
Ren H, Hua Q, Quan M, Chen H, Hou H, Wang
L, Liu R and Yang Z: Relationship between the red cell distribution
width and the one-year outcomes in Chinese patients with stable
angina pectoris. Intern Med. 52:1769–1774. 2013. View Article : Google Scholar : PubMed/NCBI
|
|
7
|
Allen LA, Felker GM, Mehra MR, Chiong JR,
Dunlap SH, Ghali JK, Lenihan DJ, Oren RM, Wagoner LE, Schwartz TA
and Adams KF Jr: Validation and potential mechanisms of red cell
distribution width as a prognostic marker in heart failure. J Card
Fail. 16:230–238. 2010. View Article : Google Scholar : PubMed/NCBI
|
|
8
|
Zahorec R: Ratio of neutrophil to
lymphocyte counts-rapid and simple parameter of systemic
inflammation and stress in critically ill. Bratisl Lek Listy.
102:5–14. 2001.PubMed/NCBI
|
|
9
|
deJager CP, van Wijk PT, Mathoera RB, de
Jongh-Leuvenink J, van der Poll T and Wever PC: Lymphocytopenia and
neutrophil-lymphocyte count ratio predict bacteremia better than
conventional infection markers in an emergency care unit. Crit
Care. 14:R1922010. View
Article : Google Scholar : PubMed/NCBI
|
|
10
|
Maruna P, Nedelníková K and Gürlich R:
Physiology and genetics of procalcitonin. Physiol Res. 49(Suppl 1):
S57–S61. 2000.PubMed/NCBI
|
|
11
|
Nargis W, Ibrahim M and Ahamed BU:
Procalcitonin versus C-reactive protein: Usefulness as biomarker of
sepsis in ICU patient. Int J Crit Illn Inj Sci. 4:195–199. 2014.
View Article : Google Scholar : PubMed/NCBI
|
|
12
|
Jiang L, Feng B, Gao D and Zhang Y: Plasma
concentrations of copeptin, C-reactive protein and procalcitonin
are positively correlated with APACHE II scores in patients with
sepsis. J Int Med Res. 43:188–195. 2015. View Article : Google Scholar : PubMed/NCBI
|
|
13
|
Bone RC, Balk RA, Cerra FB, Dellinger RP,
Fein AM, Knaus WA, Schein RM and Sibbald WJ: ACCP/SCCM Consensus
Conference Committee; American College of Chest Physicians/Society
of Critical Care Medicine: Definitions for sepsis and organ failure
and guidelines for the use of innovative therapies in sepsis.
Chest. 136(Suppl 5): e282009.
|
|
14
|
Leli C, Cardaccia A, Ferranti M, Cesarini
A, D'Alò F, Ferri C, Cenci E and Mencacci A: Procalcitonin better
than C-reactive protein, erythrocyte sedimentation rate and white
blood cell count in predicting DNAemia in patients with sepsis.
Scand J Infect Dis. 46:745–752. 2014. View Article : Google Scholar : PubMed/NCBI
|
|
15
|
Kim H, Kim Y, Lee HK, Kim KH and Yeo CD:
Comparison of the delta neutrophil index with procalcitonin and
C-reactive protein in sepsis. Clin Lab. 60:2015–2021.
2014.PubMed/NCBI
|
|
16
|
Mayr FB, Yende S and Angus DC:
Epidemiology of severe sepsis. Virulence. 5:4–11. 2014. View Article : Google Scholar : PubMed/NCBI
|
|
17
|
Finfer S: The surviving sepsis campaign:
Robust evaluation and high-quality primary research is still
needed. Intensive Care Med. 36:187–189. 2010. View Article : Google Scholar : PubMed/NCBI
|
|
18
|
Reinhart K, Bauer M, Riedemann NC and
Hartog CS: New approaches to sepsis: Molecular diagnostics and
biomarkers. Clin Microbiol Rev. 25:609–634. 2012. View Article : Google Scholar : PubMed/NCBI
|
|
19
|
Müller F, Christ-Crain M, Bregenzer T,
Krause M, Zimmerli W, Mueller B and Schuetz P: ProHOSP Study Group:
Procalcitonin levels predict bacteremia in patients with
community-acquired pneumonia: A prospective cohort trial. Chest.
138:121–129. 2010. View Article : Google Scholar : PubMed/NCBI
|
|
20
|
Kara H, Degirmenci S, Bayir A, Ak A,
Akinci M, Dogru A, Akyurek F and Kayis SA: Red cell distribution
width and neurological scoring systems in acute stroke patients.
Neuropsychiatr Dis Treat. 11:733–739. 2015. View Article : Google Scholar : PubMed/NCBI
|
|
21
|
Guclu E, Durmaz Y and Karabay O: Effect of
severe sepsis on platelet count and their indices. Afr Health Sci.
13:333–338. 2013.PubMed/NCBI
|