Introduction
Despite the mortality rate for gastric carcinoma
reducing 3.1% annually and the overall 5-year relative survival
rate increasing to 28% over the past 10 years, the mortality rate
for gastric carcinoma remains >50% worldwide (1). The most effective treatment for
resectable gastric cancer is surgery, which presents good survival
rates. The majority of cases of gastric cancer are diagnosed at an
advanced stage or as a relapse after surgery (2). Therefore, a further understanding of
the molecular mechanisms of gastric cancer is of clinical
importance and it is required in order to improve the early
diagnosis and therapeutic strategies of gastric cancer.
Over the last decade, the majority of the potential
therapeutic targets reported and the diagnostic markers for gastric
cancer are protein-coding genes identified from large-scale DNA
microarray analysis, including the novel genes KLF5,
FAT4, KMT2C, GATA4, MLL and
GATA6 (3–6). The majority of studies on non-coding
RNAs (ncRNAs) are focused on short ncRNAs called microRNAs, while
alterations in the structure, expression levels and cognate
RNA-binding proteins of long ncRNAs (lncRNAs) with a length of
>200 nucleotides (nt) have been associated with cancer, and
appear to be gaining prominence as further studies are conducted
(7). In addition, growing evidence
has confirmed that lncRNAs that are capable of regulating tumor
suppression or that exhibit oncogenic effects may be considered as
novel biomarkers and therapeutic targets for cancer (8,9).
Furthermore, it has been demonstrated that differentially expressed
long non-coding RNAs (DE-lncRNAs), including H19 and uc001lsz, may
present potential roles in the development and occurrence of
gastric cancer (10). In a study by
Hu et al (11), a novel
lncRNA GAPLINC (924 bp) was highly expressed in gastric cancer
specimens and it was capable of controlling the expression levels
of CD44 to regulate cell invasion by competing for miR211-3p.
A previous study demonstrated that celecoxib induced
apoptosis and autophagy of gastric cancer SGC-7901 cells via the
PI3K/Akt signaling pathway (12).
According to a study by Lan et al (13), celecoxib inhibited Helicobacter
pylori-induced invasion in gastric cancer via the adenine
nucleotide translocator-dependent pathways. Furthermore, the
activated Notch1 signaling pathway may contribute to the
pathogenesis of gastric cancer, at least partly through
COX-2 (14). Treatment with
celecoxib, a COX-2 inhibitor, can significantly reduce the
incidence of gastric cancer in rats (15). In addition, an elevated COX-2
expression level is an independent prognostic factor indicative of
poor prognosis and it is associated with reduced survival in
patients with gastric cancer (16).
Pang et al (17) reported
that the Akt/GSK3β/NAG-1 signaling pathway may be considered as the
major mechanism of the COX-2-independent effects of
celecoxib on gastric cancer cells. COX-2 has been indicated
to regulate E-cadherin expression via the NF-κB and Snail signaling
pathway in gastric cancer (18). It
has also been reported that celecoxib has the potential for
clinical use in gastric cancer treatment by the mechanism of
activating miR-29c (19). Although
various advances have been made in the study of mechanisms of
lncRNAs in gastric cancer, the understanding of the expression
patterns and functional roles of lncRNAs in gastric cancer treated
with celecoxib requires further investigation.
In the present study, the RNA sequencing data of
NCI-N87 human gastric carcinoma cells treated with or without
celecoxib were prepared and analyzed using bioinformatics methods.
Briefly, differentially expressed genes (DEGs) and lncRNAs were
identified for pathway enrichment analysis. A protein-protein
interaction (PPI) network for DEGs was constructed and module
analysis was performed. Finally, co-expression analysis of DEGs and
lncRNAs was performed. The results of the data in the present study
may provide novel insight into the roles of celecoxib in gastric
cancer.
Materials and methods
Cell culture and celecoxib
treatment
The human gastric carcinoma cell line NCI-N87 was
obtained from the Cell Bank of the Chinese Academy of Sciences
(Shanghai, China). Cells were cultured in RPMI-1640 medium (Thermo
Fisher Scientific, Inc., Waltham, MA, USA) supplemented with 10%
fetal bovine serum (Thermo Fisher Scientific, Inc.) and 1%
penicillin-streptomycin (Thermo Fisher Scientific, Inc.) in a
humidified air incubator (Thermo Fisher Scientific, Inc.) at 37°C
and with 5% CO2. The cells were passaged at 80–90%
confluence with 0.25% trypsin (Thermo Fisher Scientific, Inc.).
Cells at the exponential growth phase with a density
of 1×10⁶ were seeded in a cell culture dish (Corning
Inc., NY, USA) with a diameter of 6 cm and incubated in 5 ml
serum-free Dulbecco's modified Eagle medium (Thermo Fisher
Scientific, Inc.) overnight. Celecoxib (Sigma-Aldrich, St. Louis,
MO, USA) was dissolved in dimethylsulfoxide (DMSO; Sigma-Aldrich),
and the cells were treated with 15 µM celecoxib for 72 h (celecoxib
group). Cells treated with an equal volume of DMSO were used as a
control group.
RNA sequencing data
The total RNA was extracted using TRIzol (Thermo
Fisher Scientific, Inc.) following the manufacturer's protocol, and
were quantified with a 721 spectrophotometer (Shanghai Precision
Instrument Co., Ltd., Shanghai, China). Next, libraries were
prepared by the NEBNext Ultra RNA Library Prep kit for Illumina
(#E7530; New England BioLabs, Inc., Ipswich, MA, USA) according to
the manufacturer's instructions. Briefly, RNA fragments ~200 nt in
length were generated and then double-stranded cDNA was synthesized
and end-repaired. Following the adaptor ligation, PCR amplification
was performed as follows: A library was added with 10 µl 5X HF
Buffer, 1 µl 10 µM reverse PCR primer 2–1:
5′-CAAGCAGAAGACGGCATACGAGATCGTGATGTGACTGGAGTTCAGACGTGTGCTCTTCCGATCT-3′
and primer 2–2:
5′-CAAGCAGAAGACGGCATACGAGATACATCGGTGACTGGAGTTCAGACGTGTGCTCTTCCGATCT-3′,
primer 2–3:
5′-CAAGCAGAAGACGGCATACGAGATGCCTAAGTGACTGGAGTTCAGACGTGTGCTCTTCCGATCT-3′,
primer 2–4:
5′-CAAGCAGAAGACGGCATACGAGATTGGTCAGTGACTGGAGTTCAGACGTGTGCTCTTCCGATCT-3′,
1.5 µl dNTP, 0.5 µl Phusion High-Fidelity DNA Polymerase (2 U/µl)
and 5 µl ddH2O, and then incubated at 98°C for 40 sec,
65°C for 30 sec and 72°C for 30 sec. Next, 1 µl of 10 µM forward
PCR primer
(5′-AATGATACGGCGACCACCGAGATCTACACTCTTTCCCTACACGACGCTCTTCCGATCT-3′)
was added and incubated at 98°C for 10 sec, 10 cycles at 65°C for
30 sec, 72°C for 30 sec, and 72°C for 3 min. Finally, the library
was dissolved in 20 µl ddH2O after being purified by 50
µl AMPure XP magnetic beads. A 1 µg input for 15 cycles and a 5 µg
input for 12 cycles was used and the library quality was assessed
on a 2100 Electrophoresis Bioanalyzer instrument (Agilent
Technologies, Inc., Santa Clara, CA, USA). Finally, sequencing was
conducted on a HiSeq 2500 System (Illumina, Inc., San Diego, CA,
USA).
Data preprocessing and sequence
alignment
Quality control (QC) of obtained next generation
sequencing (NGS) data was conducted with an NGS QC Toolkit (version
2.3.3; www.nipgr.res.in/ngsqctoolkit.html) in order to remove
low quality reads with default parameters (20). Reads with ≥10% low quality bases
(Phred quality score <20) were filtered.
The paired-end RNA sequencing reads were aligned to
the human hg19 reference genome using TopHat2 (ccb.jhu.edu/software/tophat) (21), and the human hg19 reference genome
and its annotation files were obtained from the University of
California Santa Cruz Genome Browser (genome.ucsc.edu) (22).
The ‘-no-mixed’ option was handled and other parameters were set to
default.
Identification of DEGs and
lncRNAs
Following sequence alignment and refseq annotation,
Cuffdiff (23) was applied to screen
DEGs with a cut-off criteria of q<0.05. DE-lncRNAs were
identified with the combination of lncRNA annotation by LNCipedia
3.0 (www.lncipedia.org) (24). q<0.05 was considered as the
threshold value.
Functional and pathway enrichment
analysis for DEGs
Gene ontology (GO) terms in the biological process
(BP), cellular component (CC) and molecular function (MF)
categories were enriched for DEGs using the GO-function package in
Bioconductor (www.bioconductor.org) (25). KEGG (Kyoto Encyclopedia of Genes and
Genomes) pathway enrichment analysis was also conducted by the KEGG
profile in Bioconductor. The enrichment thresholds were P<0.05
and the gene counts ≥2.
Construction of the PPI network and
module analysis
The Search Tool for the Retrieval of Interacting
Genes (STRING; www.string-db.org) database not only provides uniquely
comprehensive coverage but also contains predicted, experimental,
transferred and text-mined interactions (26). The PPIs for DEGs were predicted using
version 9.1 of the STRING database with a combined score >0.7
(26). Cytoscape software version
2.8 (27) was used to visualize the
PPI network (www.cytoscape.org).
The ClusterONE plugin of Cytoscape (28) was used to perform module analysis for
the PPI network with default parameters. In addition, functional
and pathway enrichment analysis of DEGs in the two modules with the
highest significance was performed with the cut-off criteria of
P<0.05 and gene counts ≥2.
Co-expression analysis of DEGs and
lncRNAs
Pearson correlation coefficients between DEGs and
lncRNAs were calculated. The co-expressed genes and lncRNA pairs
were selected with a Pearson correlation coefficient >0.98.
Pathway enrichment analysis was conducted for the DEGs co-expressed
with each DE-lncRNA, with thresholds of P<0.05 and gene counts
≥2.
Results
DEGs and lncRNAs
A total of 490 DEGs, of which 302 were upregulated
and 188 downregulated genes, were identified in the celecoxib and
the control groups. A total of 37 DE-lncRNAs, of which 19 were
upregulated and 18 downregulated, were screened (Table I).
 | Table I.Differentially expressed lncRNAs in
the celecoxib and the control groups. |
Table I.
Differentially expressed lncRNAs in
the celecoxib and the control groups.
| lncRNAs ID | Celecoxib | Control | Fold change | q value |
|---|
| Upregulated |
|
|
lnc-IGFL3-2:1 | 18.43 | 44.60 | 1.27 |
1.07×10⁻⁷ |
|
lnc-PTMS-1:3 | 427.83 | 613.56 | 0.52 |
1.71×10⁻⁶ |
|
lnc-SCD-1:13 | 105.06 | 152.80 | 0.54 |
1.71×10⁻⁶ |
|
lnc-TNS4-2:1 | 6.28 | 15.94 | 1.34 |
1.71×10⁻⁶ |
|
lnc-TTLL10-3:1 | 7.71 | 11.67 | 0.60 |
2.91×10⁻⁵ |
|
lnc-CKMT1A-1:1 | 50.37 | 97.92 | 0.96 |
5.80×10⁻⁵ |
|
lnc-LRR1-1:2 | 4422.95 | 5914.51 | 0.42 |
6.36×10⁻⁵ |
|
lnc-RAB3IL1-2:1 | 2279.25 | 3231.60 | 0.50 |
7.18×10⁻⁴ |
|
lnc-JUNB-1:1 | 372.34 | 562.08 | 0.59 |
2.00×10⁻³ |
|
lnc-RP11-259P6.1.1–2:1 | 29.78 | 39.57 | 0.41 |
3.20×10⁻³ |
|
lnc-IGFL2-2:1 | 105.84 | 167.35 | 0.66 |
5.76×10⁻³ |
|
lnc-S100P-3:1 | 142.85 | 240.91 | 0.75 |
6.65×10⁻³ |
|
lnc-SRGAP3-1:29 | 0 | 1.73 | 1.80e+308 |
1.19×10⁻² |
|
lnc-RAB44-3:1 | 8.43 | 14.88 | 0.82 |
1.25×10⁻² |
|
lnc-GLTSCR2-2:7 | 18.58 | 26.75 | 0.53 |
1.26×10⁻² |
|
lnc-PDZD7-3:2 | 0 | 3.41 | 1.80e+308 |
2.41×10⁻² |
|
lnc-CEACAM6-1:1 | 33.20 | 57.59 | 0.79 |
2.51×10⁻² |
|
lnc-SPNS3-1:3 | 18.58 | 27.11 | 0.54 |
4.89×10⁻² |
|
lnc-UNC5B-1:1 | 12.62 | 18.20 | 0.53 |
4.89×10⁻² |
| Downregulated |
|
|
lnc-C9orf16-2:1 | 875.46 | 425.36 | −1.04 | 0 |
|
lnc-C9orf16-3:1 | 352.54 | 156.14 | −1.17 | 0 |
|
lnc-TRIM31-1:2 | 47.17 | 21.45 | −1.14 |
4.10×10⁻⁸ |
|
lnc-DDX47-3:1 | 211.38 | 145.19 | −0.54 |
1.46×10⁻⁷ |
|
lnc-PCK1-3:1 | 13.92 | 5.48 | −1.35 |
8.52×10⁻⁷ |
|
lnc-MYO16-7:1 | 349.12 | 200.98 | −0.80 |
1.71×10⁻⁶ |
|
lnc-YPEL5-5:1 | 71.82 | 44.54 | −0.69 |
1.71×10⁻⁶ |
|
lnc-TNK2-8:1 | 16.60 | 2.33 | −2.83 |
4.54×10⁻⁶ |
|
lnc-AC069257.9.1-4:73 | 124.40 | 66.92 | −0.90 |
6.69×10⁻⁵ |
|
lnc-CCDC80-1:4 | 18.79 | 3.17 | −2.57 |
1.74×10⁻³ |
|
lnc-AC069257.9.1-4:72 | 151.58 | 81.26 | −0.90 |
5.89×10⁻³ |
|
lnc-KRT36-1:1 | 45.00 | 18.61 | −1.27 |
6.65×10⁻³ |
|
lnc-CCDC33-1:1 | 32.45 | 19.88 | −0.71 |
8.64×10⁻³ |
|
lnc-CXCL3-1:1 | 5.06 | 1.51 | −1.74 |
2.51×10⁻² |
|
lnc-PDZK1IP1-3:1 | 25.26 | 11.57 | −1.13 |
3.28×10⁻² |
|
lnc-SUSD3-4:2 | 19.48 | 9.17 | −1.09 |
3.37×10⁻² |
|
lnc-AC069257.9.1-4:53 | 99.18 | 57.43 | −0.79 |
3.59×10⁻² |
|
lnc-AP000974.1-1:1 | 36.09 | 16.13 | −1.16 |
4.79×10⁻² |
Functional and pathway enrichment
analysis for DEGs
GO enrichment analysis demonstrated that 672, 108
and 120 terms in the BP, CC and MF categories, respectively, were
identified as upregulated genes (Table
II), and 453, 45 and 67 terms were identified for downregulated
genes (Table III). The most
enriched GO terms in the categories for upregulated genes were as
follows: BP, CC and MF categories for upregulated genes were small
molecule metabolic processes (P=1.87×10⁻⁹),
extracellular region (P=3.64×10⁻²³) and protein binding
(P=7.34×10⁻⁷), respectively (Table II). The most enriched GO terms in
the BP, CC and MF categories for downregulated genes were tissue
development (P=4.66×10⁻⁸); extracellular region
(P=1.02×10⁻¹⁰) and protein kinase C binding
(P=1.31×10⁻³), respectively (Table III).
| Table II.Top five enriched gene ontology terms
in biological process, cellular component and molecular function
categories for upregulated DEGs. |
Table II.
Top five enriched gene ontology terms
in biological process, cellular component and molecular function
categories for upregulated DEGs.
| A, Biological
process |
|---|
|
|---|
| GO_ID | Term | Count | P-value | DEGs |
|---|
| GO:0044281 | Small molecule
metabolic process | 99 |
1.87×10⁻⁹ | ABCC3, ACAA1,
B3GNT3, CD320, DDX11, ECHS1, FA2H, GAPDH, UQCRFS1,
WNT11a |
| GO:0055114 | Oxidation-reduction
process | 44 |
9.79×10⁻⁹ | ACAA1, ACSS2,
COX8A, ECHS1, FA2H, HMOX1, UQCRC1, UQCRC2, UQCRFS1,
VAT1a |
| GO:0044710 | Single-organism
metabolic process | 137 |
3.01×10⁻⁸ | ABCC3, ACAA1,
B3GNT3, BMP4, PCBD1, PSMD8, RHOB, VAT1, WNT11, XRCC6a |
| GO:0043436 | Oxoacid metabolic
process | 44 |
6.07×10⁻⁸ | ABCC3, ACAA1,
B3GNT3, CKMT1A, ECHS1, SOD1, SULT2B1, TPI1, TST,
UGT1A6a |
| GO:0006082 | Organic acid
metabolic process | 44 |
9.50×10⁻⁸ | ABCC3, ACAA1,
B3GNT3, CKMT1A, GOT1, SERINC2, SLC2A1, TPI1, TST,
UGT1A6a |
|
| B, Cellular
component |
|
| GO_ID | Term | Count | P-value | DEGs |
|
| GO:0005576 | Extracellular
region | 138 |
3.64×10⁻²³ | ADIRF, BMP4,
CAPG, IL1RN, ITGA3, ITGA6, ITGB4, ITGB5, VAT1, VDAC1a |
| GO:0031982 | Vesicle | 129 |
5.68×10⁻²⁰ | ADIRF, AHNAK2,
ENO1, ITGA3, ITGB4, ITGB5, SFN, UQCRC2, VASP, VAT1a |
| GO:0031988 | Membrane-bounded
vesicle | 126 |
4.25×10⁻¹⁸ | ADIRF, ATP6AP1,
BAIAP2L2, CAPG, EPS8L1, FTH1, FURIN, GAPDH, UQCRC2,
VASPa |
| GO:0043230 | Extracellular
organelle | 118 |
2.21×10⁻¹⁸ | ADIRF, GOT1,
ITGA3, ITGB4, ITGB5, KLK14, UGT1A6, UPK3B, UQCRC2,
VASPa |
| GO:0044421 | Extracellular
region | 131 |
8.27×10⁻¹³ | ADIRF, HMOX1,
IL1RN, ITGA3, ITGA6, ITGB4, ITGB5, KLK14, TXN, WNT11a |
|
| C, Molecular
function |
|
| GO_ID | Term | Count | P-value | DEGs |
|
| GO:0005515 | Protein
binding | 182 |
7.34×10⁻⁷ | AATK, HSP90AA1,
IRF2BP1, ITGA3, ITGA6, ITGB4, ITGB5, UQCRFS1, VASP,
VDAC1a |
| GO:0016491 | Oxidoreductase
activity | 31 |
9.29×10⁻⁷ | ACAA1, GAPDH,
HMOX1, HPDL, HR, LDHA, MAOB, NDUFS3, PCBD1, PIRa |
| GO:0043236 | Laminin
binding | 6 |
7.96×10⁻⁶ | ECM1, GPC1,
ITGA3, ITGA6, LGALS1, LYPD3 |
| GO:0050840 | Extracellular
matrix binding | 7 |
2.07×10⁻⁵ | ECM1, GPC1,
GPR56, ITGA3, ITGA6, LGALS1, LYPD3 |
| GO:0008106 | Alcohol
dehydrogenase (NADP+) activity | 4 |
3.68×10⁻⁵ | AKR1B1, AKR1C2,
AKR1C3, ALDH3A1 |
| Table III.Top five enriched gene ontology terms
in the biological process, cellular component and molecular
function categories for downregulated DEGs. |
Table III.
Top five enriched gene ontology terms
in the biological process, cellular component and molecular
function categories for downregulated DEGs.
| A, Biological
process |
|---|
|
|---|
| GO_ID | Term | Count | P-value | DEGs |
|---|
| GO:0009888 | Tissue
development | 42 |
4.66×10⁻⁸ | ADAM9, ALDH1A3,
FNDC3B, NTN4, PKP2, RIPK4, TNFRSF19, TRIM16, TSC22D3,
WNT7Ba |
| GO:0048513 | Organ
development | 58 |
1.90×10⁻⁷ | ADAM9, EGLN1,
LTBP3, MAP3K1, MDK, NRIP1, TNFRSF19, TNS3, TRIM16,
TSC22D3a |
| GO:0048731 | System
development | 70 |
6.10×10⁻⁷ | ADAM9, SGPL1,
TNFAIP2, TNFRSF19, TNS3, TRIM16, TRIO, TSC22D3, WNT7B,
ZSWIM6a |
| GO:0048518 | Positive regulation
of biological process | 74 |
6.85×10⁻⁷ | ADAM9, GLIS3,
HSPB1, IGFBP3, IRF1, ITGB8, KLK6, TRIM16, TRIO, WNT7Ba |
| GO:0009653 | Anatomical
structure morphogenesis | 49 |
7.77×10⁻⁷ | ADAM9, MAP1B,
MAP2, NTN4, PKP2, PTPRJ, RIPK4, SAT1, SEMA7A, SGPL1a |
|
| B, Cellular
component |
|
| GO_ID | Term | Count | P-value | DEGs |
|
| GO:0044421 | Extracellular
region | 73 |
1.02×10⁻¹⁰ | ADAM9, CCDC80,
CLIC5, FRAS1, SNX18, SOSTDC1, ST6GAL1, SULF2, TNFAIP2,
VWA2a |
| GO:0005615 | Extracellular
space | 35 |
1.02×10⁻⁸ | ADAM9, HSPG2,
IGFBP3, MUC4, PLAT, POTEF, SERPINA3, TNFAIP2, VWA2,
WNT7Ba |
| GO:0005576 | Extracellular
region | 77 |
1.78×10⁻⁸ | ADAM9, KRT15,
LCN2, SLC7A5, SNX18, SOSTDC1, ST6GAL1, SULF2, TACSTD2,
TGM2a |
| GO:0043230 | Extracellular
organelle | 56 |
1.92×10⁻⁸ | ADAM9, IVL,
KRT13, MYOF, PLAT, POTEF, SLC7A5, SNX18, ST6GAL1,
TACSTD2a |
| GO:0065010 | Extracellular
organelle, membrane-bound | 56 |
1.92×10⁻⁸ | ADAM9, IGFBP3,
LTBP3, MARCKS, SELENBP1, SNX18, ST6GAL1, TGM2, THSD4,
VWA2a |
|
| C, Molecular
function |
|
| GO_ID | Term | Count | P-value | DEGs |
|
| GO:0005080 | Protein kinase C
binding | 4 |
1.31×10⁻³ | ADAM9, HSPB1,
MARCKS, PKP2 |
| GO:0008009 | Chemokine
activity | 4 |
1.42×10⁻³ | CXCL1, CXCL3,
CXCL5, CXCL8 |
| GO:0019838 | Growth factor
binding | 6 |
1.43×10⁻³ | BMPR2, CTGF,
IGFBP3, IGFBP6, LTBP3, TRIM16 |
| GO:0031994 | Insulin-like growth
factor I binding | 2 |
2.28×10⁻³ | IGFBP3,
IGFBP6 |
| GO:0055106 | Ubiquitin-protein
transferase regulator activity | 2 |
2.28×10⁻³ | CDKN2A,
TRIB1 |
According to the pathway enrichment analysis, 28 and
7 pathways were identified for the upregulated and downregulated
genes, respectively (Table IV). The
upregulated genes were significantly enriched in the
glycolysis/gluconeogenesis (P=1.03×10⁻⁶), metabolic
pathways (P=6.04×10⁻⁵), phenylalanine metabolism
(P=4.00×10⁻⁴), oxidative phosphorylation
(P=2.11×10⁻²) and the metabolism of xenobiotics by
cytochrome P450 (P=4.14×10⁻³) (Table IV).
| Table IV.Top ten enriched pathways for
upregulated differentially expressed genes and seven enriched
pathways for downregulated DEGs. |
Table IV.
Top ten enriched pathways for
upregulated differentially expressed genes and seven enriched
pathways for downregulated DEGs.
| Pathway | Count | P-value | Gene symbol |
|---|
| Upregulated |
|
|
Glycolysis/gluconeogenesis | 10 |
1.03×10⁻⁶ | ACSS2, ALDH3A1,
ALDOA, ENO1, ENO2, GAPDH, LDHA, PGM1, PKM, TPI1 |
|
Metabolic pathways | 43 |
6.04×10⁻⁵ | ACAA1, ACSL5,
ACSS2, AGPAT2, AK1, AKR1B1, ALDH1A1, ALDH3A1, ALDOA, ALPP, ALPPL2,
ATP5G1, ATP5G3, ATP6AP1, B3GNT3, CKMT1A, CKMT1B, COX8A, CYC1,
ECHS1, ENO1, ENO2, GAPDH, GOT1, ITPK1, LDHA, MAOB, MGAT3, NDUFS3,
NT5E, PGM1, PGP, PIK3C2B, PKM, PLA2G4B, PLCE1, PRDX6, TPI1, TST,
UGT1A6, UQCRC1, UQCRC2, UQCRFS1 |
|
Phenylalanine metabolism | 4 |
4.00×10⁻⁴ | ALDH3A1, GOT1,
MAOB, PRDX6 |
|
Parkinson's disease | 10 |
4.67×10⁻⁴ | ATP5G1, ATP5G3,
COX8A, CYC1, NDUFS3, SLC25A5, UQCRC1, UQCRC2, UQCRFS1,
VDAC1 |
|
Huntington's disease | 12 |
5.52×10⁻⁴ | ATP5G1, ATP5G3,
CLTB, COX8A, CYC1, NDUFS3, SLC25A5, SOD1, UQCRC1, UQCRC2, UQCRFS1,
VDAC1 |
| Prion
diseases | 5 |
8.46×10⁻⁴ | EGR1, HSPA1A,
MAPK3, SOD1, STIP1 |
|
Oxidative phosphorylation | 9 |
2.11×10⁻³ | ATP5G1, ATP5G3,
ATP6AP1, COX8A, CYC1, NDUFS3, UQCRC1, UQCRC2, UQCRFS1 |
|
Alzheimer's disease | 10 |
3.16×10⁻³ | ATP5G1, ATP5G3,
COX8A, CYC1, GAPDH, MAPK3, NDUFS3, UQCRC1, UQCRC2, UQCRFS1 |
|
Metabolism of xenobiotics by
cytochrome P450 | 6 |
4.14×10⁻³ | AKR1C2, AKR1C3,
ALDH3A1, CYP1B1, EPHX1, UGT1A6 |
| Cardiac
muscle contraction | 6 |
6.17×10⁻³ | ATP1A1, COX8A,
CYC1, UQCRC1, UQCRC2, UQCRFS1 |
| Downregulated |
|
|
Epithelial cell signaling in
H. pylori infection | 3 |
2.92×10⁻² | CXCL1, CXCL8,
MAP3K14 |
|
Complement and coagulation
cascades | 3 |
3.03×10⁻² | C3, PLAT,
SERPINA1 |
|
Histidine metabolism | 2 |
3.29×10⁻² | ALDH1A3,
AOC1 |
|
Arrhythmogenic right
ventricular cardiomyopathy | 3 |
3.62×10⁻² | ITGB6, ITGB8,
PKP2 |
| Axon
guidance | 4 |
3.80×10⁻² | EFNB2, NFAT5,
NTN4, SEMA7A |
|
Chemokine signaling
pathway | 5 |
3.80×10⁻² | BCAR1, CXCL1,
CXCL3, CXCL5, CXCL8 |
|
Cytokine-cytokine receptor
interaction | 6 |
4.55×10⁻² | BMPR2, CXCL1,
CXCL3, CXCL5, CXCL8, TNFRSF19 |
The downregulated genes were enriched in epithelial
cell signaling in Helicobacter pylori infection (involving,
CXCL1 and CXCL8; P=2.92×10⁻²), complement
and coagulation cascades (P=3.03×10⁻²), arrhythmogenic
right ventricular cardiomyopathy (P=3.62×10⁻²),
chemokine signaling pathway (involving CXCL1, CXCL3,
CXCL5 and CXCL8; P=3.80×10⁻²) and
cytokine-cytokine receptor interaction (involving CXCL1,
CXCL3, CXCL5 and CXCL8;
P=4.55×10⁻²) (Table
IV).
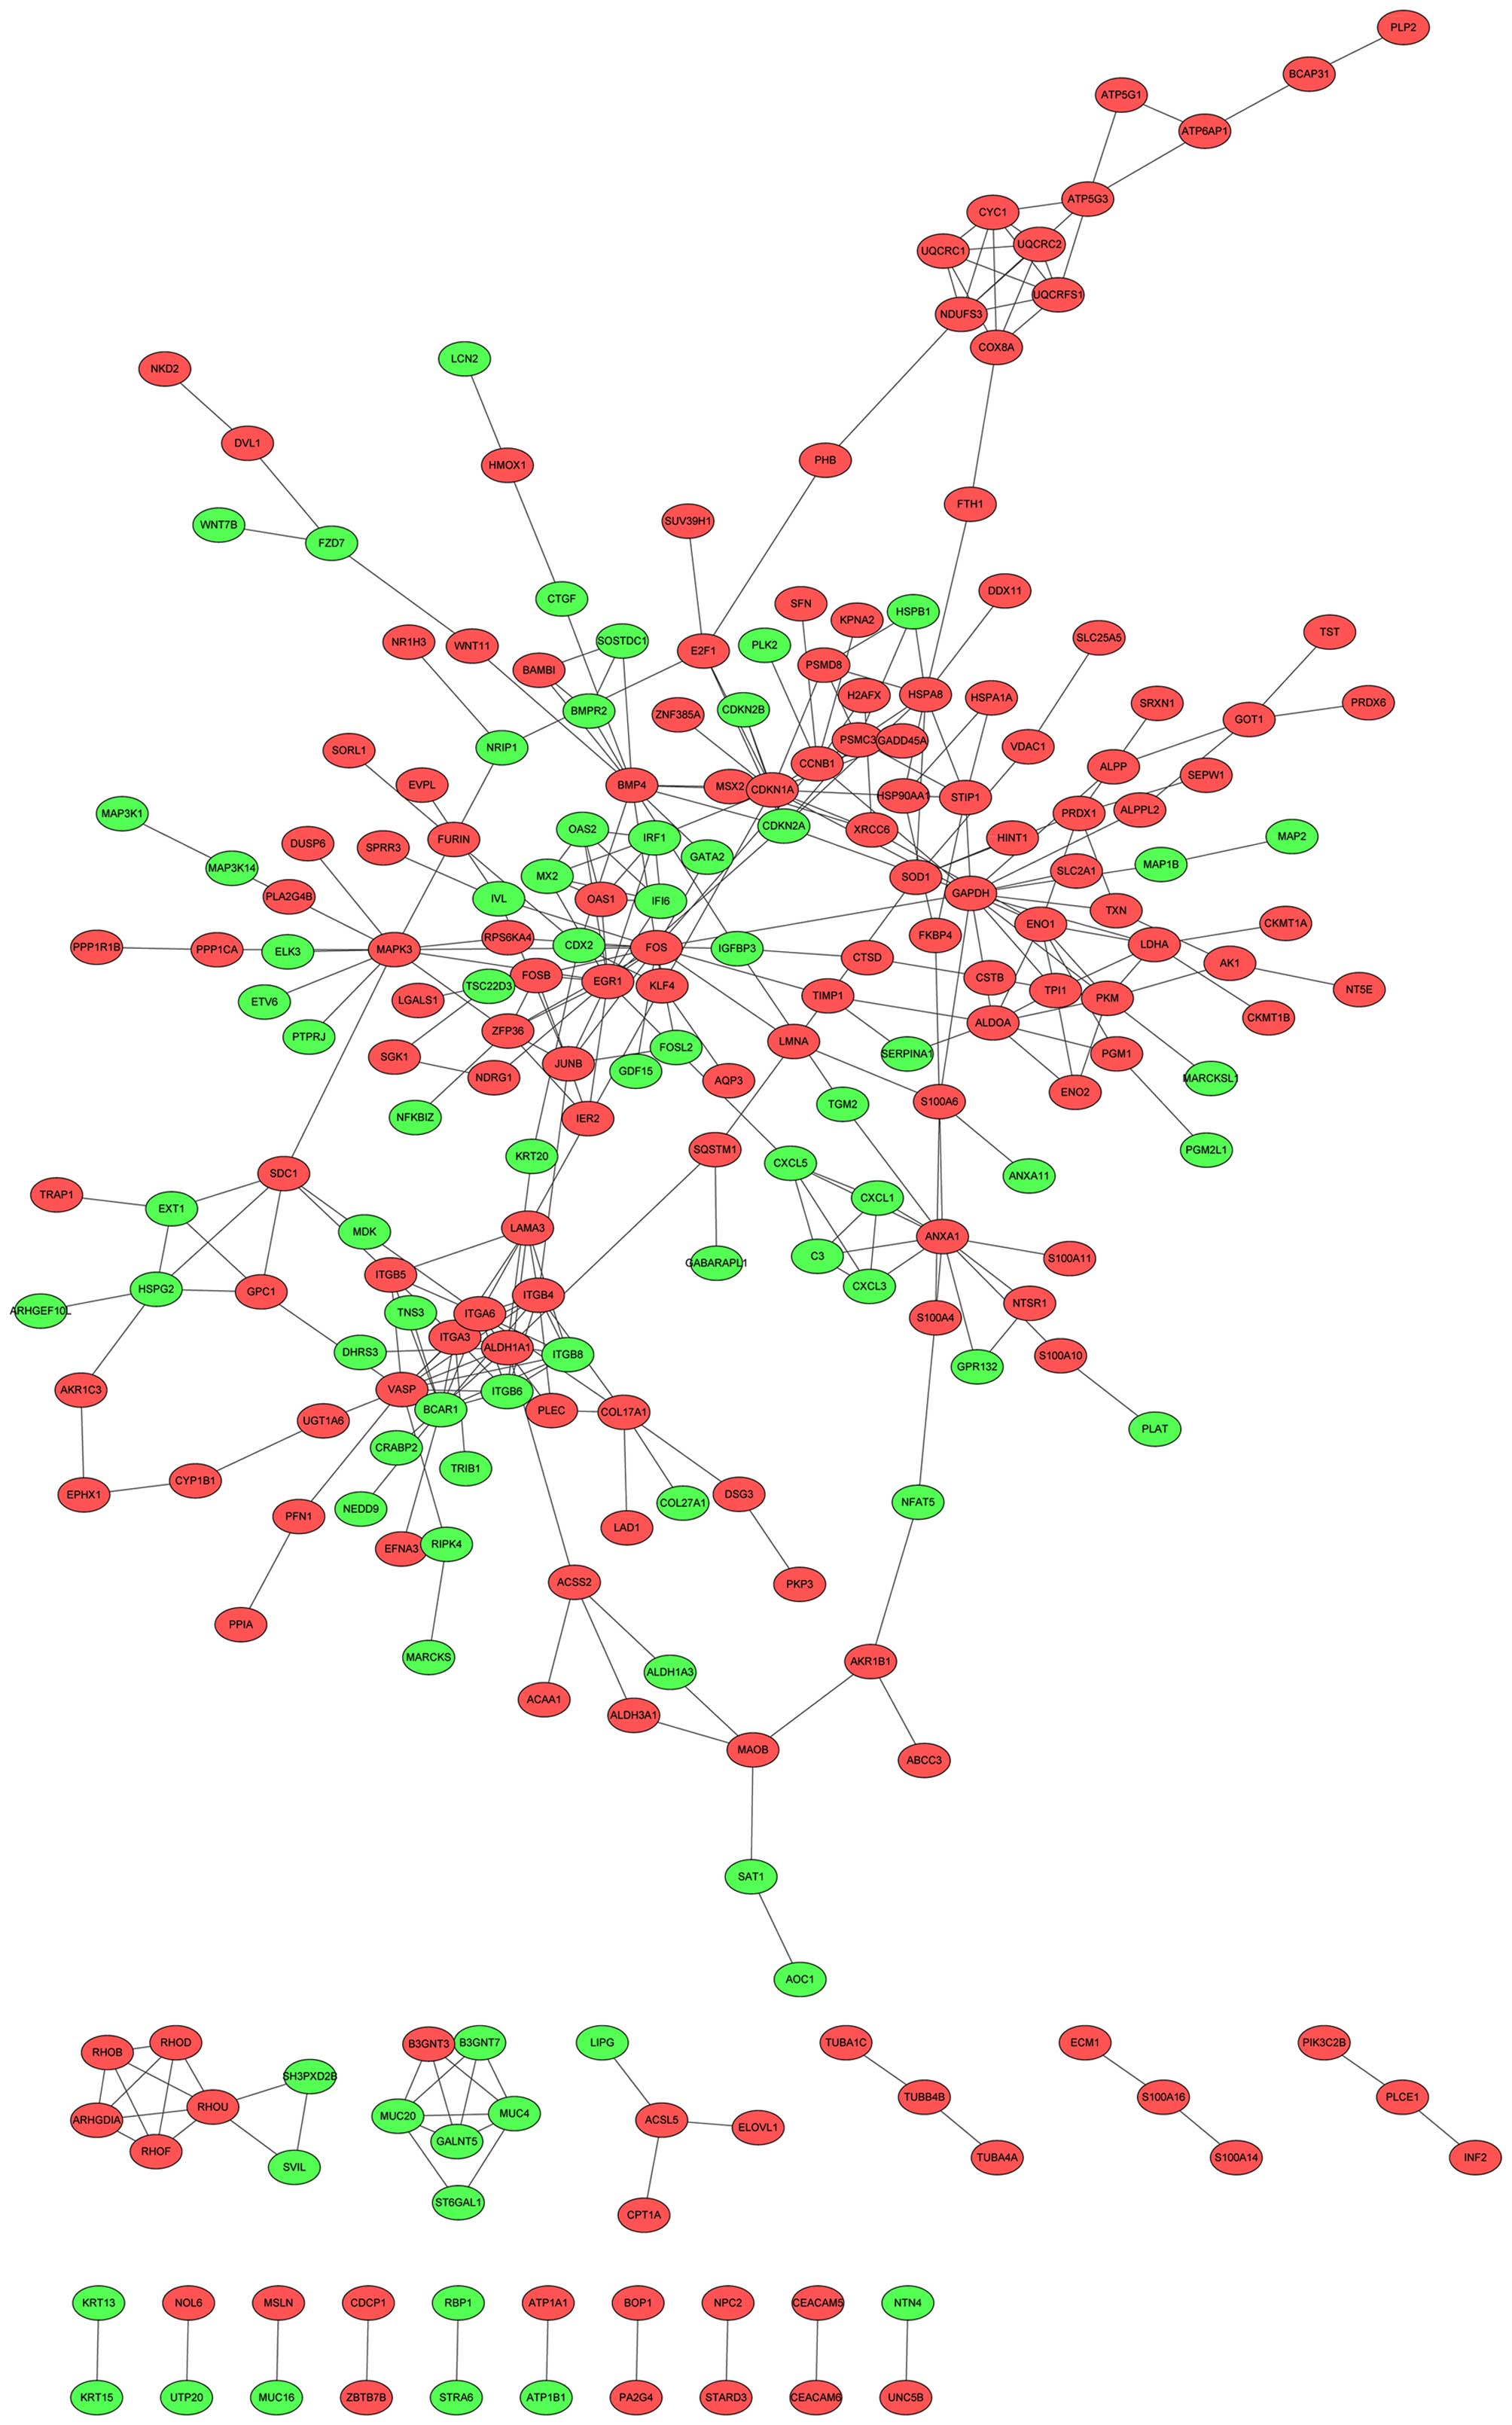
PPI network and module analysis
After the PPIs of DEGs were predicted using the
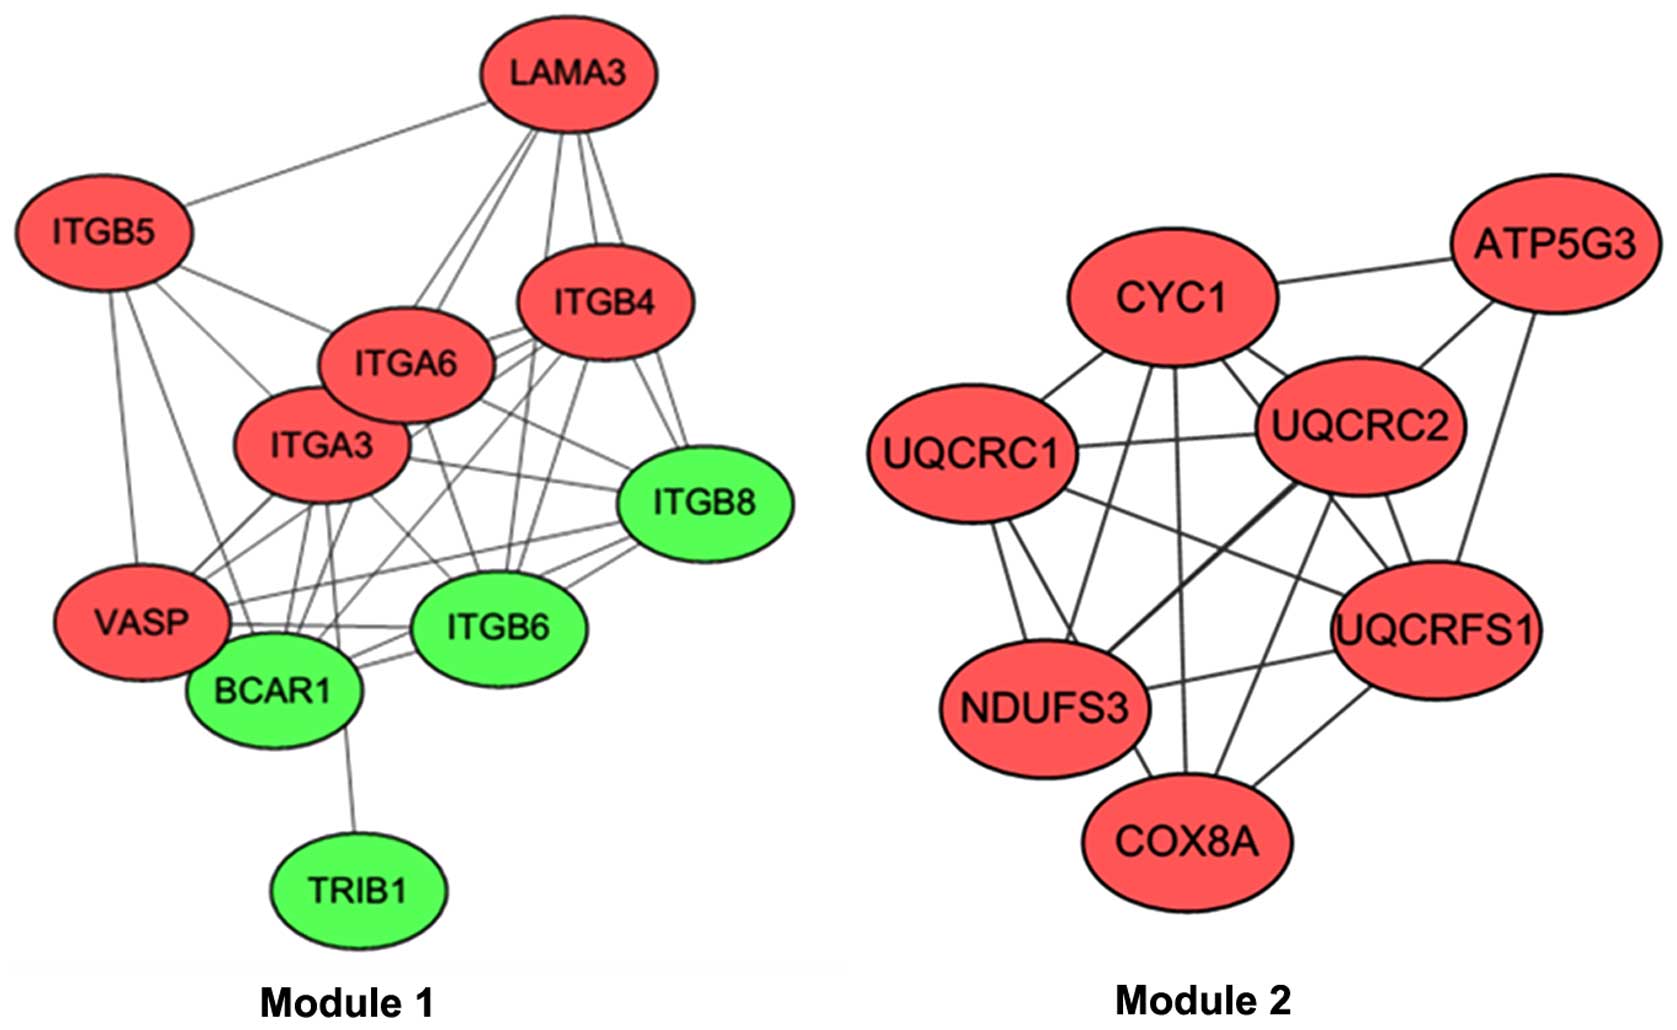
STRING database, the PPI network was visualized (Fig. 1). Based on the ClusterONE plugin, two
modules with the highest significance (module 1,
P=9.96×10⁻⁵, nodes=10; module 2, P=8.98×10⁻⁴,
nodes=7) were selected (Fig. 2).
The DEGs in module 1 (including, ITGB6,
ITGA6, ITGB4, ITGB5, ITGA3 and
ITGB8) were most significantly associated with functions of
the integrin complex (CC, P=3.33×10⁻¹⁵), the protein
complex involved in cell adhesion (CC, P=3.33×10⁻¹⁵) and
the integrin-mediated signaling pathway (BP,
P=1.34×10⁻¹⁴) (Table V).
In module 2, DEGs were involved in the respiratory electron
transport chain (BP, P=4.60×10⁻¹³) and the electron
transport chain (BP, P=5.17×10⁻¹³) (Table VI).
| Table V.Top five enriched gene ontology terms
in biological process, cellular component and molecular function
categories for DEGs in module 1. |
Table V.
Top five enriched gene ontology terms
in biological process, cellular component and molecular function
categories for DEGs in module 1.
| A, Biological
process |
|---|
|
|---|
| GO_ID | Term | Count | P-value | DEG |
|---|
| GO:0007229 | Integrin-mediated
signaling pathway | 7 |
1.34×10⁻¹⁴ | ITGB6, BCAR1,
ITGA6, ITGB4, ITGB5, ITGA3, ITGB8 |
| GO:0030198 | Extracellular
matrix organization | 7 |
3.66×10⁻¹⁰ | ITGB6, LAMA3,
ITGA6, ITGB4, ITGB5, ITGA3, ITGB8 |
| GO:0043062 | Extracellular
structure organization | 7 |
3.73×10⁻¹⁰ | ITGB6, LAMA3,
ITGA6, ITGB4, ITGB5, ITGA3, ITGB8 |
| GO:0007155 | Cell adhesion | 8 |
1.30×10⁻⁸ | ITGB6, BCAR1,
LAMA3, ITGA6, ITGB4, ITGB5, ITGA3, ITGB8 |
| GO:0022610 | Biological
adhesion | 8 |
1.35×10⁻⁸ | ITGB6, BCAR1,
LAMA3, ITGA6, ITGB4, ITGB5, ITGA3, ITGB8 |
|
| B, Cellular
component |
|
| GO_ID | Term | Count | P-value | DEG |
|
| GO:0008305 | Integrin
complex | 6 |
3.33×10⁻¹⁵ | ITGB6, ITGA6,
ITGB4, ITGB5, ITGA3, ITGB8 |
| GO:0098636 | Protein complex
involved in cell adhesion | 6 |
3.33×10⁻¹⁵ | ITGB6, ITGA6,
ITGB4, ITGB5, ITGA3, ITGB8 |
| GO:0043235 | Receptor
complex | 6 |
2.87×10⁻⁹ | ITGB6, ITGA6,
ITGB4, ITGB5, ITGA3, ITGB8 |
| GO:0030055 | Cell-substrate
junction | 6 |
2.02×10⁻⁸ | BCAR1, VASP,
ITGA6, ITGB4, ITGB5, ITGA3 |
| GO:0009986 | Cell surface | 6 |
4.88×10⁻⁷ | ITGB6, ITGA6,
ITGB4, ITGB5, ITGA3, ITGB8 |
|
| C, Molecular
function |
|
| GO_ID | Term | Count | P-value | DEG |
|
| GO:0005178 | Integrin
binding | 4 |
3.15×10⁻⁷ | ITGB6, ITGA6,
ITGB5, ITGA3 |
| GO:0050839 | Cell adhesion
molecule binding | 4 |
2.35×10⁻⁶ | ITGB6, ITGA6,
ITGB5, ITGA3 |
| GO:0005102 | Receptor
binding | 7 |
2.36×10⁻⁶ | ITGB6, LAMA3,
ITGA6, ITGB4, ITGB5, ITGA3, ITGB8 |
| GO:0043236 | Laminin
binding | 2 |
1.47×10⁻⁴ | ITGA6,
ITGA3 |
| GO:0050840 | Extracellular
matrix binding | 2 |
4.39×10⁻⁴ | ITGA6,
ITGA3 |
| Table VI.Top five enriched gene ontology terms
in biological process, cellular component and molecular function
categories for DEGs in module 2. |
Table VI.
Top five enriched gene ontology terms
in biological process, cellular component and molecular function
categories for DEGs in module 2.
| A, Biological
process |
|---|
|
|---|
| GO_ID | Term | Count | P-value | DEGs |
|---|
| GO:0022904 | Respiratory
electron transport chain | 6 |
4.60×10⁻¹³ | CYC1, COX8A,
UQCRC1, NDUFS3, UQCRC2, UQCRFS1 |
| GO:0022900 | Electron transport
chain | 6 |
5.17×10⁻¹³ | CYC1, COX8A,
UQCRC1, NDUFS3, UQCRC2, UQCRFS1 |
| GO:0045333 | Cellular
respiration | 6 |
6.05×10⁻¹² | CYC1, COX8A,
UQCRC1, NDUFS3, UQCRC2, UQCRFS1 |
| GO:0015980 | Energy derivation
by oxidation of organic compounds | 6 |
5.80×10⁻¹⁰ | CYC1, COX8A,
UQCRC1, NDUFS3, UQCRC2, UQCRFS1 |
| GO:0006091 | Generation of
precursor metabolites and energy | 6 |
2.32×10⁻⁹ | CYC1, COX8A,
UQCRC1, NDUFS3, UQCRC2, UQCRFS1 |
|
| B, Cellular
component |
|
| GO_ID | Term | Count | P-value | DEGs |
|
| GO:0005743 | Mitochondrial inner
membrane | 7 |
1.67×10⁻¹² | ATP5G3, CYC1,
COX8A, UQCRC1, NDUFS3, UQCRC2, UQCRFS1 |
| GO:0019866 | Organelle inner
membrane | 7 |
3.57×10⁻¹² | ATP5G3, CYC1,
COX8A, UQCRC1, NDUFS3, UQCRC2, UQCRFS1 |
| GO:0070469 | Respiratory
chain | 5 |
2.12×10⁻¹¹ | CYC1, UQCRC1,
NDUFS3, UQCRC2, UQCRFS1 |
| GO:0031966 | Mitochondrial
membrane | 7 |
2.30×10⁻¹¹ | ATP5G3, CYC1,
COX8A, UQCRC1, NDUFS3, UQCRC2, UQCRFS1 |
| GO:0005740 | Mitochondrial
envelope | 7 |
3.57×10⁻¹¹ | ATP5G3, CYC1,
COX8A, UQCRC1, NDUFS3, UQCRC2, UQCRFS1 |
|
| C, Molecular
function |
|
| GO_ID | Term | Count | P-value | DEGs |
|
| GO:0015078 | Hydrogen ion
transmembrane transporter activity | 4 |
4.15×10⁻⁸ | ATP5G3, COX8A,
UQCRC1, UQCRFS1 |
| GO:0008121 |
Ubiquinol-cytochrome-c reductase
activity | 2 |
3.57×10⁻⁶ | UQCRC1,
UQCRFS1 |
| GO:0016681 | Oxidoreductase
activity, acting on diphenols and related substances as donors,
cytochrome as acceptor | 2 |
3.57×10⁻⁶ | UQCRC1,
UQCRFS1 |
| GO:0016679 | Oxidoreductase
activity, acting on diphenols and related substances as donors | 2 |
4.76×10⁻⁶ | UQCRC1,
UQCRFS1 |
| GO:0015077 | Monovalent
inorganic cation transmembrane transporter activity | 4 |
6.29×10⁻⁶ | ATP5G3, COX8A,
UQCRC1, UQCRFS1 |
The DEGs in module 1 were most significantly
enriched in the focal adhesion pathway (P=5.20×10⁻¹⁴)
and the extracellular matrix (ECM)-receptor interaction pathway
(P=3.66×10⁻¹²) (Table
VII). In addition, the DEGs in module 2 were enriched in
Parkinson's disease (P=2.23×10⁻¹²), oxidative
phosphorylation (P=2.49×10⁻¹²), Alzheimer's disease
(P=1.33×10⁻¹¹), Huntington's disease
(P=2.56×10⁻¹¹) and metabolic pathways
(P=9.66×10⁻⁶) (Table
VII).
| Table VII.The 13 and 6 enriched pathways for
differentially expressed genes in modules 1 and 2,
respectively. |
Table VII.
The 13 and 6 enriched pathways for
differentially expressed genes in modules 1 and 2,
respectively.
| Pathway | Count | P-value | Gene symbol |
|---|
| A, Module 1 |
|
| Focal adhesion | 9 |
5.20×10⁻¹⁴ | ITGB6, BCAR1,
VASP, LAMA3, ITGA6, ITGB4, ITGB5, ITGA3, ITGB8 |
| ECM-receptor
interaction | 7s |
3.66×10⁻¹² | ITGB6, LAMA3,
ITGA6, ITGB4, ITGB5, ITGA3, ITGB8 |
| Arrhythmogenic
right ventricular cardiomyopathy | 6 |
2.67×10⁻¹⁰ | ITGB6, ITGA6,
ITGB4, ITGB5, ITGA3, ITGB8 |
| Hypertrophic
cardiomyopathy | 6 |
5.41×10⁻¹⁰ | ITGB6, ITGA6,
ITGB4, ITGB5, ITGA3, ITGB8 |
| Dilated
cardiomyopathy | 6 |
8.90×10⁻¹⁰ | ITGB6, ITGA6,
ITGB4, ITGB5, ITGA3, ITGB8 |
| Regulation of actin
cytoskeleton | 7 |
2.55×10⁻⁹ | ITGB6, BCAR1,
ITGA6, ITGB4, ITGB5, ITGA3, ITGB8 |
| Small cell lung
cancer | 3 |
2.31×10⁻⁴ | LAMA3, ITGA6,
ITGA3 |
| Hematopoietic cell
lineage | 2 |
7.47×10⁻³ | ITGA6,
ITGA3 |
| Pathways in
cancer | 3 |
1.11×10⁻² | LAMA3, ITGA6,
ITGA3 |
| Leukocyte
transendothelial migration | 2 |
1.27×10⁻² | BCAR1,
VASP |
| Toxoplasmosis | 2 |
1.63×10⁻² | LAMA3,
ITGA6 |
| Cell adhesion
molecules | 2 |
1.65×10⁻² | ITGA6,
ITGB8 |
|
| B, Module 2 |
|
| Parkinson's
disease | 7 |
2.23×10⁻¹² | ATP5G3, CYC1,
COX8A, UQCRC1, NDUFS3, UQCRC2, UQCRFS1 |
| Oxidative
phosphorylation | 7 |
2.49×10⁻¹² | ATP5G3, CYC1,
COX8A, UQCRC1, NDUFS3, UQCRC2, UQCRFS1 |
| Alzheimer's
disease | 7 |
1.33×10⁻¹¹ | ATP5G3, CYC1,
COX8A, UQCRC1, NDUFS3, UQCRC2, UQCRFS1 |
| Huntington's
disease | 7 |
2.56×10⁻¹¹ | ATP5G3, CYC1,
COX8A, UQCRC1, NDUFS3, UQCRC2, UQCRFS1 |
| Cardiac muscle
contraction | 5 |
7.02×10⁻⁹ | CYC1, COX8A,
UQCRC1, UQCRC2, UQCRFS1 |
| Metabolic
pathways | 7 |
9.66×10⁻⁶ | ATP5G3, CYC1,
COX8A, UQCRC1, NDUFS3, UQCRC2, UQCRFS1 |
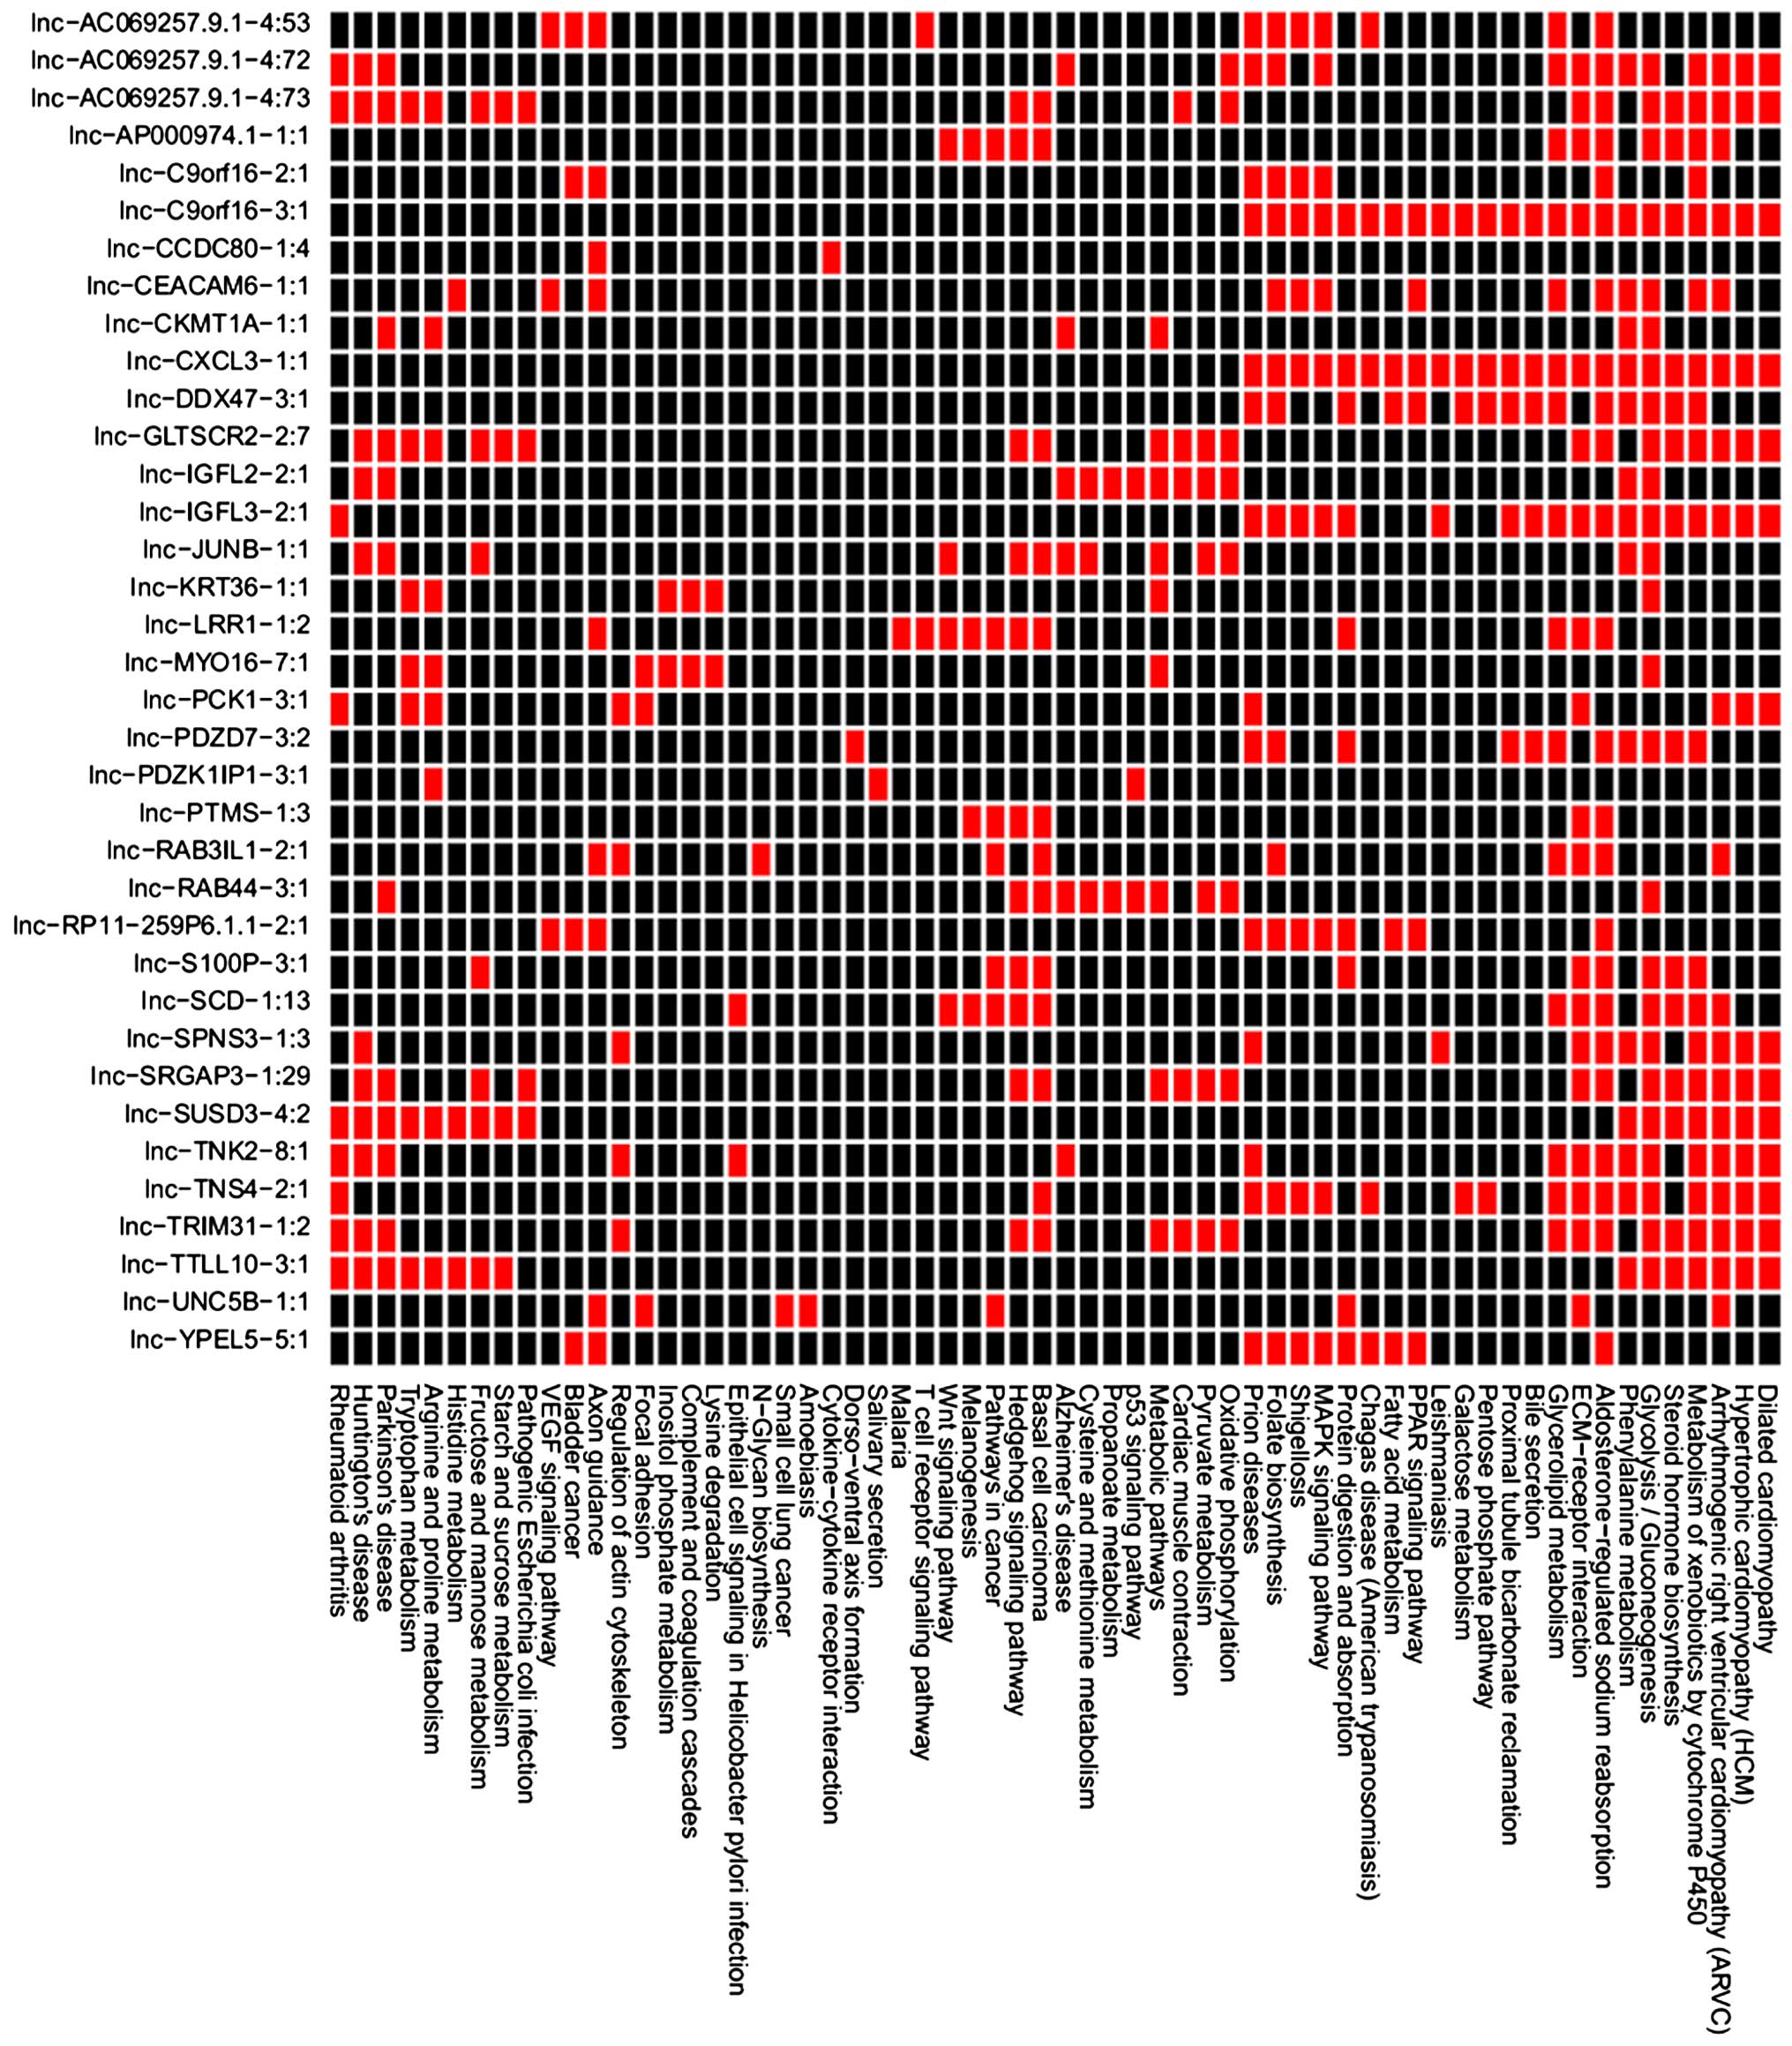
Co-expression analysis of DEGs and
DE-lncRNAs
The pairs of co-expressed genes and lncRNAs were
obtained and the enriched pathways for the DEGs co-expressed with
each DE-lncRNAs are presented in Fig.
3. The DEGs co-expressed with lnc-SCD-1:13, lnc-LRR1-1:2,
lnc-PTMS-1:3, lnc-S100P-3:1, lnc-AP000974.1-1:1 and lnc-RAB3IL1-2:1
were enriched in the pathways associated with cancer, such as basal
cell carcinoma, pathways in cancer and ECM-receptor interaction
(Table VIII). The DEGs
co-expressed with lnc-SCD-1:13, lnc-LRR1-1:2 and lnc-S100P-3:1 were
enriched in the Wnt signaling pathway (Table VIII). The DEGs co-expressed with
lnc-SCD-1:13, lnc-LRR1-1:2, lnc-PTMS-1:3, lnc-S100P-3:1 and
lnc-AP000974.1-1:1 were enriched in the Hedgehog signaling pathway
(Table VIII).
| Table VIII.The DEGs co-expressed with
differentially expressed lncRNAs associated with pathways in
cancer. |
Table VIII.
The DEGs co-expressed with
differentially expressed lncRNAs associated with pathways in
cancer.
| lncRNA/pathway | DEG |
|---|
| lnc-SCD-1:13 |
|
| Wnt
signaling pathway | DVL1, FZD7,
NFAT5, WNT11, WNT7B |
|
Hedgehog signaling
pathway | BMP4, WNT11,
WNT7B |
| Basal
cell carcinoma | BMP4, DVL1,
FZD7, WNT11, WNT7B |
|
ECM-receptor interaction | HSPG2, ITGA3,
ITGB4, LAMA3, SDC1 |
|
Glycolysis/gluconeogenesis | ALDH1A3, ALDOA,
PKM |
|
Aldosterone-regulated sodium
reabsorption | ATP1A1, SFN,
SGK1 |
|
Glycerolipid metabolism | AGPAT2, AKR1B1,
LIPG |
|
Metabolism of xenobiotics by
cytochrome P450 | AKR1C2, ALDH1A3,
CYP1B1 |
| Steroid
hormone biosynthesis | AKR1C2, CYP1B1,
SULT2B1 |
|
Epithelial cell signaling in
H. pylori infection | ATP6AP1, CXCL8,
MAP3K14 |
|
Pathways in cancer | BMP4, CXCL8,
DVL1, FOS, FZD7, ITGA3, LAMA3, WNT11, WNT7B |
|
Arrhythmogenic right
ventricular cardiomyopathy | ITGA3, ITGB4,
PKP2 |
|
Melanogenesis | DVL1, FZD7,
WNT11, WNT7B |
| lnc-LRR1-1:2 |
|
| Wnt
signaling pathway | DVL1, NFAT5,
WNT11, WNT7B |
| Axon
guidance | EFNA3, NFAT5,
RHOD, UNC5B |
|
ECM-receptor interaction | ITGA3, LAMA3,
SDC1 |
| Basal
cell carcinoma | BMP4, DVL1,
WNT11, WNT7B |
|
Aldosterone-regulated sodium
reabsorption | ATP1A1,
SGK1 |
|
Hedgehog signaling
pathway | BMP4, WNT11,
WNT7B |
|
Malaria | CXCL8,
SDC1 |
|
Glycerolipid metabolism | AGPAT2,
AKR1B1 |
| T cell
receptor signaling pathway | FOS, MAP3K14,
NFAT5 |
|
Pathways in cancer | BMP4, CXCL8,
DVL1, FOS, ITGA3, LAMA3, SLC2A1, WNT11, WNT7B |
|
Melanogenesis | DVL1, WNT11,
WNT7B |
| Protein
digestion and absorption | ATP1A1, KCNE3,
SLC1A5 |
| lnc-PTMS-1:3 |
|
| Basal
cell carcinoma | BMP4, DVL1,
WNT11, WNT7B |
|
Aldosterone-regulated sodium
reabsorption | SFN,
SGK1 |
|
Hedgehog signaling
pathway | BMP4, WNT11,
WNT7B |
|
ECM-receptor interaction | ITGA3, LAMA3,
SDC1 |
|
Pathways in cancer | BMP4, DVL1, FOS,
ITGA3, LAMA3, SLC2A1, WNT11, WNT7B |
|
Melanogenesis | DVL1, WNT11,
WNT7B |
| lnc-S100P-3:1 |
|
|
ECM-receptor interaction | ITGA3, LAMA3,
SDC1 |
| Basal
cell carcinoma | BMP4, DVL1,
WNT11, WNT7B |
|
Glycolysis/gluconeogenesis | ACSS2, ALDH1A3,
ALDOA, ENO2 |
|
Aldosterone-regulated sodium
reabsorption | ATP1A1, SFN,
SGK1 |
|
Hedgehog signaling
pathway | BMP4, WNT11,
WNT7B |
|
Metabolism of xenobiotics by
cytochrome P450 | AKR1C2, ALDH1A3,
CYP1B1 |
| Steroid
hormone biosynthesis | AKR1C2, CYP1B1,
SULT2B1 |
|
Pathways in cancer | BMP4, CXCL8,
DVL1, FOS, ITGA3, LAMA3, SLC2A1, WNT11, WNT7B |
|
Fructose and mannose
metabolism | AKR1B1,
ALDOA |
| Protein
digestion and absorption | ATP1A1, KCNE3,
SLC1A5 |
|
lnc-AP000974.1-1:1 |
|
| Wnt
signaling pathway | DVL1, FZD7,
NFAT5, WNT11, WNT7B |
|
Hedgehog signaling
pathway | BMP4, WNT11,
WNT7B |
| Basal
cell carcinoma | BMP4, DVL1,
FZD7, WNT11, WNT7B |
|
ECM-receptor interaction | HSPG2, ITGA3,
ITGB4, LAMA3, SDC1 |
|
Glycolysis/gluconeogenesis | ALDH1A3, ALDOA,
ENO2, PKM |
|
Aldosterone-regulated sodium
reabsorption | ATP1A1, SFN,
SGK1 |
|
Glycerolipid metabolism | AGPAT2, AKR1B1,
LIPG |
|
Metabolism of xenobiotics by
cytochrome P450 | AKR1C2, ALDH1A3,
CYP1B1 |
| Steroid
hormone biosynthesis | AKR1C2, CYP1B1,
SULT2B1 |
|
Pathways in cancer | BMP4, CXCL8,
DVL1, FOS, FZD7, ITGA3, LAMA3, WNT11, WNT7B |
|
Arrhythmogenic right
ventricular cardiomyopathy | ITGA3, ITGB4,
PKP2 |
|
Melanogenesis | DVL1, FZD7,
WNT11, WNT7B |
|
lnc-RAB3IL1-2:1 |
|
| Axon
guidance | NFAT5, SEMA7A,
UNC5B |
| Basal
cell carcinoma | DVL1,
FZD7 |
|
Extracellular matrix-receptor
interaction | HSPG2, ITGA3,
ITGA6 |
|
Aldosterone-regulated sodium
reabsorption | ATP1A1,
SGK1 |
| Folate
biosynthesis | ALPP,
ALPPL2 |
|
Glycerolipid metabolism | AGPAT2,
LIPG |
|
N-Glycan biosynthesis | MGAT3,
ST6GAL1 |
|
Regulation of actin
cytoskeleton | FGD3, ITGA3,
ITGA6, PFN1 |
|
Pathways in cancer | CXCL8, DVL1,
FZD7, ITGA3, ITGA6 |
|
Arrhythmogenic right
ventricular cardiomyopathy | ITGA3, ITGA6,
PKP2 |
Discussion
In the present study, the RNA sequencing data
between gastric cancer cells treated with celecoxib and those
treated with DMSO was used to explore the mechanism of celecoxib
treatment in gastric cancer cells. It has been previously
demonstrated that altered patterns of DNA methylation associated
with Helicobacter pylori infection of gastric epithelial
cells may contribute to the risk of gastric cancer (29). Following Helicobacter pylori
infection, the significant expression of CXCL5 and CXCL8 was
observed in primary human gastric epithelial cells (30). Verbeke et al (31) also reported that CXC chemokines may
contribute to the transition of chronic inflammation in esophageal
and gastric cancer. In addition, CXC chemokines (CXCL1, CXCL2,
CXCL3, CXCL5, CXCL6, CXCL7 and CXCL8) could promote the migration
and proliferation of endothelial cells by interacting with CXCR2
(32). Furthermore, the
overexpression of CXCL1 and CXCR2 may be involved in the tumor
invasion in gastric cancer (33).
The study by Park et al (34)
demonstrated that the overexpression of CXCL5 may contribute to the
pathogenesis of gastric cancer.
The results of the present study revealed that some
DEGs (CXCL1 and CXCL8) were enriched in the epithelial cell
signaling pathway in Helicobacter pylori infection whereas
other DEGs (CXCL1, CXCL3, CXCL5 and CXCL8) were enriched in both
the chemokine signaling and cytokine-cytokine receptor interaction
pathways, which were consistent with the previous reports. Based on
these results, CXCL1, CXCL3, CXCL5 and CXCL8 were suggested to
contribute to the development of gastric cancer through multiple
pathways.
ITGA3 is known to be involved in the development of
gastric cancer (35). The
MPS-1/ITGB4 signaling axis mediates cell migration and
invasiveness, which may be used as targets during the therapy of
gastric cancer (36). Song et
al (35) revealed that the
polymorphisms of microRNA-binding sites in the 3′UTR region of the
integrin genes (ITGA3, ITGA6, ITGB3, ITGB4 and ITGB5) were
associated with the susceptibility of gastric cancer. Pathway
enrichment analysis revealed that integrin genes (ITGA3, ITGA6,
ITGB4, ITGB5, ITGB6 and ITGB8) in module 1 were enriched in the
integrin-mediated signaling pathway. Altogether, we could speculate
that these integrin genes may participate in the celecoxib
treatment of gastric cancer via the integrin-mediated signaling
pathway.
Co-expression analysis revealed that the DEGs
co-expressed with lnc-SCD-1:13, lnc-LRR1-1:2, lnc-PTMS-1:3,
lnc-S100P-3:1, lnc-AP000974.1-1:1 or lnc-RAB3IL1-2:1 were enriched
in a number of pathways, including ECM-receptor interaction, Wnt
signaling and Hedgehog signaling pathways. A number of studies
reported that lncRNAs are important in the pathogenesis of gastric
cancer (37–39). Chang et al (40) revealed that the genes in the
ECM-receptor interaction pathway were involved in the metastasis
and aggression of gastric cancer. In addition, Tang et al
(41) demonstrated that miR-200b and
miR-22 could synergistically inhibit the growth of gastric cancer
through the Wnt-1 signaling pathway. Furthermore, Yan et al
(42) reported that the activated
Hedgehog signaling pathway was involved in the progression of
gastric cancer. These results implied that lnc-SCD-1:13,
lnc-LRR1-1:2, lnc-PTMS-1:3, lnc-S100P-3:1, lnc-AP000974.1-1:1 and
lnc-RAB3IL1-2:1 may be important in the celecoxib treatment of
gastric cancer via different pathways. However, the correlation
between COX-2 and DEGs or DE-lncRNAs remains unclear, and needs to
be confirmed by further experiments.
In conclusion, a total of 490 DEGs and 37 DE-lncRNAs
were identified in the celecoxib group. Several DEGs (including
CXCL1, CXCL3, CXCL5, CXCL8 and integrin genes) and DE-lncRNAs
(including lnc-SCD-1:13, lnc-LRR1-1:2, lnc-PTMS-1:3, lnc-S100P-3:1,
lnc-AP000974.1-1:1 and lnc-RAB3IL1-2:1) may affect celecoxib
treatment of gastric cancer through different pathways. However,
these results were obtained by bioinformatics analysis and require
further validation.
Glossary
Abbreviations
Abbreviations:
|
lncRNAs
|
long non-coding RNAs
|
|
DEGs
|
differentially expressed genes
|
|
PPI
|
protein-protein interaction
|
|
ncRNAs
|
non-coding RNAs
|
|
miRNAs
|
microRNAs
|
|
DMSO
|
dimethylsulfoxide
|
|
QC
|
quality control
|
|
NGS
|
next generation sequencing
|
|
GO
|
gene ontology
|
|
BP
|
biological process
|
|
CC
|
cellular component
|
|
MF
|
molecular function
|
|
mPTP
|
mitochondrial permeability transition
pore
|
References
|
1
|
Siegel R, Naishadham D and Jemal A: Cancer
statistics, 2013. CA Cancer J Clin. 63:11–30. 2013. View Article : Google Scholar : PubMed/NCBI
|
|
2
|
Akagi H, Higuchi H, Sumimoto H, Igarashi
T, Kabashima A, Mizuguchi H, Izumiya M, Sakai G, Adachi M,
Funakoshi S, et al: Suppression of myeloid cell leukemia-1 (Mcl-1)
enhances chemotherapy-associated apoptosis in gastric cancer cells.
Gastric Cancer. 16:100–110. 2013. View Article : Google Scholar : PubMed/NCBI
|
|
3
|
Hippo Y, Taniguchi H, Tsutsumi S, Machida
N, Chong JM, Fukayama M, Kodama T and Aburatani H: Global gene
expression analysis of gastric cancer by oligonucleotide
microarrays. Cancer Res. 62:233–240. 2002.PubMed/NCBI
|
|
4
|
Lee CH, Bang SH, Lee SK, Song KY and Lee
IC: Gene expression profiling reveals sequential changes in gastric
tubular adenoma and carcinoma in situ. World J Gastroenterol.
11:1937–1945. 2005. View Article : Google Scholar : PubMed/NCBI
|
|
5
|
Chia NY, Deng N, Das K, Huang D, Hu L, Zhu
Y, Lim KH, Lee MH, Wu J, Sam XX, et al: Regulatory crosstalk
between lineage-survival oncogenes KLF5, GATA4 and GATA6
cooperatively promotes gastric cancer development. Gut. 64:707–719.
2015. View Article : Google Scholar : PubMed/NCBI
|
|
6
|
Wadhwa R, Song S, Lee JS, Yao Y, Wei Q and
Ajani JA: Gastric cancer-molecular and clinical dimensions. Nat Rev
Clin Oncol. 10:643–655. 2013. View Article : Google Scholar : PubMed/NCBI
|
|
7
|
Wapinski O and Chang HY: Long noncoding
RNAs and human disease. Trends Cell Biol. 21:354–361. 2011.
View Article : Google Scholar : PubMed/NCBI
|
|
8
|
Du Z, Fei T, Verhaak RG, Su Z, Zhang Y,
Brown M, Chen Y and Liu XS: Integrative genomic analyses reveal
clinically relevant long noncoding RNAs in human cancer. Nat Struct
Mol Biol. 20:908–913. 2013. View Article : Google Scholar : PubMed/NCBI
|
|
9
|
Passon DM, Lee M, Rackham O, Stanley WA,
Sadowska A, Filipovska A, Fox AH and Bond CS: Structure of the
heterodimer of human NONO and paraspeckle protein component 1 and
analysis of its role in subnuclear body formation. Proc Natl Acad
Sci USA. 109:4846–4850. 2012. View Article : Google Scholar : PubMed/NCBI
|
|
10
|
Song H, Sun W, Ye G, Ding X, Liu Z, Zhang
S, Xia T, Xiao B, Xi Y and Guo J: Long non-coding RNA expression
profile in human gastric cancer and its clinical significances. J
Transl Med. 11:2252013. View Article : Google Scholar : PubMed/NCBI
|
|
11
|
Hu Y, Wang J, Qian J, Kong X, Tang J, Wang
Y, Chen H, Hong J, Zou W, Chen Y, et al: Long noncoding RNA GAPLINC
regulates CD44-dependent cell invasiveness and associates with poor
prognosis of gastric cancer. Cancer Res. 74:6890–6902. 2014.
View Article : Google Scholar : PubMed/NCBI
|
|
12
|
Liu M, Li CM, Chen ZF, Ji R, Guo QH, Li Q,
Zhang HL and Zhou YN: Celecoxib regulates apoptosis and autophagy
via the PI3K/Akt signaling pathway in SGC-7901 gastric cancer
cells. Int J Mol Med. 33:1451–1458. 2014.PubMed/NCBI
|
|
13
|
Lan C, Yang L, Fan L, Zhang Y, Wang J, Guo
GJ, Wan S, Yang S, Wang R and Fang D: Celecoxib inhibits
helicobacter pylori-induced invasion of gastric cancer cells
through an adenine nucleotide translocator-dependent mechanism.
Anticancer Agents Med Chem. 13:1267–1272. 2013. View Article : Google Scholar : PubMed/NCBI
|
|
14
|
Yeh TS, Wu CW, Hsu KW, Liao WJ, Yang MC,
Li AF, Wang AM, Kuo ML and Chi CW: The activated Notch1 signal
pathway is associated with gastric cancer progression through
cyclooxygenase-2. Cancer Res. 69:5039–5048. 2009. View Article : Google Scholar : PubMed/NCBI
|
|
15
|
Hu PJ, Yu J, Zeng ZR, Leung WK, Lin HL,
Tang BD, Bai AH and Sung JJ: Chemoprevention of gastric cancer by
celecoxib in rats. Gut. 53:195–200. 2004. View Article : Google Scholar : PubMed/NCBI
|
|
16
|
Thiel A, Mrena J and Ristimäki A:
Cyclooxygenase-2 and gastric cancer. Cancer Metastasis Rev.
30:387–395. 2011. View Article : Google Scholar : PubMed/NCBI
|
|
17
|
Pang RP, Zhou JG, Zeng ZR, Li XY, Chen W,
Chen MH and Hu PJ: Celecoxib induces apoptosis in COX-2 deficient
human gastric cancer cells through Akt/GSK3β/NAG-1 pathway. Cancer
Lett. 251:268–277. 2007. View Article : Google Scholar : PubMed/NCBI
|
|
18
|
Chen Z, Liu M, Liu X, Huang S, Li L, Song
B, Li H, Ren Q, Hu Z, Zhou Y and Qiao L: COX-2 regulates E-cadherin
expression through the NF-κB/Snail signaling pathway in gastric
cancer. Int J Mol Med. 32:93–100. 2013.PubMed/NCBI
|
|
19
|
Saito Y, Suzuki H, Imaeda H, Matsuzaki J,
Hirata K, Tsugawa H, Hibino S, Kanai Y, Saito H and Hibi T: The
tumor suppressor microRNA-29c is downregulated and restored by
celecoxib in human gastric cancer cells. Int J Cancer.
132:1751–1760. 2013. View Article : Google Scholar : PubMed/NCBI
|
|
20
|
Patel RK and Jain M: NGS QC toolkit: A
platform for quality control of next-generation sequencing data.
Enc Metagenomics. 1–5. 2013. View Article : Google Scholar
|
|
21
|
Kim D, Pertea G, Trapnell C, Pimentel H,
Kelley R and Salzberg SL: TopHat2: Accurate alignment of
transcriptomes in the presence of insertions, deletions and gene
fusions. Genome Biol. 14:R362013. View Article : Google Scholar : PubMed/NCBI
|
|
22
|
Rosenbloom KR, Armstrong J, Barber GP,
Casper J, Clawson H, Diekhans M, Dreszer TR, Fujita PA, Guruvadoo
L, Haeussler M, et al: The UCSC genome browser database: 2015
update. Nucleic Acids Res. 43:D670–D681. 2015. View Article : Google Scholar : PubMed/NCBI
|
|
23
|
Trapnell C, Roberts A, Goff L, Pertea G,
Kim D, Kelley DR, Pimentel H, Salzberg SL, Rinn JL and Pachter L:
Differential gene and transcript expression analysis of RNA-seq
experiments with tophat and cufflinks. Nat Protoc. 7:562–578. 2012.
View Article : Google Scholar : PubMed/NCBI
|
|
24
|
Volders PJ, Helsens K, Wang X, Menten B,
Martens L, Gevaert K, Vandesompele J and Mestdagh P: LNCipedia: A
database for annotated human lncRNA transcript sequences and
structures. Nucleic Acids Res. 41:(Database Issue). D246–D251.
2013. View Article : Google Scholar : PubMed/NCBI
|
|
25
|
Gentleman RC, Carey VJ, Bates DM, Bolstad
B, Dettling M, Dudoit S, Ellis B, Gautier L, Ge Y, Gentry J, et al:
Bioconductor: Open software development for computational biology
and bioinformatics. Genome Biol. 5:R802004. View Article : Google Scholar : PubMed/NCBI
|
|
26
|
Franceschini A, Szklarczyk D, Frankild S,
Kuhn M, Simonovic M, Roth A, Lin J, Minguez P, Bork P, von Mering C
and Jensen LJ: STRING v9.1: Protein-protein interaction networks,
with increased coverage and integration. Nucleic Acids Res.
41:D808–D815. 2013. View Article : Google Scholar : PubMed/NCBI
|
|
27
|
Kohl M, Wiese S and Warscheid B:
Cytoscape: Software for visualization and analysis of biological
networks. Methods Mol Biol. 696:291–303. 2011. View Article : Google Scholar : PubMed/NCBI
|
|
28
|
Nepusz T, Yu H and Paccanaro A: Detecting
overlapping protein complexes in protein-protein interaction
networks. Nat Methods. 9:471–472. 2012. View Article : Google Scholar : PubMed/NCBI
|
|
29
|
Niwa T, Tsukamoto T, Toyoda T, Mori A,
Tanaka H, Maekita T, Ichinose M, Tatematsu M and Ushijima T:
Inflammatory processes triggered by Helicobacter pylori infection
cause aberrant DNA methylation in gastric epithelial cells. Cancer
Res. 70:1430–1440. 2010. View Article : Google Scholar : PubMed/NCBI
|
|
30
|
Mustapha P, Paris I, Garcia M, Tran CT,
Cremniter J, Garnier M, Faure JP, Barthes T, Boneca IG, Morel F, et
al: Chemokines and antimicrobial peptides cag-dependent early
response to helicobacter pylori infection in primary human gastric
epithelial cells. Infect Immun. 82:2881–2889. 2014. View Article : Google Scholar : PubMed/NCBI
|
|
31
|
Verbeke H, Geboes K, Van Damme J and
Struyf S: The role of CXC chemokines in the transition of chronic
inflammation to esophageal and gastric cancer. Biochim Biophys
Acta. 1825:117–129. 2012.PubMed/NCBI
|
|
32
|
Mukaida N, Sasaki S and Baba T: Chemokines
in cancer development and progression and their potential as
targeting molecules for cancer treatment. Mediators Inflamm.
2014:1703812014. View Article : Google Scholar : PubMed/NCBI
|
|
33
|
Cheng WL, Wang CS, Huang YH, Tsai MM,
Liang Y and Lin KH: Overexpression of CXCL1 and its receptor CXCR2
promote tumor invasion in gastric cancer. Ann Oncol. 22:2267–2276.
2011. View Article : Google Scholar : PubMed/NCBI
|
|
34
|
Park JY, Park KH, Bang S, Kim MH, Lee JE,
Gang J, Koh SS and Song SY: CXCL5 overexpression is associated with
late stage gastric cancer. J Cancer Res Clin Oncol. 133:835–840.
2007. View Article : Google Scholar : PubMed/NCBI
|
|
35
|
Song X, Zhong H, Zhou J, Hu X, Zhou Y, Ye
Y, Lu X, Wang J, Ying B and Wang L: Association between
polymorphisms of microRNA-binding sites in integrin genes and
gastric cancer in Chinese han population. Tumor Biol. 36:2785–2792.
2015. View Article : Google Scholar
|
|
36
|
Yang ZY, Jiang H, Qu Y, Wei M, Yan M, Zhu
ZG, Liu BY, Chen GQ, Wu YL and Gu QL: Metallopanstimulin-1
regulates invasion and migration of gastric cancer cells partially
through integrin β4. Carcinogenesis. 34:2851–2860. 2013. View Article : Google Scholar : PubMed/NCBI
|
|
37
|
Lin XC, Zhu Y, Chen WB, Lin LW, Chen DH,
Huang JR, Pan K, Lin Y, Wu BT, Dai Y and Tu ZG: Integrated analysis
of long non-coding RNAs and mRNA expression profiles reveals the
potential role of lncRNAs in gastric cancer pathogenesis. Int J
Oncol. 45:619–628. 2014.PubMed/NCBI
|
|
38
|
Chen S, Li P, Xiao B and Guo J: Long
noncoding RNA HMlincRNA717 and AC130710 have been officially named
as gastric cancer associated transcript 2 (GACAT2) and GACAT3,
respectively. Tumor Biol. 35:8351–8352. 2014. View Article : Google Scholar
|
|
39
|
Okugawa Y, Toiyama Y, Hur K, Toden S,
Saigusa S, Tanaka K, Inoue Y, Mohri Y, Kusunoki M, Boland CR, et
al: Metastasis-associated long non-coding RNA drives cancer
development and promotes peritoneal metastasis. Carcinogenesis.
35:2731–2739. 2014. View Article : Google Scholar : PubMed/NCBI
|
|
40
|
Chang W, Ma L, Lin L, Gu L, Liu X, Cai H,
Yu Y, Tan X, Zhai Y, Xu X, et al: Identification of novel hub genes
associated with liver metastasis of gastric cancer. Int J Cancer.
125:2844–2853. 2009. View Article : Google Scholar : PubMed/NCBI
|
|
41
|
Tang H, Kong Y, Guo J, Tang Y and Xie X,
Yang L, Su Q and Xie X: Diallyl disulfide suppresses proliferation
and induces apoptosis in human gastric cancer through Wnt-1
signaling pathway by up-regulation of miR-200b and miR-22. Cancer
Lett. 340:72–81. 2013. View Article : Google Scholar : PubMed/NCBI
|
|
42
|
Yan R, Peng X, Yuan X, Huang D, Chen J, Lu
Q, Lv N and Luo S: Suppression of growth and migration by blocking
the hedgehog signaling pathway in gastric cancer cells. Cell Oncol
(Dordr). 36:421–435. 2013. View Article : Google Scholar : PubMed/NCBI
|