Introduction
Retrorsine treatment combined with partial
hepatecomy (PH) is a commonly used method to establish a model of
liver regeneration (1). A subgroup
of liver stem cells, termed small hepatocyte-like progenitor cells
(SHPCs), has been previously shown to initiate liver regeneration
in retrorsine-pretreated Fisher 344 rats that have undergone PH
(2–3). The morphological characteristics and
regeneration dynamics of SHPCs were found to be markedly different
from the normal hepatic oval cells (1–3);
however, the histological origin, cell biology characteristics and
mechanisms that regulate the proliferation of SHPCs remain
unclear.
In our previous study, it was demonstrated that the
Hedgehog signaling pathway (HH) was activated during various liver
injury processes, including liver regeneration (4). The HH regulates the development of the
embryonic digestive tract and its subsidiary organs, including the
liver and pancreas (5,6). The structures and functions of the
various components of the HH have been reported in the literature
(5,6). Briefly, the signaling molecules Indian
hedgehog (IHH) and sonic hedgehog (SHH) bind to the Patched (PTCH)
membrane receptor, relieving inhibition of the transmembrane
transduction protein Smoothened (SMO) (5,6). This
leads to the intracellular transduction of signals and eventual
activation of the glioma-associated oncogene (GLI) family of zinc
finger transcription factors, including GLI1, GLI2
and GLI3 (5,6). This in turn results in the expression
of GLI target genes, including PTCH, GLI and
cyclin D, ultimately leading to changes in the cell cycle and cell
proliferation and differentiation. At present, there is no
consensus regarding the role of the HH in the mature liver and
liver regeneration process (7–10).
Furthermore, to the best of our knowledge, there have been no
previous studies regarding the expression and significance of the
HH in the SHPC-mediated regeneration process in the liver.
Therefore, the present study aimed to investigate the expression
levels of various components of the HH, including IHH,
SHH, PTCH, SMO, GLI1, GLI2 and
GLI3, in primary SHPCs during liver regeneration, in order
to elucidate the role of the HH in SHPC proliferation.
Materials and methods
Animals and liver regeneration
model
A total of 140 male Fisher 344 rats (clean grade;
average weight, 80 g; age, 5 weeks) were provided by the Shanghai
Laboratory Animal Center of the Chinese Academy of Sciences
(Shanghai, China). After 1 week of adaptive feeding, the rats were
randomly divided into four groups, as follows (35 rats/group): i)
Normal control (N) group; ii) retrorsine-treated (R) group; iii) PH
group; and iv) R plus PH group (R/PH or SHPC group). Animals were
maintained in conditions described in a previous study (4). The present study was conducted in
accordance with recommendations in the Guide for the Care and Use
of Laboratory Animals of the National Institutes of Health
(Bethesda, MA, USA). The animal use protocol has been reviewed and
approved by the Institutional Animal Care and Use Committee of the
China Academy of Chinese Medical Sciences (Beijing, China). All
experimental procedures were approved by Animal Ethics Committee of
Beijing University of Chinese Medicine under the guidelines issued
by Regulations of Beijing Laboratory Animal Management (Beijing,
China).
In order to induce SHPC proliferation, the rats in
the R and R/PH groups were intraperitoneally injected with 30 mg/kg
retrorsine (Sigma-Aldrich, St. Louis, MO, USA) once in week 6 and
once in week 8, as previously described (1,2), The N
and PH groups were injected with an equal volume of saline at these
time points. At 5 weeks after the second dose (week 13), the PH and
R/PH groups underwent a two-thirds PH (11), whereas the N and R groups underwent
sham surgery to ensure that changes possibly caused by surgical
trauma and narcotic drugs were accounted for in all groups
(11). No mortalities caused by
retrorsine administration and surgery occurred during the
experiment. The rat-feeding and experiments were performed at the
specific-pathogen-free Animal Experiment Center of the Dongfang
Hospital (Beijing, China), and the surgical procedure was performed
in accordance with the Regulations of Laboratory Animal Management
(Beijing University of Chinese Medicine).
The rats from each group were sacrificed on days 2,
3, 4, 7, 14, 21 and 30 following PH, with 5 rats from each group
sacrificed at each time point, according to previous studies
(1,2). Following ligation and removal of the
caudate lobe, the liver was separated in situ for
preparation of primary SHPCs. The obtained caudate lobe was cut
into 3–5 sections with a size of 0.5×0.5×0.2 cm, fixed in 10%
paraformaldehyde and embedded in paraffin 24 h later. Sections were
then stained with hematoxylin and eosin and the proliferation of
SHPCs were identified by three pathologists.
Separation and preparation of primary
hepatocytes
The separation of hepatic tissues and the
preparation of primary hepatocytes were performed according to
previous reports (12,13). Briefly, following ligation and
resection of the caudate lobe, the in situ-isolated liver
was perfused with 350 ml EDTA solution at 37°C in Hanks' balanced
salt solution (HBSS; Biyuntian Biological Technology Co., Ltd.,
Shanghai, China) via the abdominal aorta, at a flow rate of 35
ml/min; the lavage solution was naturally discharged via the
resected vena cava. Subsequently, Ca2+-enriched
HBSS-dissolved 0.05% collagenase IV (<38°C; Sigma-Aldrich), was
perfused at the same rate for 10 min. Upon separation of the liver
capsule from the liver parenchyma, 150 ml William's E medium (4°C;
Thermo Fisher Scientific, Inc., Waltham, MA, USA) was perfused at a
flow rate of 150 ml/min for 1 min. Next, the liver tissues were
placed into a sterile mortar, chopped and homogenized, and then
filtered using a stainless steel mesh (thickness, 150 µm; pore
size, 80 µm) to eliminate the components of the liver parenchyma.
The obtained filtrate was washed with 4°C William's E medium and
centrifuged through a speed gradient to obtain the enriched primary
hepatocytes or SHPCs. The centrifugation conditions were as
follows, according to a previous study (13): Three times centrifugation (4°C) at 50
× g for 1 min to obtain the enriched primary hepatocytes (as the
control); subsequently, the lamellar sediment was discarded and the
supernatant was centrifuged three times at 150 × g for 5 min to
obtain the enriched primary SHPCs. The obtained primary SHPCs were
placed into cell preservation solution (ABY; Aohua Medical
Technology Co., Ltd., Xiaogan, China)for polymerase chain reaction
(PCR) and western blotting, or placed into a low temperature
refrigerator at −80°C for future use.
Reverse transcription (RT)-PCR
RT-PCR was performed to detect the expression of
molecular markers, including oval cell marker 6, cytokeratin 19
(CK19, hepatic duct system marker), CK18 (hepatocyte marker) and
α-smooth muscle actin (hepatic stellate cell marker), within the
primary SHPCs at various time points following PH. The primer
sequences are shown in Tables I and
II. PCR was performed using the
CFX96 Touch real-time PCR system (Bio-Rad Laboratories, Inc.,
Hercules, CA, USA), according to the manufacturer's protocol.
Briefly, total RNA was extracted from the primary SHPCs using
TRIzol reagent (Invitrogen; Thermo Fisher Scientific, Inc.),
followed by purification using DNase (Invitrogen; Thermo Fisher
Scientific, Inc.). The purity was assessed by spectrophotometry.
Total RNA (3 µg) was added into 20 µl PrimeScript RT kit (Takara
Biotechnology Co., Ltd., Dalian, China) for reverse transcription
into cDNA. cDNA (5 µl) was then added into a 20 µl PCR reaction
mixture, containing 4 µl PrimeScript Buffer (5X), 1 µl PrimeScript
RT Enzyme Mix I, 1 µl Oligo Dt Primer (50 µmol/l), 1 µl Random 6
mers (100 µmol/l) and 13 µl total RNA. The PCR system (15 µl for
each sample) was as follows: 7.5 µl Premix Ex Taq (2X), 0.25
µl forward primer (10 µmol/l), 0.25 µl reverse primer (10 µmol/l)
and 4 µl dH2O. The cycling conditions were as follows:
93°C for 5 min, followed by 35 cycles of 94°C for 30 sec, 54°C for
45 sec and 72°C for 1 min, and a final extension step at 72°C for
10 min. The reaction products were subjected to 2% agarose gel
electrophoresis. Ethidium bromide was used to visualize the DNA
ladder. The remaining cDNA was stored at −20°C until further
use.
 | Table I.Primer sequences for reverse
transcription-polymerase chain reaction. |
Table I.
Primer sequences for reverse
transcription-polymerase chain reaction.
| Gene | Primers | Product size
(bp) |
|---|
| CD45 | F:
5′-TGTCGTGACGATCAATGACCA-3′ | 306 |
|
| R:
5′-ACATCCACTTTGCCCTCTGCT-3′ |
|
| CD133 | F:
5′-ACCAGTTGCCTGACGGAAATC-3′ | 304 |
|
| R:
5′-GCGTACAAGACCCATTGCAGAT-3′ |
|
| CD117 | F:
5′-GGCATCACCATCAAAAACGTG-3′ | 317 |
|
| R:
5′-TGGCGTTCGTAATTGAAGTCG-3′ |
|
| CD326 | F:
5′-GATGAAGGCGGAGATGACTCAC-3′ | 315 |
|
| R:
5′-CGAGATGCAAATGTGTCCTGAA-3′ |
|
| CK18 | F:
5′-GGATGCTCCCAAATCTCAGGA-3′ | 331 |
|
| R:
5′-TGATTCCAGATGCAGAAGGACC-3′ |
|
| CK19 | F:
5′-TCCACACCAGGCATTGACCTA-3′ | 403 |
|
| R:
5′-GCCTCGACTTGATGTCCATGA-3′ |
|
| CLDN3 | F:
5′-CGAGCTCTCATCGTGGTGTCTA-3′ | 256 |
|
| R:
5′-CGTACAACCCAGTTCCCATCTC-3′ |
|
| c-Met | F:
5′-TCAACAGCGGCAATTCTAGACA-3′ | 364 |
|
| R:
5′-GTGGTGCAGCAGATGATCTCTG-3′ |
|
| Cx43 | F:
5′-TTCATGCTGGTGGTGTCCTTG-3′ | 323 |
|
| R:
5′-CGATTTTGCTCTGCGCTGTAGT-3′ |
|
| HNF3β | F:
5′-CCAACAAGATGCTGACGCTGA-3′ | 331 |
|
| R:
5′-TGAACCTGAGAAGCCTGTGTCC-3′ |
|
| HNF4α | F:
5′-AGGCAGTGCGTGGTAGACAAA-3′ | 421 |
|
| R:
5′-TGAACACCATGGACCTCTTGG-3′ |
|
| OV-6 | F:
5′-ATGACATGAAGGTTGTCCTCGG-3′ | 263 |
|
| R:
5′-CCCCTTGGTCTTAACATGCTGA-3′ |
|
| Sca-1 | F:
5′-GCACGATGATCCCATTTGGT-3′ | 230 |
|
| R:
5′-TGCTGCGTTGCAAAGATCTG-3′ |
|
| Thy1 | F:
5′-TGCCGTCATGAGAATAACACCA-3′ | 201 |
|
| R:
5′-ACACATGTAGTCGCCCTCATCC-3′ |
|
| SHH | F:
5′-AACTCACCCCCAATTACAACCC-3′ | 321 |
|
| R:
5′-GGATGCGAGCTTTGGATTCA-3′ |
|
| IHH | F:
5′-ACCGCGACCGAAATAAGTACG-3′ | 301 |
|
| R:
5′-AAAGCTCTCAGCCTGTTTGGC-3′ |
|
| PTCH | F:
5′-TGTTGGTGTGGACGACGTCTT-3′ | 354 |
|
| R:
5′-GGTTCAACTTGAATCACCCGG-3′ |
|
| VIM | F:
5′-TACATCGACAAGGTGCGCTTC-3′ | 422 |
|
| R:
5′-TCGATCTGGACATGCTGTTCC-3′ |
|
| α-SMA | F:
5′-TGGAGAAGAGCTACGAACTGCC-3′ | 342 |
|
| R:
5′-ATAGAGAAGCCAGGATGGAGCC-3′ |
|
| Table II.Reverse transcription-polymerase
chain reaction primer sequences for components of the Hedgehog
signaling pathway. |
Table II.
Reverse transcription-polymerase
chain reaction primer sequences for components of the Hedgehog
signaling pathway.
| Gene | Primers | Product size
(bp) |
|---|
| SHH | F:
5′-AACTCACCCCCAATTACAACCC-3′ | 321 |
|
| R:
5′-GGATGCGAGCTTTGGATTCA-3′ |
|
| IHH | F:
5′-ACCGCGACCGAAATAAGTACG-3′ | 301 |
|
| R:
5′-AAAGCTCTCAGCCTGTTTGGC-3′ |
|
| PTCH | F:
5′-TGTTGGTGTGGACGACGTCTT-3′ | 354 |
|
| R:
5′-GGTTCAACTTGAATCACCCGG-3′ |
|
| SMO | F:
5′-CAATGTGAAGCACCCTTGGTG-3′ | 323 |
|
| R:
5′-CCATCTGCTCGGCAAACAAT-3′ |
|
| GLI1 | F:
5′-CCAGTGTCCTCGACTTGAGCAT-3′ | 323 |
|
| R:
5′-ACAATTCCTGCTGCGACTGAAC-3′ |
|
| GLI2 | F:
5′-TGGATCTCTGAACCAGTTTGCC-3′ | 325 |
|
| R:
5′-TCGGTGACGACTAGCTGTGTTG-3′ |
|
| GLI3 | F:
5′-ATCAAAATGGAGGCACACGG-3′ | 303 |
|
| R:
5′-CCCTGACATTAGGCTGGTATGG-3′ |
|
Quantitative PCR (qPCR)
A semi-quantitative fluorescence probe method was
used to analyze the expression levels of IHH, PTCH
and GLI1 within the primary cell extract of each group at
various time points. The primers and fluorescent probe sequences
are shown in Table III. PCR was
performed on the stored cDNA using the PE 7000 automated
fluorescence qPCR instrument (Perkin Elmer Corp., Waltham, MA,
USA), according to the manufacturer's protocol. Briefly, 5 ml cDNA,
primers and probes were added to the PCR reaction solution (7.5 µl
Premix Ex Taq (2X) and 4 µl dH2O) and the cycling
conditions were as follows: 40 Cycles of 93°C for 3 min, 93°C for
45 sec and 55°C for 1 min. Following the reaction, the computer
automatically analyzed the results. GAPDH was used as the internal
control. The relative mRNA expression levels were calculated using
the 2−∆∆Cq method (14).
Each reaction was repeated three times, and the final result for a
specific time point is presented as the mean of these three
measurements.
| Table III.Sequences of the primers and probes
used for quantitative polymerase chain reaction. |
Table III.
Sequences of the primers and probes
used for quantitative polymerase chain reaction.
| Gene | Primers and
probes | Product size
(bp) |
|---|
| IHH | F:
5′-CGGCCATCACTCAGAGGAAT-3′ | 104 |
|
| R:
5′-CTGCTAAGCGCGCCAGTAGT-3′ |
|
|
| P:
5′-FAM-TTTACACTATGAGGGCCGCGC-TAMRA-3′ |
|
| PTCH | F:
5′-GCCTTTCTGACAGCCATTGG-3′ | 103 |
|
| R:
5′-CACCCAGCAGAGTGGACACA-3′ |
|
|
| P:
5′-FAM-CAAGAACCACAGGGCTATGCTCGC-TAMRA-3′ |
|
| GLI1 | F:
5′-CCTGAAGTGGGCAGGTTAGG-3′ | 100 |
|
| R:
5′-GCTGAGTGTTGTCCAGGTCAAG-3′ |
|
|
| P:
5′-FAM-AGGGCAGGTGTGTAACCCTCTGG-TAMRA-3′ |
|
Immunohistochemical and western blot
analyses
Immunohistochemical and western blot analyses were
performed to detect the protein expression of IHH, PTCH and GLI1
within the liver tissue sections, according to previous studies
(4,8,9,15). The following antibodies were
purchased from Santa Cruz Biotechnology Inc. (Dallas, TX, USA) and
used in the present study: Goat anti-IHH (C-15;
immunohistochemistry) and anti-IHH (I-19; western blot) polyclonal
antibodies (cat. nos. sc-1196 and sc-1782, respectively; 1:50);
rabbit anti-PTCH polyclonal antibody (H-267; sc-9016; 1:50); goat
anti-GLI1 polyclonal antibody (N-16; sc-6153; 1:50); and
horseradish peroxidase-conjugated rabbit anti-goat (sc-2033;
1:1,000) and goat anti-rabbit (sc-2004; 1:1,000) polyclonal
secondary antibodies. A negative control consisted of 0.01 mol/l
phosphate-buffered saline instead of the primary antibody.
Statistical analysis
Data are presented as the mean ± standard deviation.
Repeated measures analysis of variance was used to compare the
expression levels of IHH, PTCH and GLI1 between the experimental
and control groups at various time points. Statistical analyses
were conducted with SPSS 13.0 software (SPSS, Inc., Chicago, IL,
USA). P<0.05 was considered to indicate a statistically
significant difference.
Results
Expression of HH components and other
molecular markers
RT-PCR demonstrated that IHH and PTCH
were continuously expressed in the early, middle and late stages of
SHPC proliferation (postoperative days 4, 14 and 30, respectively),
whereas SHH mRNA expression was negative. In addition, a
number of other molecular markers were expressed in the primary
SHPC extract, including oval cell marker 6, CK19, CK18 and α-smooth
muscle actin. These results suggested there were a variety of cell
components in the extract (Fig. 1),
in agreement with previous findings (16–20).
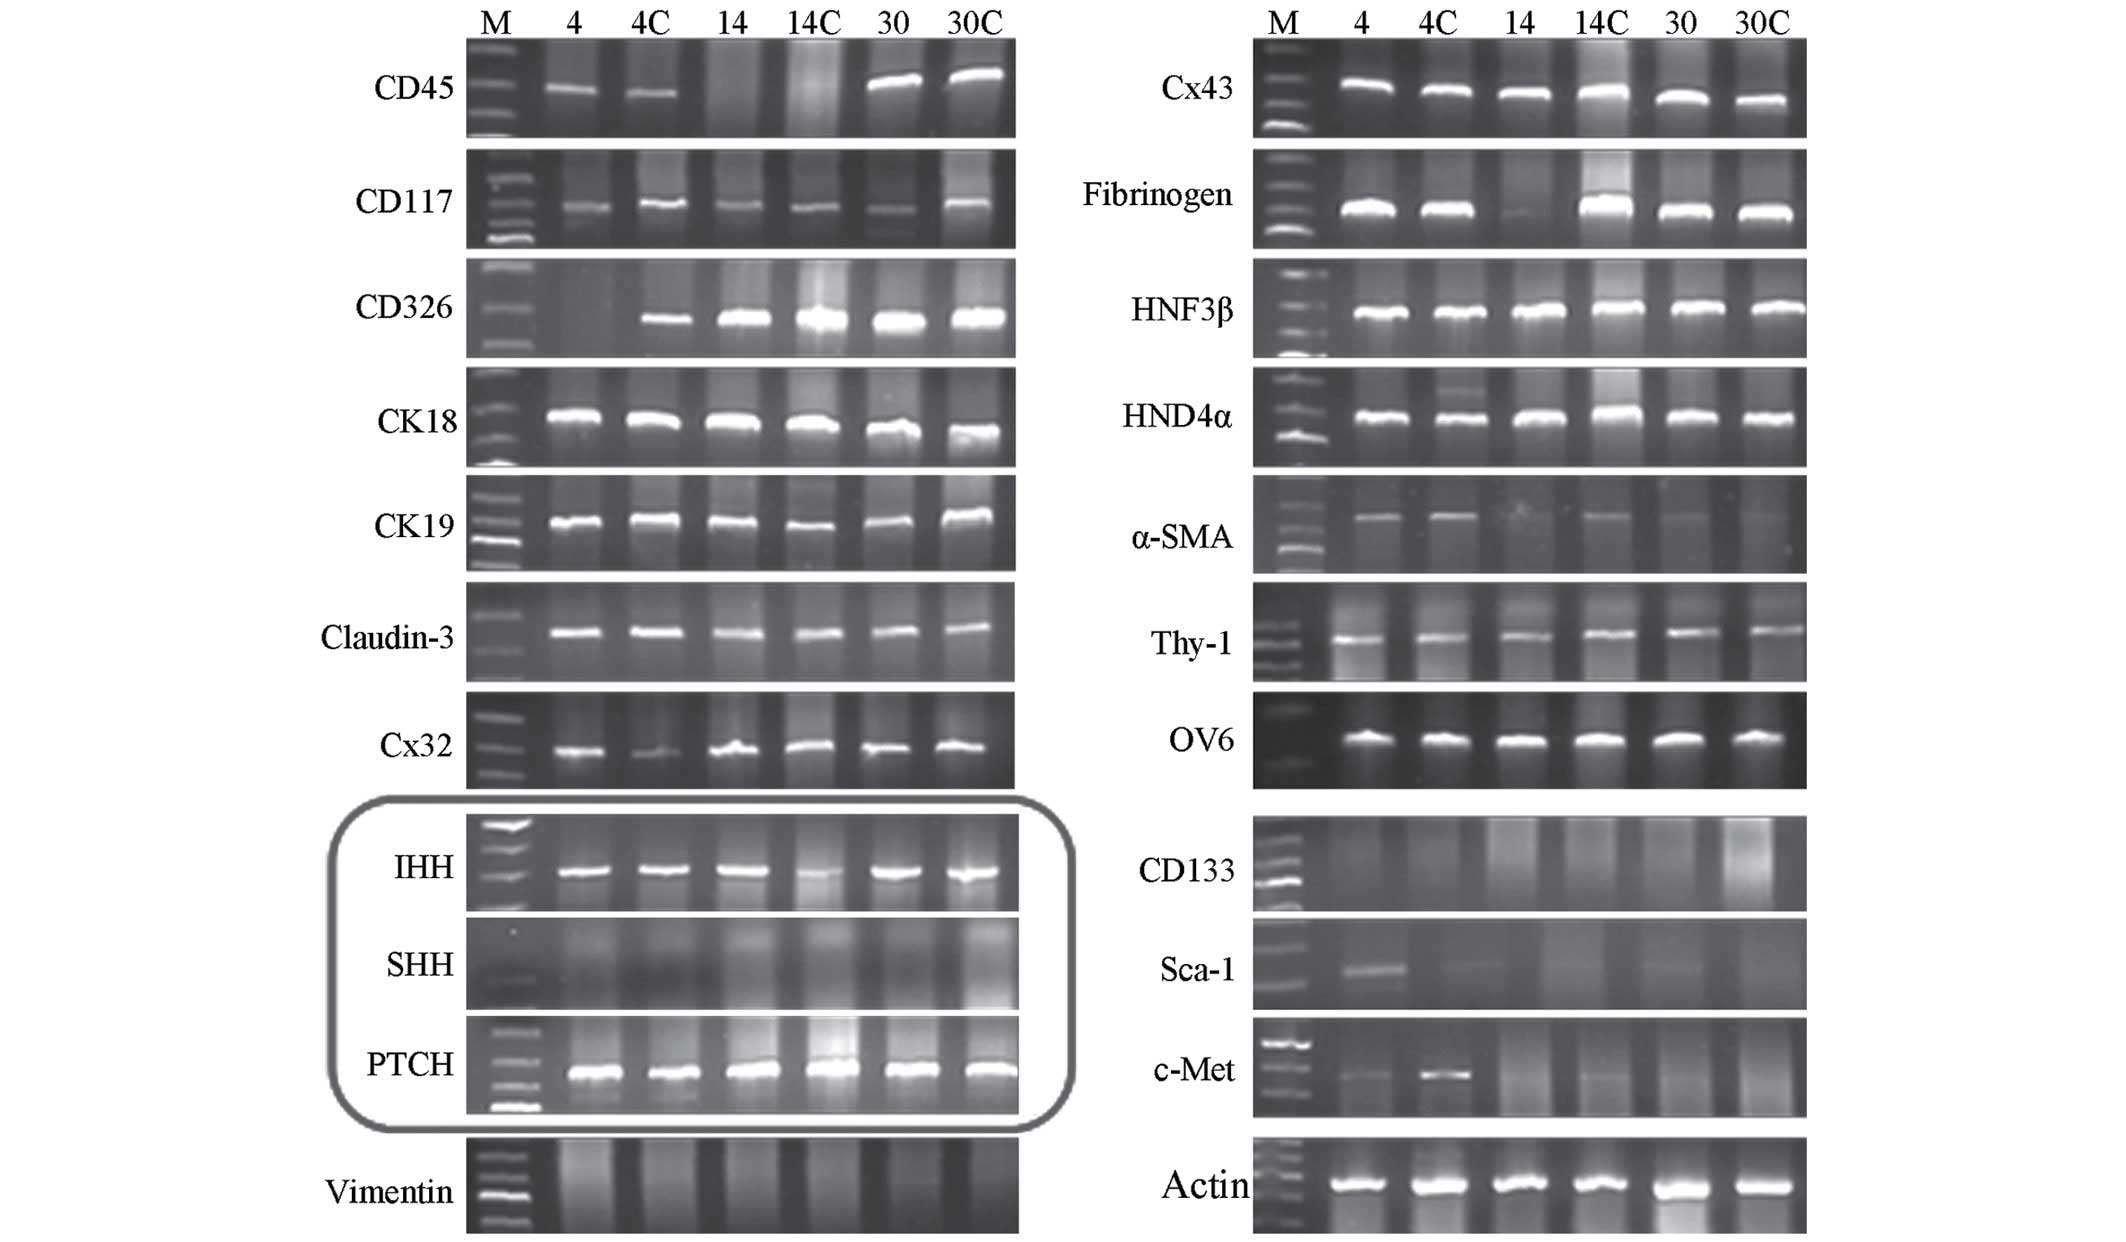 | Figure 1.Expression of various molecular
markers in the cell homogenate of primary SHPCs. Reverse
transcription-polymerase chain reaction demonstrated that numerous
molecular markers were expressed in primary SHPCs undergoing
proliferation in the early, middle and late stages of liver
regeneration (postoperative days 4, 14 and 30, respectively).
Primary SHPCs from the retrorsine-treated group within the same
period (postoperative days 4, 14 and 30) were set as the controls
(4C, 14C and 30C, respectively). The circled pane shows that
IHH and PTCH were continuously expressed, whereas
SHH was not. SHPCs, small hepatocyte-like progenitor cells;
IHH, Indian hedgehog; PTCH, patched; SHH,
sonic hedgehog. |
According to Gordon et al (1,2), SHPC
regeneration presented a diffused distribution and continued
proliferation. In the present study, RT-PCR detected the continuous
expression of HH-associated genes on postoperative days 2, 3, 4, 7,
14, 21 and 30. IHH, PTCH, GLI1, GLI2
and GLI3 mRNA expression was consistently observed in the
primary SHPCs, whereas SMO was expressed at a low level
(Fig. 2) and the expression of
SHH was negligible. These results confirm the continued
activation of HH in the process of proliferation of SHPCs.
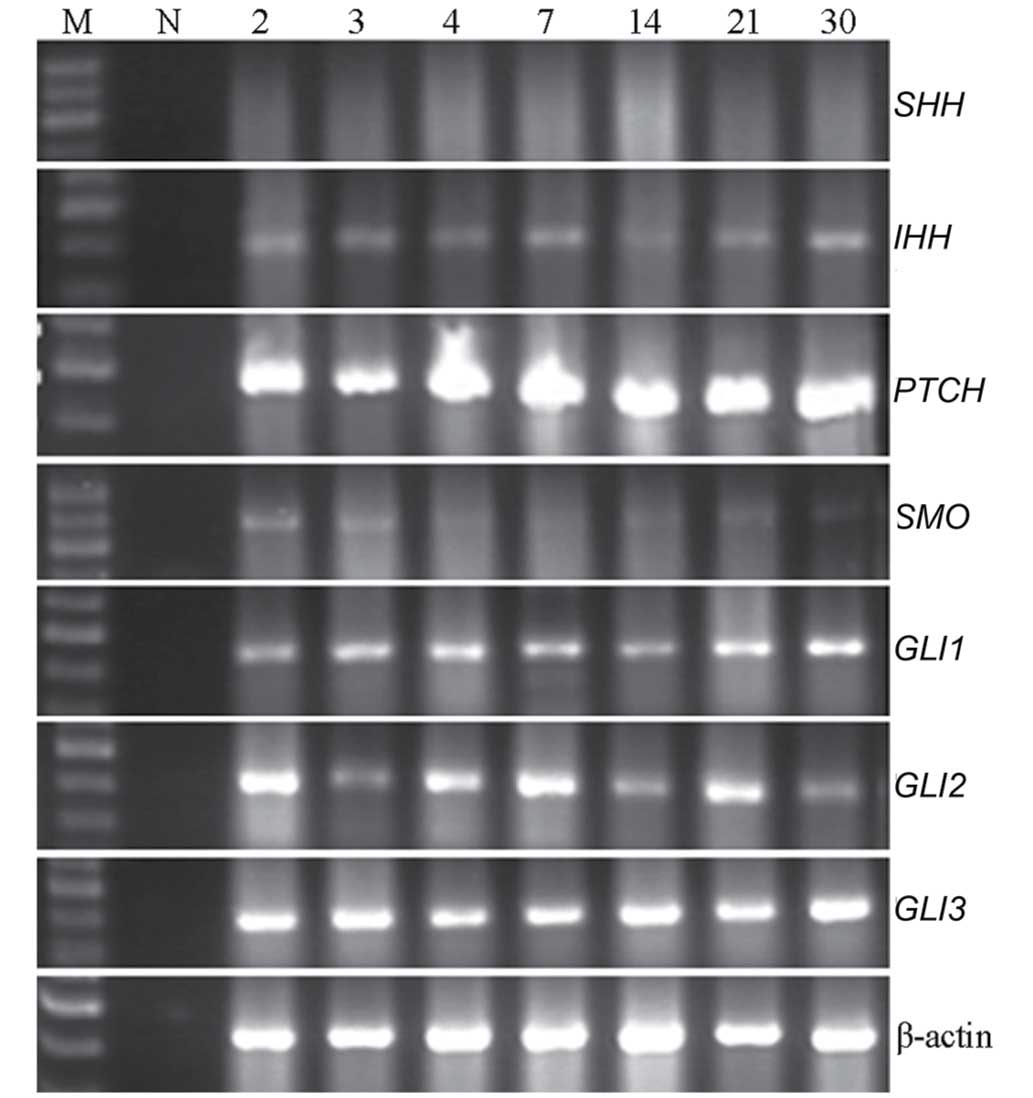 | Figure 2.Expression levels of various Hedgehog
signaling pathway components in proliferating SHPCs. On
postoperative days 2, 3, 4, 7, 14, 21 and 30, IHH,
PTCH, GLI1, GLI2 and GLI were
continuously expressed in the cell homogenate of primary SHPCs,
whereas SMO was only weakly expressed and SHH
expression was negligible. SHPCs, small hepatocyte-like progenitor
cells; M, DNA marker; N, negative control; SHH, sonic
hedgehog; PTCH, patched; IHH, Indian hedgehog;
SMO, smoothened; GLI, glioma-associated oncogene. |
Activation status of the HH during the
proliferation of SHPCs
In order to further clarify the role of HH
activation in the process of liver regeneration, qPCR was performed
to detect the expression levels of IHH, PTCH and
GLI1 in the SHPC extract at various time points. IHH is a
signaling molecule that is synthesized and released into the
microenvironment. The synthesis of GLI1 is entirely dependent on
the stimulation of the HH, such that GLI1 is considered a direct
marker of HH activation (8,21,22). In
addition, PTCH is not only a membrane receptor for the HH, but also
a target protein of HH activation, which may establish a negative
feedback mechanism that helps to avoid the abnormal or excessive
activation of HH (8,21). Therefore, upregulation of PTCH
expression has been regarded as a sign of the constitutive
activation of the HH (8,21).
In the present study, the expression levels of
IHH, PTCH and GLI1 were significantly
different in proliferating SHPCs, as compared with the control
group at the same time points, as well as among the different time
points within the R/PH group (P<0.01). Furthermore, there was an
association between the postoperative time point and the expression
levels of the HH components in the R/PH group. However, the same
association was not observed for the N and R groups (P>0.05;
Tables IV–VI). In contrast to the expression in the
N, R and PH groups, significantly higher expression levels of
IHH and GLI1 were observed during the early stage of
SHPC proliferation in the R/PH group (the earliest detection point
in this experiment was day 2 post-PH). Conversely, the expression
levels of IHH and GLI1 gradually decreased after
reaching a peak on day 3 post-PH. Subsequently, IHH and
GLI1 expression levels approached similar levels as in the
control group on days 4–7 post-PH, although the difference between
the control and R/PH groups remained significant (P<0.05), with
the exception of IHH expression on the days 4 and 21 post-PH
(Tables IV–VI). The expression of PTCH
exhibited the opposite pattern, since it was lower compared with
that in the N group at the early stages, but gradually increased
and reached a peak on day 14 post-PH. In addition, the expression
levels of PTCH remained elevated until day 30 post-PH.
| Table IV.Expression of Indian hedgehog during
the regeneration of small hepatocyte-like progenitor cells. |
Table IV.
Expression of Indian hedgehog during
the regeneration of small hepatocyte-like progenitor cells.
| Timea | n | N | R | PH | R/PH | P-value |
|---|
| 2 | 5 |
0.461±0.014 |
0.544±0.032 | 0.765±0.009 |
0.651±0.022 | 0.014 |
| 3 | 5 |
0.463±0.005 |
0.546±0.016 | 0.610±0.100 |
0.987±0.100 | <0.001 |
| 4 | 5 |
0.456±0.020 |
0.552±0.025 | 0.523±0.010 |
0.554±0.070 | 0.060 |
| 7 | 5 |
0.493±0.015 |
0.560±0.013 | 0.300±0.047 |
0.543±0.010 | 0.020 |
| 14 | 5 |
0.556±0.009 |
0.539±0.060 |
0.443±0.013 |
0.534±0.080 | 0.041 |
| 21 | 5 |
0.562±0.030 |
0.566±0.010 | 0.553±0.050 |
0.507±0.010 | 0.120 |
| 30 | 5 |
0.555±0.060 |
0.560±0.015 | 0.672±0.020 |
0.536±0.030 | 0.016 |
| P-value |
| 0.54 | 0.39 | 0.002 | <0.001 |
|
| Table VI.Expression of patched during the
regeneration of small hepatocyte-like progenitor cells. |
Table VI.
Expression of patched during the
regeneration of small hepatocyte-like progenitor cells.
| Timea | n | N | R | PH | R/PH | P-value |
|---|
| 2 | 5 |
0.161±0.014 |
0.185±0.060 |
0.166±0.080 |
0.150±0.022 | 0.032 |
| 3 | 5 |
0.164±0.004 |
0.178±0.090 |
0.219±0.040 |
0.186±0.110 | 0.019 |
| 4 | 5 |
0.155±0.090 |
0.193±0.040 |
0.323±0.010 |
0.254±0.040 | 0.006 |
| 7 | 5 |
0.182±0.012 |
0.189±0.030 |
0.290±0.037 |
0.343±0.010 | <0.001 |
| 14 | 5 |
0.156±0.010 |
0.168±0.015 |
0.241±0.020 |
0.534±0.050 | <0.001 |
| 21 | 5 |
0.161±0.030 |
0.175±0.011 |
0.154±0.045 |
0.507±0.010 | <0.001 |
| 30 | 5 |
0.155±0.060 |
0.180±0.020 |
0.152±0.020 |
0.536±0.028 | <0.001 |
| P-value |
| 0.48 | 0.52 | <0.001 | <0.001 |
|
Expression of HH components at the
protein level
The protein expression levels of IHH, PTCH and GLI1
were detected by immunohistochemical and western blot analyses. In
proliferating SHPCs, PTCH was constitutively expressed at a high
level and, in the post-PH day 30 liver tissue sections, a large
number of cells with brown membranes and a stained cytoplasm were
diffused within the liver parenchyma (Fig. 3). By contrast, the expression of IHH
was negative (Fig. 3) and GLI1
exhibited weak non-specific staining, and was thus difficult to
confirm its expression (data not shown). Western blot analysis was
unable to detect the expression of the three indicators.
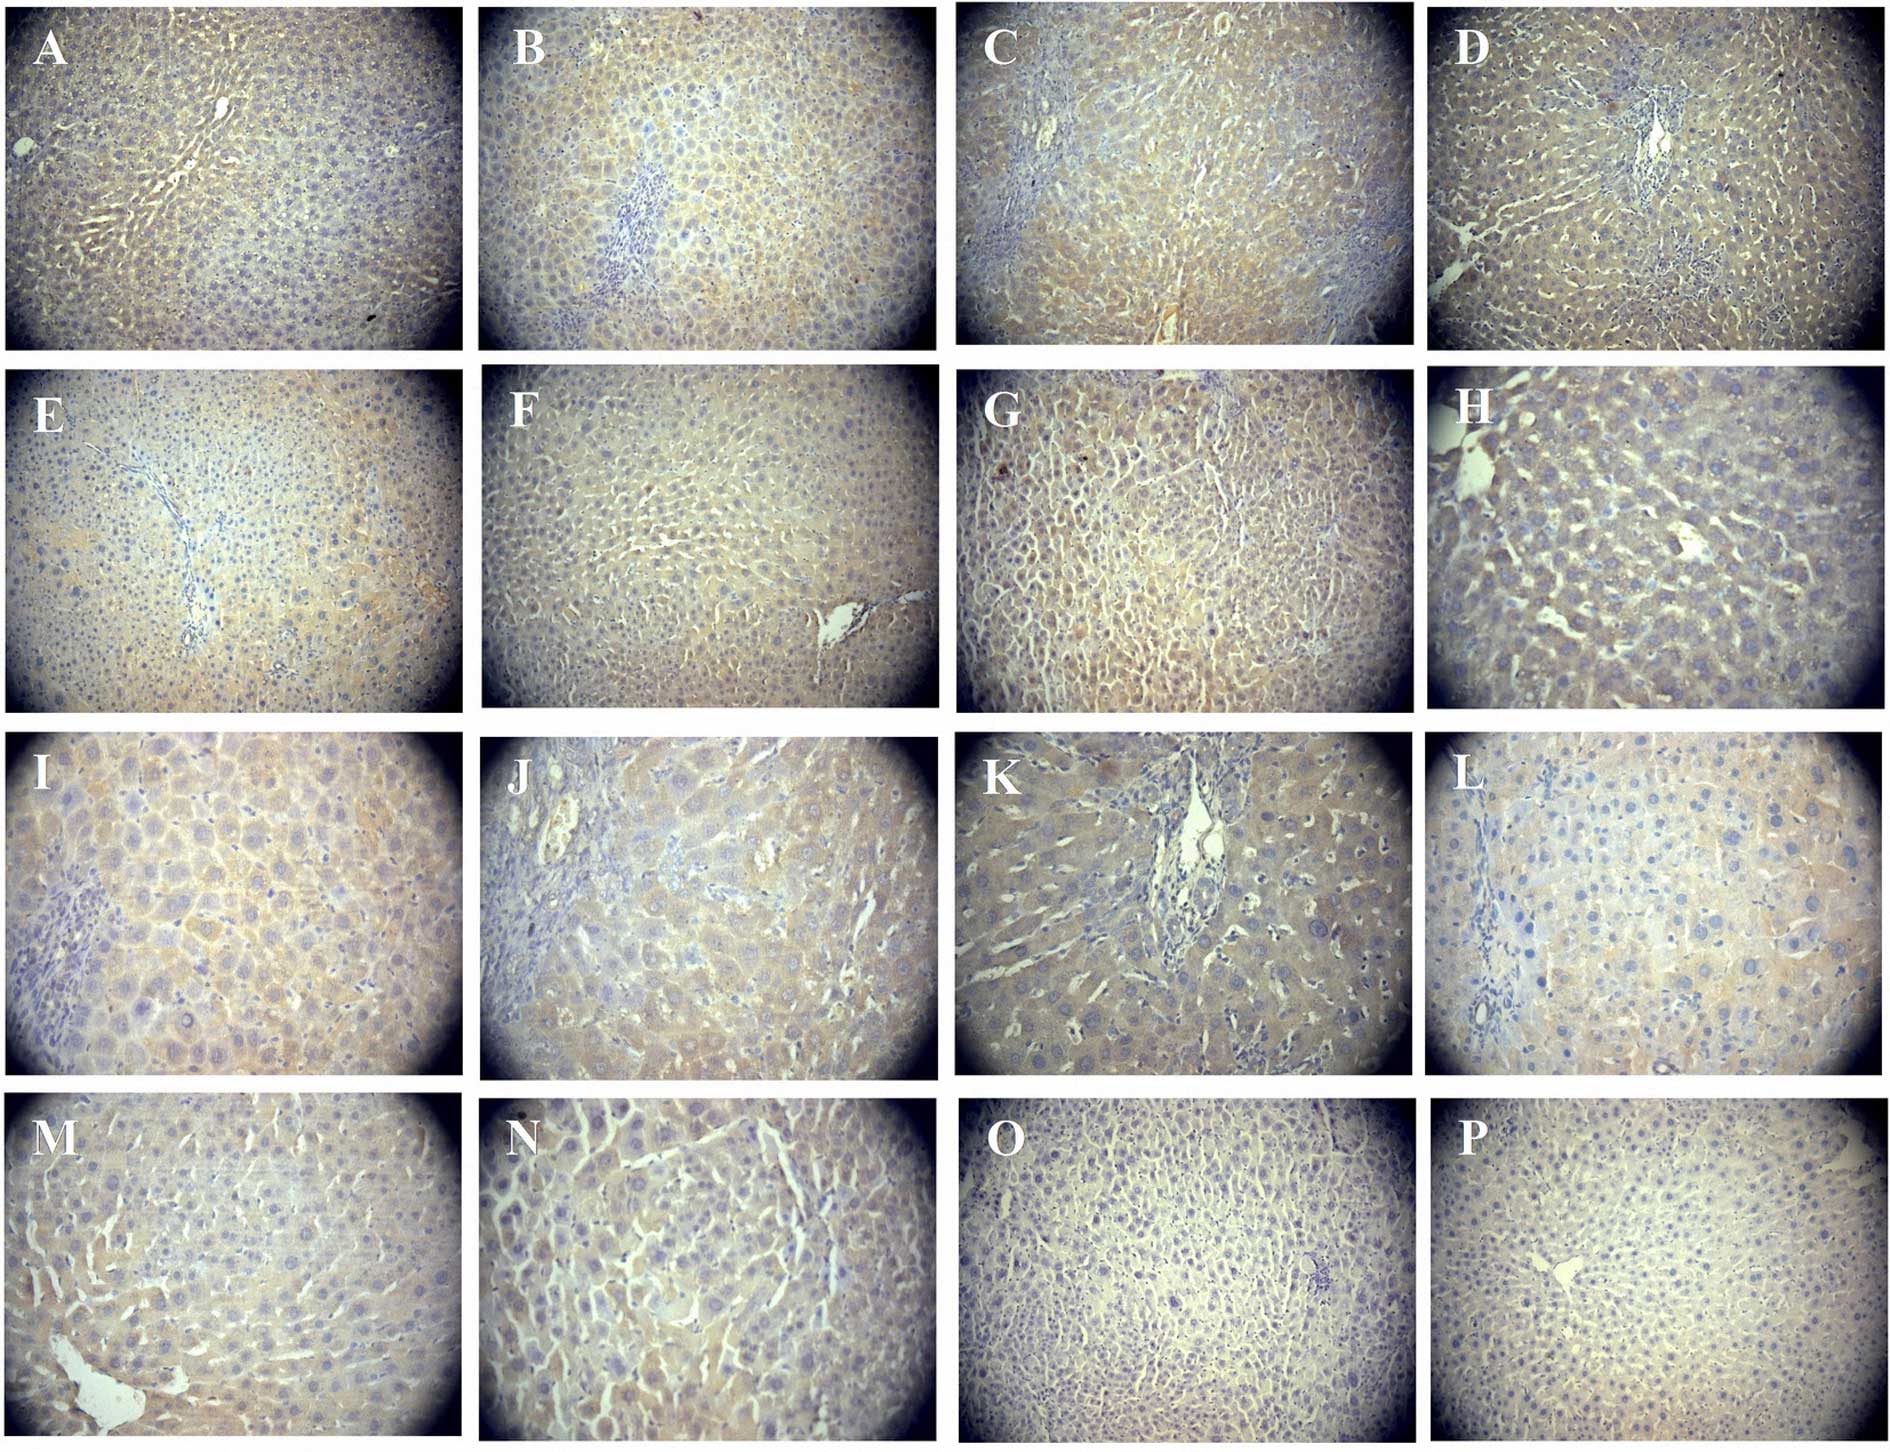 | Figure 3.Immunohistochemical detection of PTCH
and IHH in proliferating SHPCs. Immunohistochemistry detected the
expression levels of PTCH and IHH in regenerated liver tissues
during SHPC proliferation. (A)-(G), magnification ×200; (H)-(N),
magnification ×400; (O) and (P), magnification ×200. PTCH was
continuously strongly expressed on postoperative days (A and H) 2,
(B and I) 3, (C and J) 4, (D and K) 7, (E and L) 14, (F and M) 21
and (G and N) 30, as demonstrated by cells with large brown
membranes or cytoplasmic staining, diffused inside the liver
parenchyma. (O) Negative control without the anti-PTCH antibody.
(P) Regenerated liver tissue sections showed no IHH expression.
PTCH, patched; IHH, Indian hedgehog; SHPC, small hepatocyte-like
progenitor cells. |
Discussion
Retrorsine-treated Fisher 344 rats may be able to
complete the compensation of hepatic structural defects and
functional loss by SHPCs in one time- and space-specific way after
PH (1–3). Previous studies have demonstrated that
SHPCs are a group of non-oval, non-bile duct cells that may be a
stem cell subgroup derived from mature hepatocytes (23–25).
However, the following features of SHPCs have yet to be fully
elucidated: i) The histological origin and anatomical location of
SHPCs; ii) the characteristic cytobiological features of SHPCs, in
particular specific molecular markers and gene/protein expression
profiles; iii) the mechanisms and signaling pathways underlying the
regulation of SHPC proliferation; and iv) evidence that SHPCs exist
in other mammalian species.
In previous studies, SHPC regeneration presented a
diffused distribution and continued proliferation (1,2).
Therefore, the present study aimed to identify the signaling
pathways involved in SHPC proliferation. RT-PCR demonstrated that
numerous components of the HH were continuously expressed in
primary SHPCs undergoing proliferation, and a quantitative analysis
suggested that alterations in the expression levels of IHH,
PTCH and GLI1 were indicative of HH activation. These
results suggested that, during the process of SHPC proliferation,
IHH is secreted and binds to the membrane receptor PTCH in order to
reduce the expression of PTCH, and relieve the inhibition of the
HH, thus upregulating the expression of the GLI1 target
gene. However, following sustained activation of the pathway, the
expression of PTCH was increased and ultimately sustained at a high
level, thereby providing a negative feedback mechanism that
inhibited excessive activation of the HH. This was accompanied by a
gradual decrease in the expression levels of IHH and
GLI1, reflecting the continuous activation of HH and the
PTCH-mediated negative feedback mechanism (5,6).
Notably, the results of the present study were consistent with
those of Ochoa et al (10)
and Agarwal et al (26), who
also analyzed the expression of PTCH, SMO,
GLI1, GLI2 and GLI3 in liver tissues. However,
in contrast to these experiments, the present study was able to
detect the expression of IHH, but not SHH, in the
experimental and control groups. These results suggested that, in
proliferating SHPCs, the HH may exert its physiological role via
IHH rather than SHH, although these discrepancies may be associated
with differences in the modeling method or differences in the
genus/species used, and thus further verification is required.
The present study used immunohistochemistry to
analyze the expression of HH components at the protein level and
demonstrated that PTCH was continuously expressed in proliferating
SHPCs. By contrast, western blot analysis was unable to further
validate the results of the immunohistochemical analysis, which may
have been due to a lack of reliable antibodies for detection of the
mammalian liver HH molecules (4,9,10,15).
Another reason for the unsuccessful detection may have been that,
during the activation of the HH, the binding of the IHH signaling
molecule to the PTCH membrane receptor may have altered the
structure and location of the proteins, which in turn may have
affected their extraction, identification and reaction with the
antibodies (5,6,21).
In conclusion, to the best of our knowledge, the
present study is the first to report the constitutive activation of
a signaling pathway, in particular the HH, in proliferating SHPCs.
The results of the present study suggested that the HH may serve an
important role in the proliferation of SHPCs, and that SHPCs may be
an HH-regulated stem cell subgroup. Further studies are required to
validate these results, elucidate the histological position of
SHPCs within the liver and observe the impacts of pathway blockage
on SHPC proliferation, in order to delineate the regulatory
mechanisms underlying SHPC proliferation and identify the role of
the HH in liver regeneration.
References
|
1
|
Gordon GJ, Coleman WB, Hixson DC and
Grisham JW: Liver regeneration in rats with retrorsine-induced
hepatocellular injury proceeds through a novel cellular response.
Am J Pathol. 156:607–619. 2000. View Article : Google Scholar : PubMed/NCBI
|
|
2
|
Gordon GJ, Coleman WB and Grisham JW:
Temporal analysis of hepatocyte differentiation by small
hepatocyte-like progenitor cells during liver regeneration in
retrorsine-exposed rats. Am J Pathol. 157:771–786. 2000. View Article : Google Scholar : PubMed/NCBI
|
|
3
|
Best D Hunter and Coleman WB: Cells of
origin of small hepatocyte-like progenitor cells in the retrorsine
model of rat liver injury and regeneration. J Hepatol. 48:369–371.
2008. View Article : Google Scholar : PubMed/NCBI
|
|
4
|
Cai Y, Zheng H, Gong W, Che Y and Jiang B:
The role of hedgehog signaling pathway in liver regeneration.
Hepatogastroenterology. 58:2071–2076. 2011.PubMed/NCBI
|
|
5
|
Petrova R and Joyner AL: Roles for
Hedgehog signaling in adult organ homeostasis and repair.
Development. 141:3445–3457. 2014. View Article : Google Scholar : PubMed/NCBI
|
|
6
|
Merchant JL: Hedgehog signalling in gut
development, physiology and cancer. J Physiol. 590:421–432. 2012.
View Article : Google Scholar : PubMed/NCBI
|
|
7
|
McMillan R and Matsui W: Molecular
pathways: The hedgehog signaling pathway in cancer. Clin Cancer
Res. 18:4883–4888. 2012. View Article : Google Scholar : PubMed/NCBI
|
|
8
|
Büller NV, Rosekrans SL, Westerlund J and
van den Brink GR: Hedgehog signaling and maintenance of homeostasis
in the intestinal epithelium. Physiology (Bethesda). 27:148–155.
2012. View Article : Google Scholar : PubMed/NCBI
|
|
9
|
Tang L, Tan YX, Jiang BG, Pan YF, Li SX,
Yang GZ, Wang M, Wang Q, Zhang J, Zhou WP, et al: The prognostic
significance and therapeutic potential of hedgehog signaling in
intrahepatic cholangiocellular carcinoma. Clin Cancer Res.
19:2014–2024. 2013. View Article : Google Scholar : PubMed/NCBI
|
|
10
|
Ochoa B, Syn WK, Delgado I, Karaca GF,
Jung Y, Wang J, Zubiaga AM, Fresnedo O, Omenetti A, Zdanowicz M, et
al: Hedgehog signaling is critical for normal liver regeneration
after partial hepatectomy in mice. Hepatology. 51:1712–1723. 2010.
View Article : Google Scholar : PubMed/NCBI
|
|
11
|
Palmes D and Spiegel HU: Animal models of
liver regeneration. Biomaterials. 25:1601–1611. 2004. View Article : Google Scholar : PubMed/NCBI
|
|
12
|
Papeleu P, Vanhaecke T, Henkens T, Elaut
G, Vinken M, Snykers S and Rogiers V: Isolation of rat hepatocytes.
Methods Mol Biol. 320:229–237. 2006.PubMed/NCBI
|
|
13
|
Gordon GJ, Butz GM, Grisham JW and Coleman
WB: Isolation, short-term culture and transplantation of small
hepatocyte-like progenitor cells from retrorsine-exposed rats.
Transplantation. 73:1236–1243. 2002. View Article : Google Scholar : PubMed/NCBI
|
|
14
|
Livak KJ and Schmittgen TD: Analysis of
relative gene expression data using real-time quantitative PCR and
the 2(−Delta Delta C(T)) Method. Methods. 25:402–408. 2001.
View Article : Google Scholar : PubMed/NCBI
|
|
15
|
Furmanski AL, Saldana JI, Ono M, Sahni H,
Paschalidis N, D'Acquisto F and Crompton T: Tissue-derived hedgehog
proteins modulate the differentiation and disease. J Immunol.
190:2641–2649. 2013. View Article : Google Scholar : PubMed/NCBI
|
|
16
|
Than NN and Newsome PN: Stem cells for
liver regeneration. QJM. 107:417–421. 2014. View Article : Google Scholar : PubMed/NCBI
|
|
17
|
Snykers S, De Kock J, Vanhaecke T and
Rogiers V: Differentiation of neonatal rat epithelial cells from
biliary origin into immature hepatic cells by sequential exposure
to hepatogenic cytokines and growth factors reflecting liver
development. Toxicol In Vitro. 21:1325–1331. 2007. View Article : Google Scholar : PubMed/NCBI
|
|
18
|
Tanaka M, Itoh T, Tanimizu N and Miyajima
A: Liver stem/progenitor cells: Their characteristics and
regulatory mechanisms. J Biochem. 149:231–239. 2011. View Article : Google Scholar : PubMed/NCBI
|
|
19
|
Koenig S, Krause P, Drabent B, Schaeffner
I, Christ B, Schwartz P, Unthan-Fechner K and Probst I: The
expression of mesenchymal, neural and haematopoietic stem cell
markers in adult hepatocytes proliferating in vitro. J Hepatol.
44:1115–1124. 2006. View Article : Google Scholar : PubMed/NCBI
|
|
20
|
Böhm F, Köhler UA, Speicher T and Werner
S: Regulation of liver regeneration by growth factors and
cytokines. EMBO Mol Med. 2:294–305. 2010. View Article : Google Scholar : PubMed/NCBI
|
|
21
|
Robbins DJ, Fei DL and Riobo NA: The
Hedgehog signal transduction network. Sci Signal. 5:re62012.
View Article : Google Scholar : PubMed/NCBI
|
|
22
|
Machado MV, Michelotti GA, Tde A Pereira,
Boursier J, Kruger L, Swiderska-Syn M, Karaca G, Xie G, Guy CD,
Bohinc B, et al: Reduced lipoapoptosis, hedgehog pathway activation
and fibrosis in caspase-2 deficient mice with non-alcoholic
steatohepatitis. Gut. 64:1148–1157. 2015. View Article : Google Scholar : PubMed/NCBI
|
|
23
|
Mitaka T, Ichinohe N and Kon J:
Thy1-positive cell transplantation activates the growth of small
hepatocyte-like progenitor cells in rat livers treated with
retrorsine and PH. FASEB J. 27:2572013.
|
|
24
|
Best DH and Coleman WB: Bile duct
destruction by 4, 4′-diaminodiphenylmethane does not block the
small hepatocyte-like progenitor cell response in
retrorsine-exposed rats. Hepatology. 46:1611–1619. 2007. View Article : Google Scholar : PubMed/NCBI
|
|
25
|
Best DH and Coleman WB: Treatment with
2-AAF blocks the small hepatocyte-like progenitor cell response in
retrorsine-exposed rats. J Hepatol. 46:1055–1063. 2007. View Article : Google Scholar : PubMed/NCBI
|
|
26
|
Agarwal JR, Wang Q, Tanno T, Rasheed Z,
Merchant A, Ghosh N, Borrello I, Huff CA, Parhami F and Matsui W:
Activation of liver X receptors inhibits hedgehog signaling,
clonogenic growth and self-renewal in multiple myeloma. Mol Cancer
Ther. 13:1873–1881. 2014. View Article : Google Scholar : PubMed/NCBI
|


