Introduction
The human gustatory system allows the sense of the
following five basic tastes: Sour, bitter, sweet, salty and umami.
The biological mechanism of taste involves a series of electrical
signals triggered by molecular stimulations of the taste buds.
These impulses are conducted to the brain, which interprets these
signals as the appropriate taste (1,2).
Historically, tastes were evaluated with human
taster panels, which suffer from numerous limitations such as
tester fatigue, particularly in regards to bitterness. In the early
stages of drug development, this method is unsuitable because it
has a high cost and is potentially dangerous (3,4).
Therefore, analytical taste sensing tools such as the electronic
tongue (E-tongue) have been developed to increase safety and reduce
costs. E-tongue technology originated from multi-analyte sensing
technology between the 1980s and 1990s. The electronic nose was a
particularly powerful example of multi-analyte sensing and has been
employed in defense and environmental applications (5). Later, researchers extended this to
solution-phase analysis for a variety of chemical ‘tastes’.
Analytes include small molecules, proteins and whole blood cells
(6,7). At the core of the technology are
multiple sets of taste sensor arrays, whose surface is coated with
a ‘sensing membrane’ material similar to that in biological
systems. When a taste substance is adsorbed onto this membrane,
data is obtained from the resulting changes in membrane potential.
This technology offers an intelligent electronic recognition
system, which reflects the overall taste information of a sample
(1,8–10).
This taste-sensing technology has been applied to
the food industry (11,12) for >20 years in numerous roles,
including food traceability (13),
freshness (14), quality (15–17) and
safety inspection (18,19). Increasingly, this technique is being
applied in pharmaceutical fields (20–22),
where it is frequently used to evaluate the bitterness of medicines
and make improvements to their formulations (23–28).
Although the collection of taste information of
foods and drugs using the E-tongue, and the following post-hoc
processing and analysis, is now fairly common, there remains
multiple unresolved issues in regards to precision and
reproducibility of the results, and the identification of taste
between different systems. The present study utilized the E-tongue
to collect taste information on medicines that have not been
characterized. To the best of our knowledge, this is the first
study to optimize the methodology of taste analysis using the
E-tongue (22–24). The method established was empirically
optimized, validated and applied to collect taste information of a
number of TCM decoctions.
Materials and methods
Apparatus
The present study was performed using an ASTREE II
electronic tongue (Alpha M.O.S, Toulouse, France). The E-tongue
consisted of a hexadecimal autosampler, a silver/silver chloride
reference electrode, a data acquisition system, a workstation
running AlphaSoft software (version 12; Alpha M.O.S, Toulouse,
France) and seven sensors. The seven sensors were called
ZZ2808-2-512 (ZZ), CA2804-2-440 (CA), DA2808-12-330 (DA),
BA2808-2-230 (BA), GA2808-2-361 (GA), BB2011-09-141 (BB) and
AB2011-10-010 (AB), and were specifically developed for measuring
bitterness. The sensors contain two semiconductor regions composed
of a thermal insulation material, each covered with a different
molecular membrane, with different adsorption properties and the
detection thresholds.
Preparation of berberine
hydrochloride, rhynchophylline, leonurine, matrine and quinine
samples
Samples were weighed using an electronic balance
(±0.1 mg accuracy) at room temperature and dissolved completely in
deionized water. Solutions of berberine hydrochloride (lot no.
101002; Sichuan Province Yuxin Pharmaceutical Co., Ltd., Deyang,
China), rhynchophylline (lot no. 20100216; Hubei Tungshun Medicine
Science & Technology Co., Ltd., Wuhan, China), leonurine (lot
no. SX-091205; Xi'an Hao-Xuan Bio-Tech Co., Ltd., Xi'an, China),
matrine (lot no. KS20110725; Xi'an Jiatian Biotechnology Co., Ltd.)
and quinine (lot no. 20100510; Shanxi Tianyuan Pharmaceutical Co.
Ltd, Yùnchéng, China) were prepared at concentrations of 0, 0.025,
0.1, 0.25, 0.5 and 1 mmol and stored at 4°C until required.
Preparation of TCM samples
Ten-fold concentrations of 35 Chinese herbs were
prepared, relative to the mean of the prescribed dosage in the
Pharmacopoeia of the People's Republic of China. The herbs were
placed in 2,000 ml water, soaked for 30 min and heated in a
microwave (2100 W) until boiling. The power was then reduced to 600
W and the solution heated for a further 20 min. The remaining herb
pieces were filtered out, an additional 2,000 ml of water was
added, the solution heated until boiling and then boiled for 10
min. This process was repeated for each herb. Then, the filtrates
of the first and second decoctions were combined, mixed and cooled
to room temperature, followed by centrifugation at room temperature
for 15 min at 1,434 × g. The supernatant was collected and
the volume adjusted to 4,000 ml. Samples were aliquoted, capped,
sterilized and stored at 4°C until required.
Optimization of measurement time
Purified water was used as the washing solution and
0.5 mmol caffeine solution was used as the sample. The E-tongue was
cleaned with washing solution (6 times, 10 sec/wash). Then, 80 ml
of sample solution was placed in a 120 ml beaker for analysis. Each
E-tongue measurement used all 7 sensors, which was taken at room
temperature and lasted 120 sec. The same sample was measured 10
times consecutively, with the values of last 4 measurements being
used to calculate the relative standard deviation (RSD). In
addition, RSD was measured in in 10 sec ranges (e.g. 0–9, 1–10 and
2–11 sec).
Optimization of the number of sample
measurements
At the beginning of a measurement the signal is
unstable, stabilizing as the number of measurements increase. To
investigate how many replicates were required for the response
signal to become stable, matrine and berberine hydrochloride
samples (described previously) were measured using the E-tongue 10
times, with each measurement lasting for 120 sec. RSD values were
calculated for all measurements and then compared.
Optimization of the order of E-tongue
washing and sample measurement
Berberine hydrochloride (80 ml) was added to a 120
ml beaker for E-tongue measurements. The following two measurement
schemes were then performed: i) The E-tongue was washed once
in-between each measurement of the same sample; and ii) the same
sample was measured without washing in-between. In this experiment,
the same sample was measured seven times (120 sec each) and the
results of last 4 measurements used to calculate the RSD.
Validation of reproducibility
Aqueous solutions of 0.5 mmol rhynchophylline,
matrine, quinine and leonurine were prepared in triplicate (12
samples total). E-tongue measurements were conducted under the
optimized conditions described above. In this experiment, the same
solution was measured seven times (120 sec each) and the results of
last 4 measurements used to calculate the RSD. The RSD of each
sample prepared in triplicate was then compared to evaluate
reproducibility.
Validation of precision within a
measurement cycle (6 h)
The measurement time is <15 min for a single
sample, however, a complete experiment requires the measurement of
multiple samples. In order to ensure accuracy of the results, the
measurement of all samples need to be finished within a measurement
cycle (6 h). Aqueous solutions of quinine at 0.1, 0.5 and 1.0 mmol
were prepared and measured using the E-tongue. Measurements were
repeated four times. All measurements were completed within 6 h,
and the results of last 4 measurements used to calculate the
RSD.
Validation of inter-day precision
Aqueous solutions of quinine at 0.025, 0.1, 0.25,
0.5 and 1.0 mmol were measured in triplicate on days 1, 2 and 3 to
measure E-tongue data reproducibility on different days. In
addition, the RSD of E-tongue measurements over the three days was
calculated.
Analysis of the taste of TCMs with
different degrees of bitterness
In the present study 35 Chinese herbs (lot no.
20110224; Henan Zhongyi Pharmaceutical Co., Ltd., Zhengzhou, China)
were selected from the ‘Pharmacopoeia of the People's Republic of
China’ (29). This text describes
the TCMs used in the present study by the following
characteristics: Light smell, tasteless; light smell, slightly
bitter taste; light smell, bitter taste; and light smell, very
strong bitter taste. The tastes described were evaluated using a
human taster panel according to the degree of bitterness (30–32). TCM
samples, prepared as described above, were measured using the
E-tongue under the optimized conditions described above.
The results of E-tongue measurements and the human
taste panel were evaluated using the robust regression analysis
method (33,34). E-tongue measurements of 6 samples
were excluded, using standardized residuals and score distance as
indicators. These findings were in preparation for a publication
elsewhere (35). The remaining 29
samples were grouped into two classes or three classes (Table I), based upon their bitterness levels
(I–V) described by Liu et al (30). A two-dimensional bitterness
classification model was established by considering level I as a
class and grouping levels II, III, IV and V as the second class.
The three-dimensional classification models consider level I as a
class, levels II and II as a second class, and levels IV and V as a
third class.
 | Table I.TCM samples measured, including the
name of the drug and bitterness. |
Table I.
TCM samples measured, including the
name of the drug and bitterness.
| Sample no. | Chinese pinyin | Drug/sample | Bitterness | Two-dimensional
classification | Three-dimensional
classification |
|---|
| 1 | Fuling | Poria | 0.63 | I |
I |
| 2 | Tongcao | Tetrapanacis
medulla | 0.64 | I |
I |
| 3 | Sangzhi | Mori ramulus | 0.67 | I |
I |
| 4 | Gouteng | Uncariae ramulus
cum uncis | 0.70 | I |
I |
| 5 | Chuanmutong | Clematidis armandii
caulis | 0.70 | I |
I |
| 6 | Cheqianzi | Plantaginis
semen | 0.71 | I |
I |
| 7 | Mingdangshen | Changii radix | 0.73 | I |
I |
| 8 | Tianhuafeng | Trichosanthis
radix | 0.91 | I |
I |
| 9 | Zexie | Alismatis
rhizoma | 0.95 | I |
I |
| 10 | Zelan | Lycopi herba | 1.19 | I |
I |
| 11 | Cang'erzi | Xanthii
fructus | 1.21 | I |
I |
| 12 | Zhuru | Bambusae caulis in
taenias | 1.24 | I |
I |
| 13 | Duzhong | Eucommiae
cortex | 1.26 | I |
I |
| 14 | Cheqiancao | Plantaginis
herba | 1.26 | I |
I |
| 15 | Baiwei | Cynanchi atrati
radix et rhizoma | 1.67 | II | II |
| 16 | Qiancao | Rubiae radix et
rhizoma | 1.81 | II | II |
| 17 | Zhebeimu | Fritillariae
thunbergii bulbus | 1.82 | II | II |
| 18 | Beidougen | Menispermi
rhizoma | 2.03 | II | II |
| 19 | Yanhusuo | Corydalis
rhizoma | 2.80 | II | II |
| 20 | Fangji | Stephaniae
tetrandrae radix | 3.01 | II | II |
| 21 | Huangqin | Scutellariae
radix | 3.28 | II | II |
| 22 | Dangyao | Swertiae herba | 3.92 | II | III |
| 23 | Chuanxinlian | Andrographis
herba | 4.04 | II | III |
| 24 | Kumu | Picrasmae ramulus
et folium | 4.08 | II | III |
| 25 | Huanglian | Coptidis
rhizoma | 4.45 | II | III |
| 26 | Longdan | Gentianae radix et
rhizoma | 4.55 | II | III |
| 27 | Huangbo | Phellodendri
chinensis cortex | 4.66 | II | III |
| 28 | Huhuanglian | Picrorhizae
rhizoma | 4.67 | II | III |
| 29 | Kushen | Sophorae
flavescentis radix | 4.78 | II | III |
Statistical analysis
Least squares support vector machine (LS-SVM),
simple support vector machine (SVM) or discriminant analysis (DA)
classification algorithms were used for the classification models.
MATLAB (release R2011b; Mathworks, Inc., Natick, MA, USA) and
LS-SVMlab Toolbox software [version 1.8; www.esat.kuleuven.be/sisita/lssvmlab (accessed
23/01/16)] was used.
Using the LS-SVM method, the accuracy of the
classification models compared with the results of the human taste
panel measured, this was then used to select the most appropriate
function for study, including linear kernels, polynomial kernels
and radial basis functions. For each type of kernel, a
self-compiled program screened and optimized the model parameters
repeatedly, finally selecting the most appropriate kernel function
and parameters. Modeling optimization was performed with SVM
(36) and DA (37), with classification accuracy rates of
cross-validation calculated separately.
PLS regression analysis was conducted on latent
variables. Then, the projection scoring factors in principal
component space were used to produce the two- and three-dimensional
classification results.
Results and Discussion
Optimization of measurement time
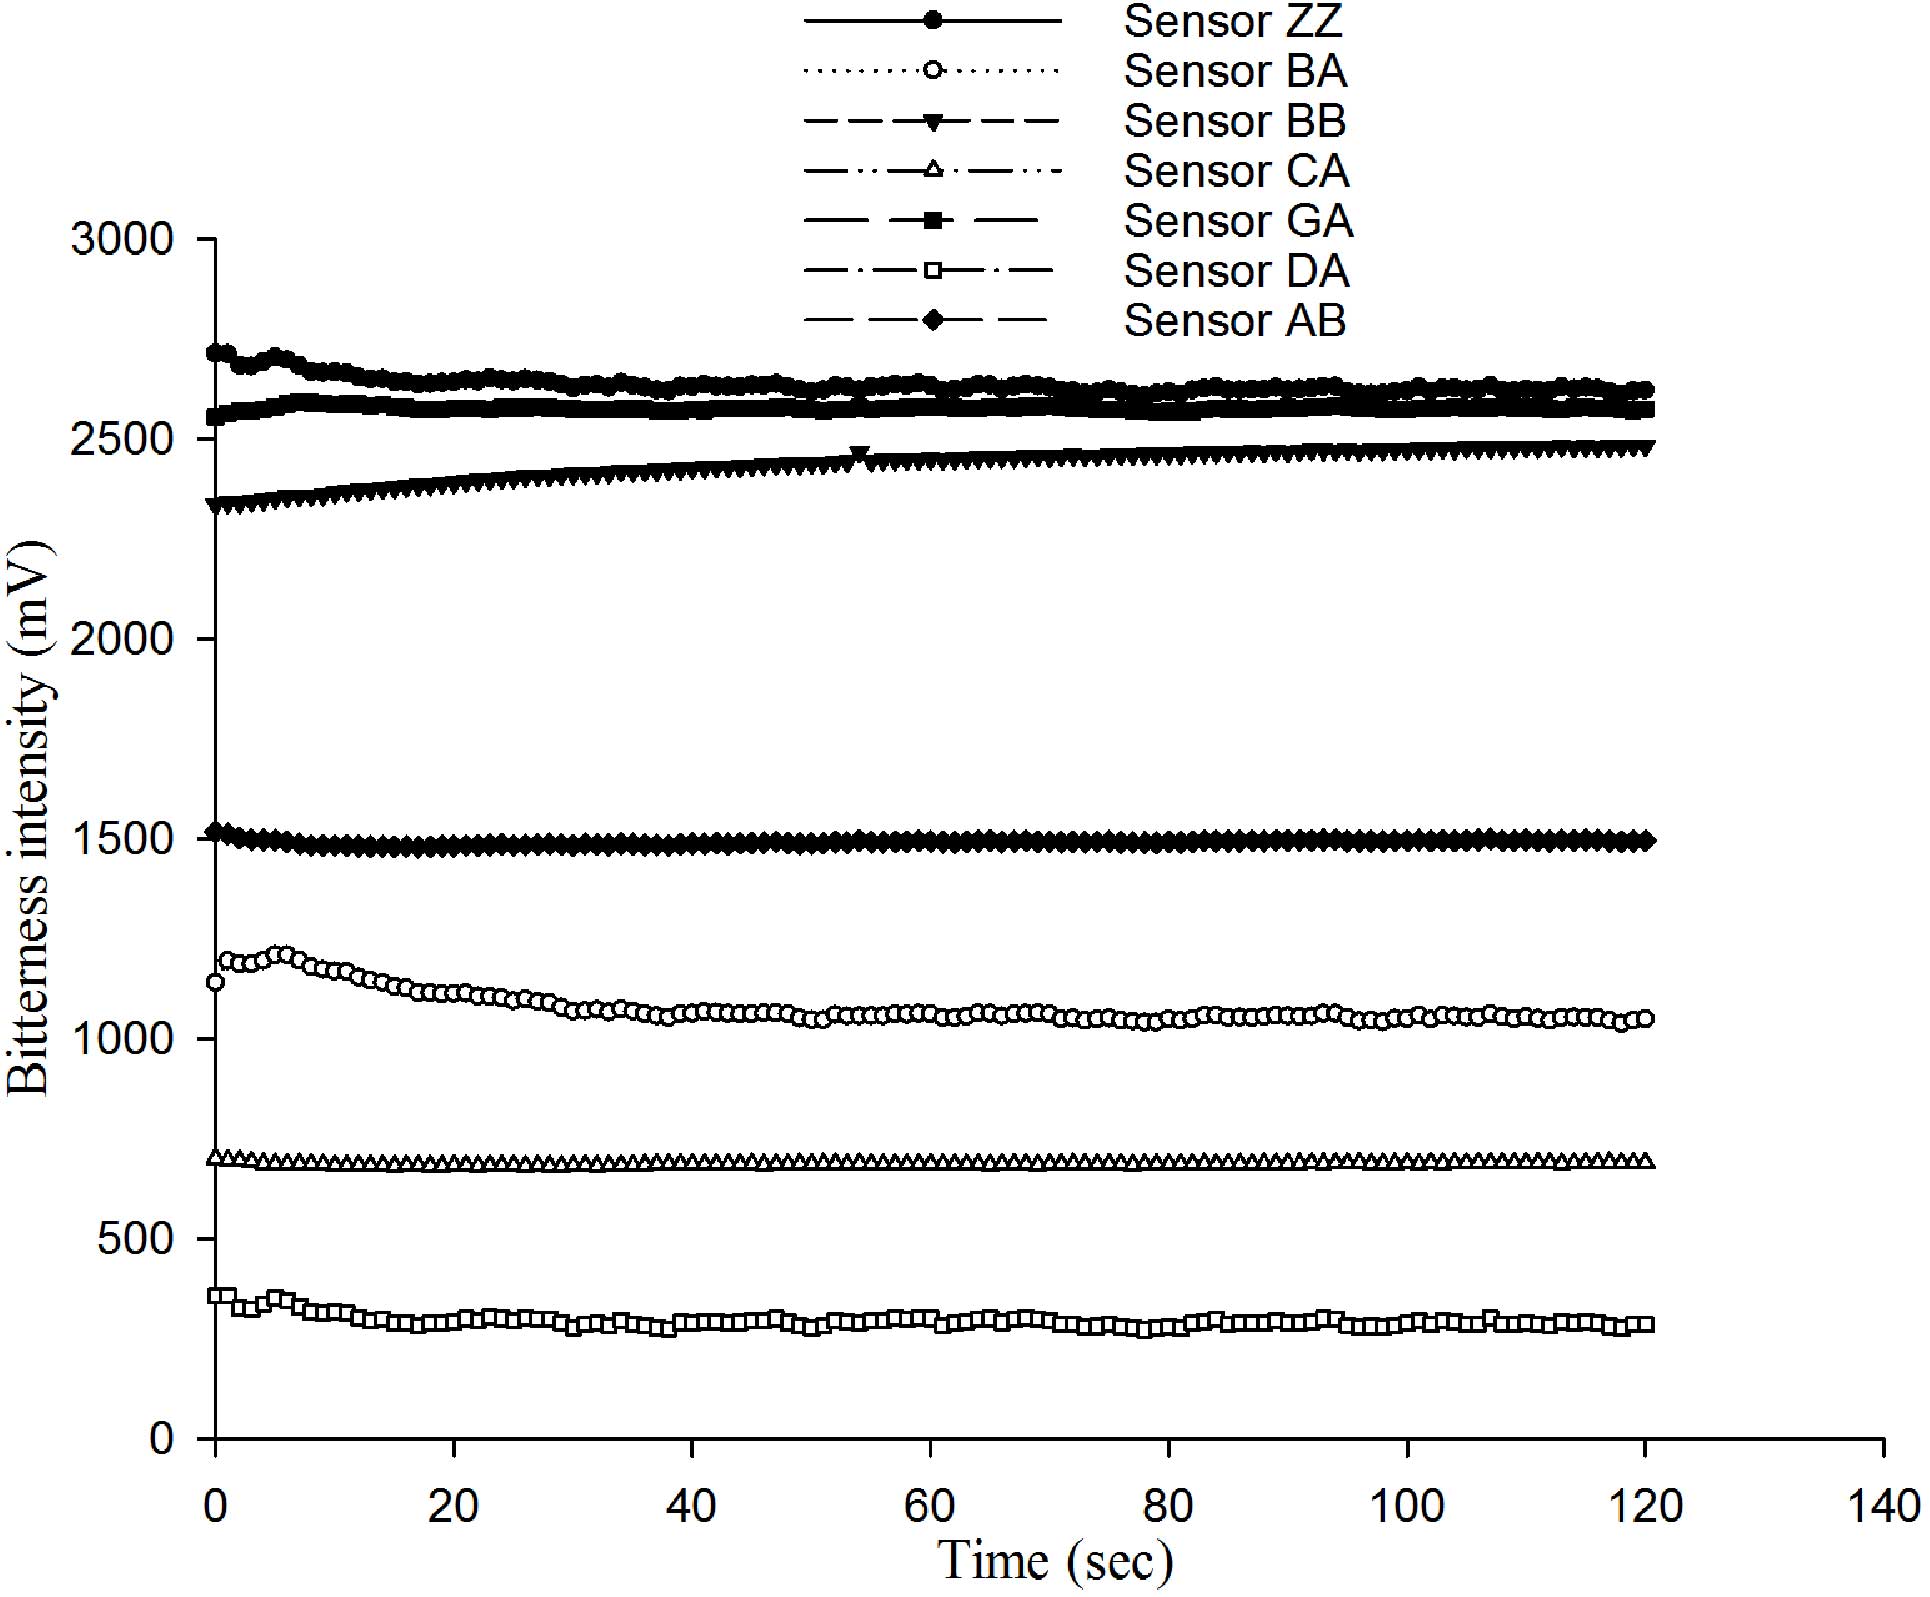
The aim of the present study was to identify when
E-tongue measurements become stable. This is important to assess
the validity of any future measurements, as the signal should not
be affected by noise. Firstly, sensor measurements of 0.5 mmol
caffeine solution showed the characteristic response curve of
sensors to the same solution (Fig.
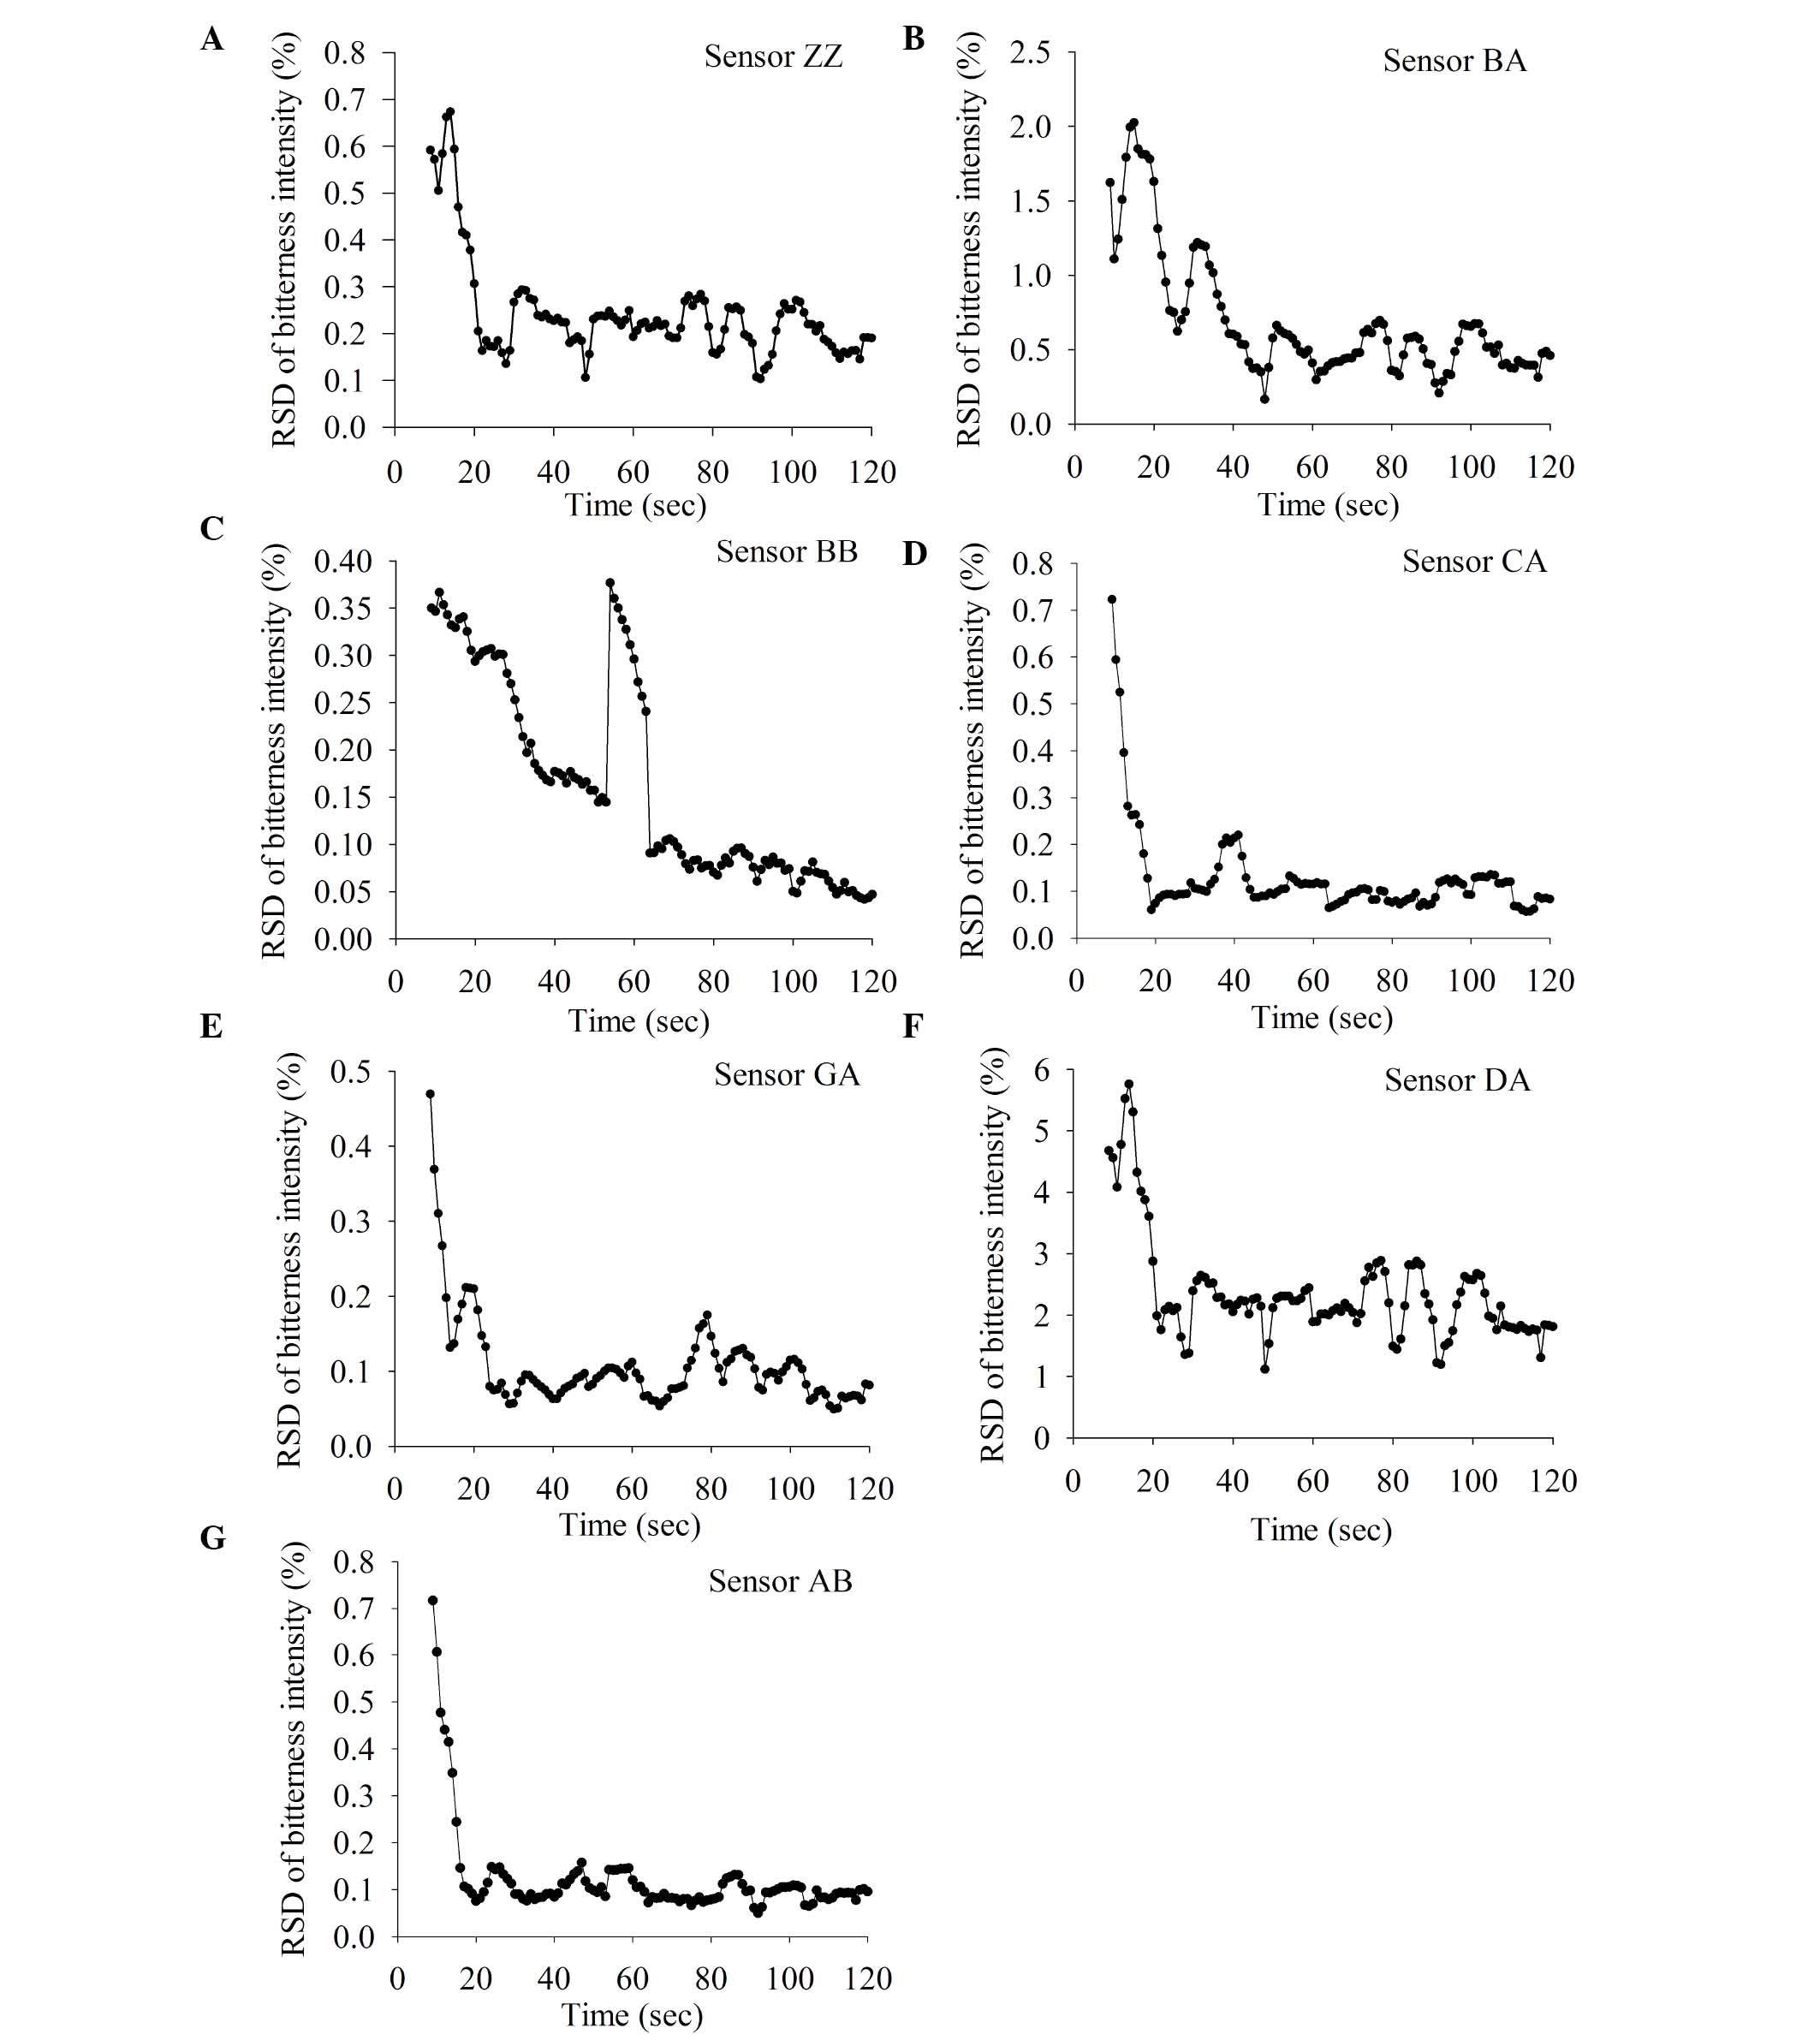
1) and the signal became more stable over time. Fig. 2 shows the RSD values of the seven
different sensors to 0.5 mmol caffeine solution. The RSD decreased
over time and reached a minimum by 120 sec. So, 120 sec measurement
times were used for all subsequent measurements.
Optimization of the number of sample
measurements taken
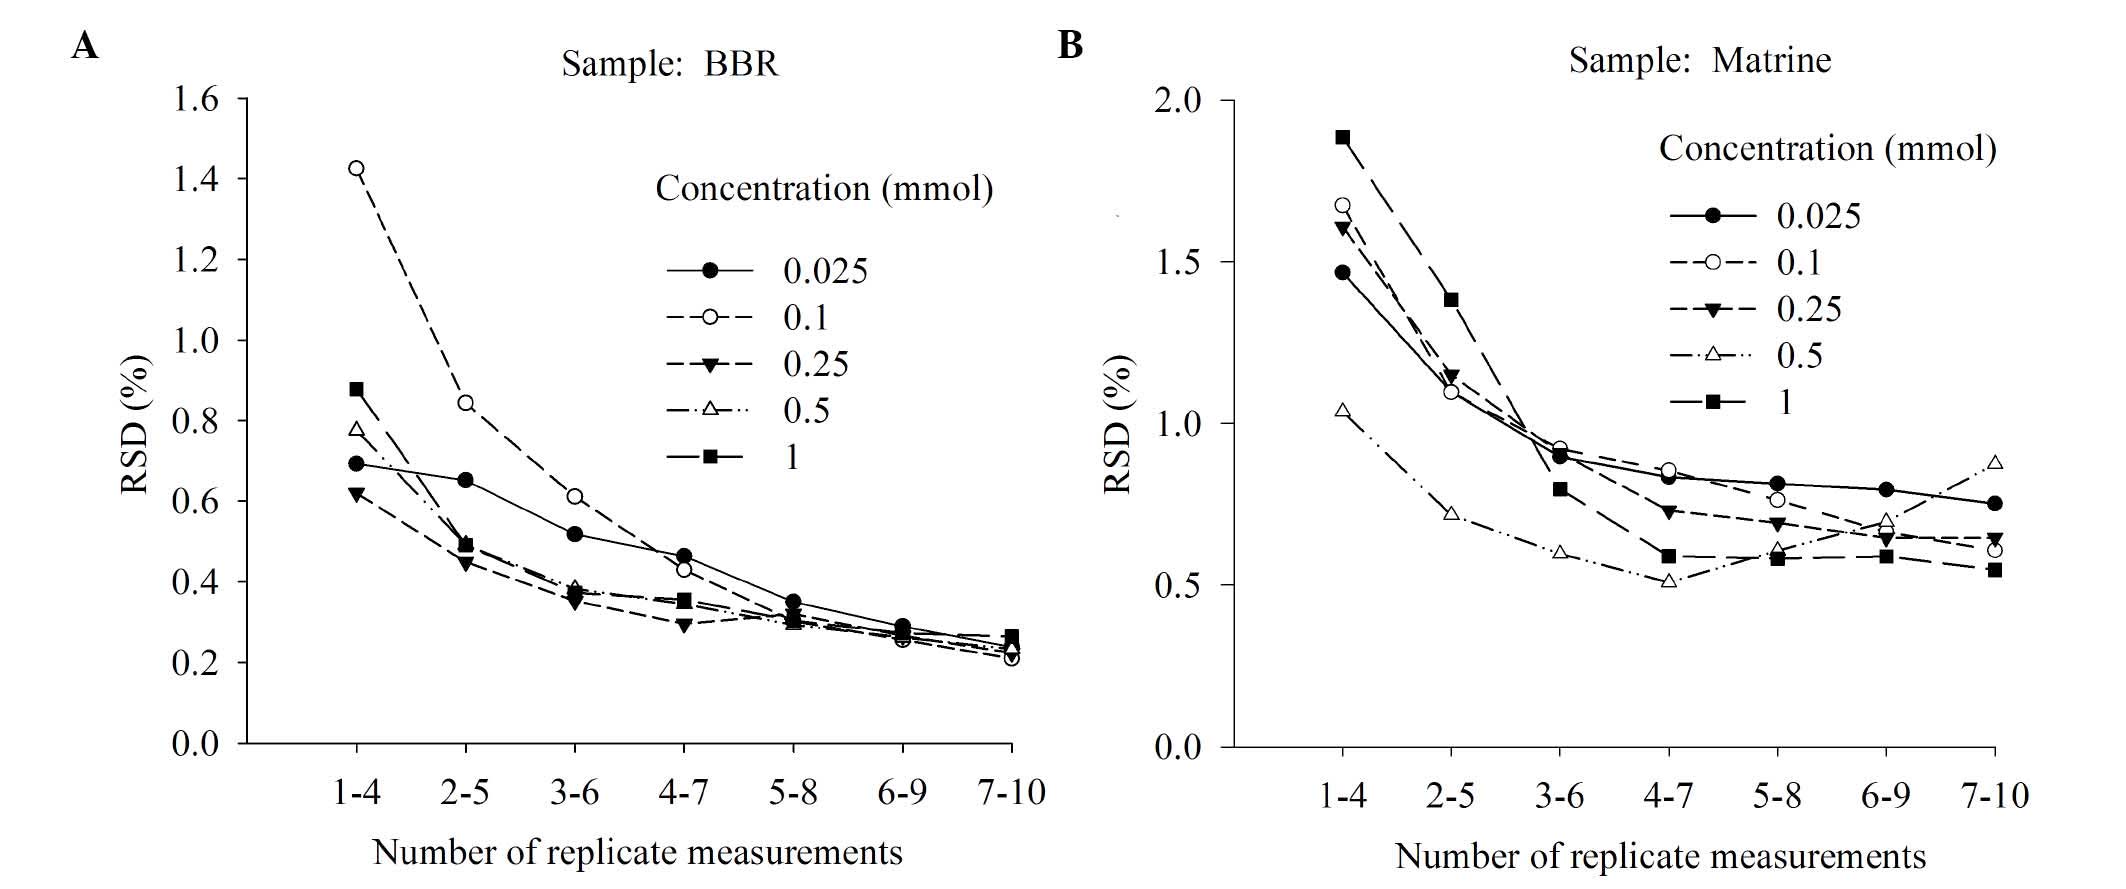
Next, the present study investigated how many sample
measurements were required to produce a stable response signal. For
each test sample, 10 replicate measurements were taken (Fig. 3). RSD was identified to decrease as
the number of measurements taken increased. The RSD from taking 4–7
measurements was not reduced further when >7 measurements were
taken. For example, for the berberine hydrochloride sample, the RSD
values of 7 repeats and 10 repeats were 1.89 and 3.05 fold that of
3 repeats (Fig. 3A). For matrine,
the RSD values of 4–7 repeats and 7–10 repeats were 1.99 and 2.04
times higher, respectively, than that of 3–6 repeats (Fig. 3B). Therefore, the number of
measurements taken of each sample was selected to be 7. In
addition, this will minimize analysis time and extend the E-tongue
lifetime.
Determination of the order of E-tongue
washing and sample measurements
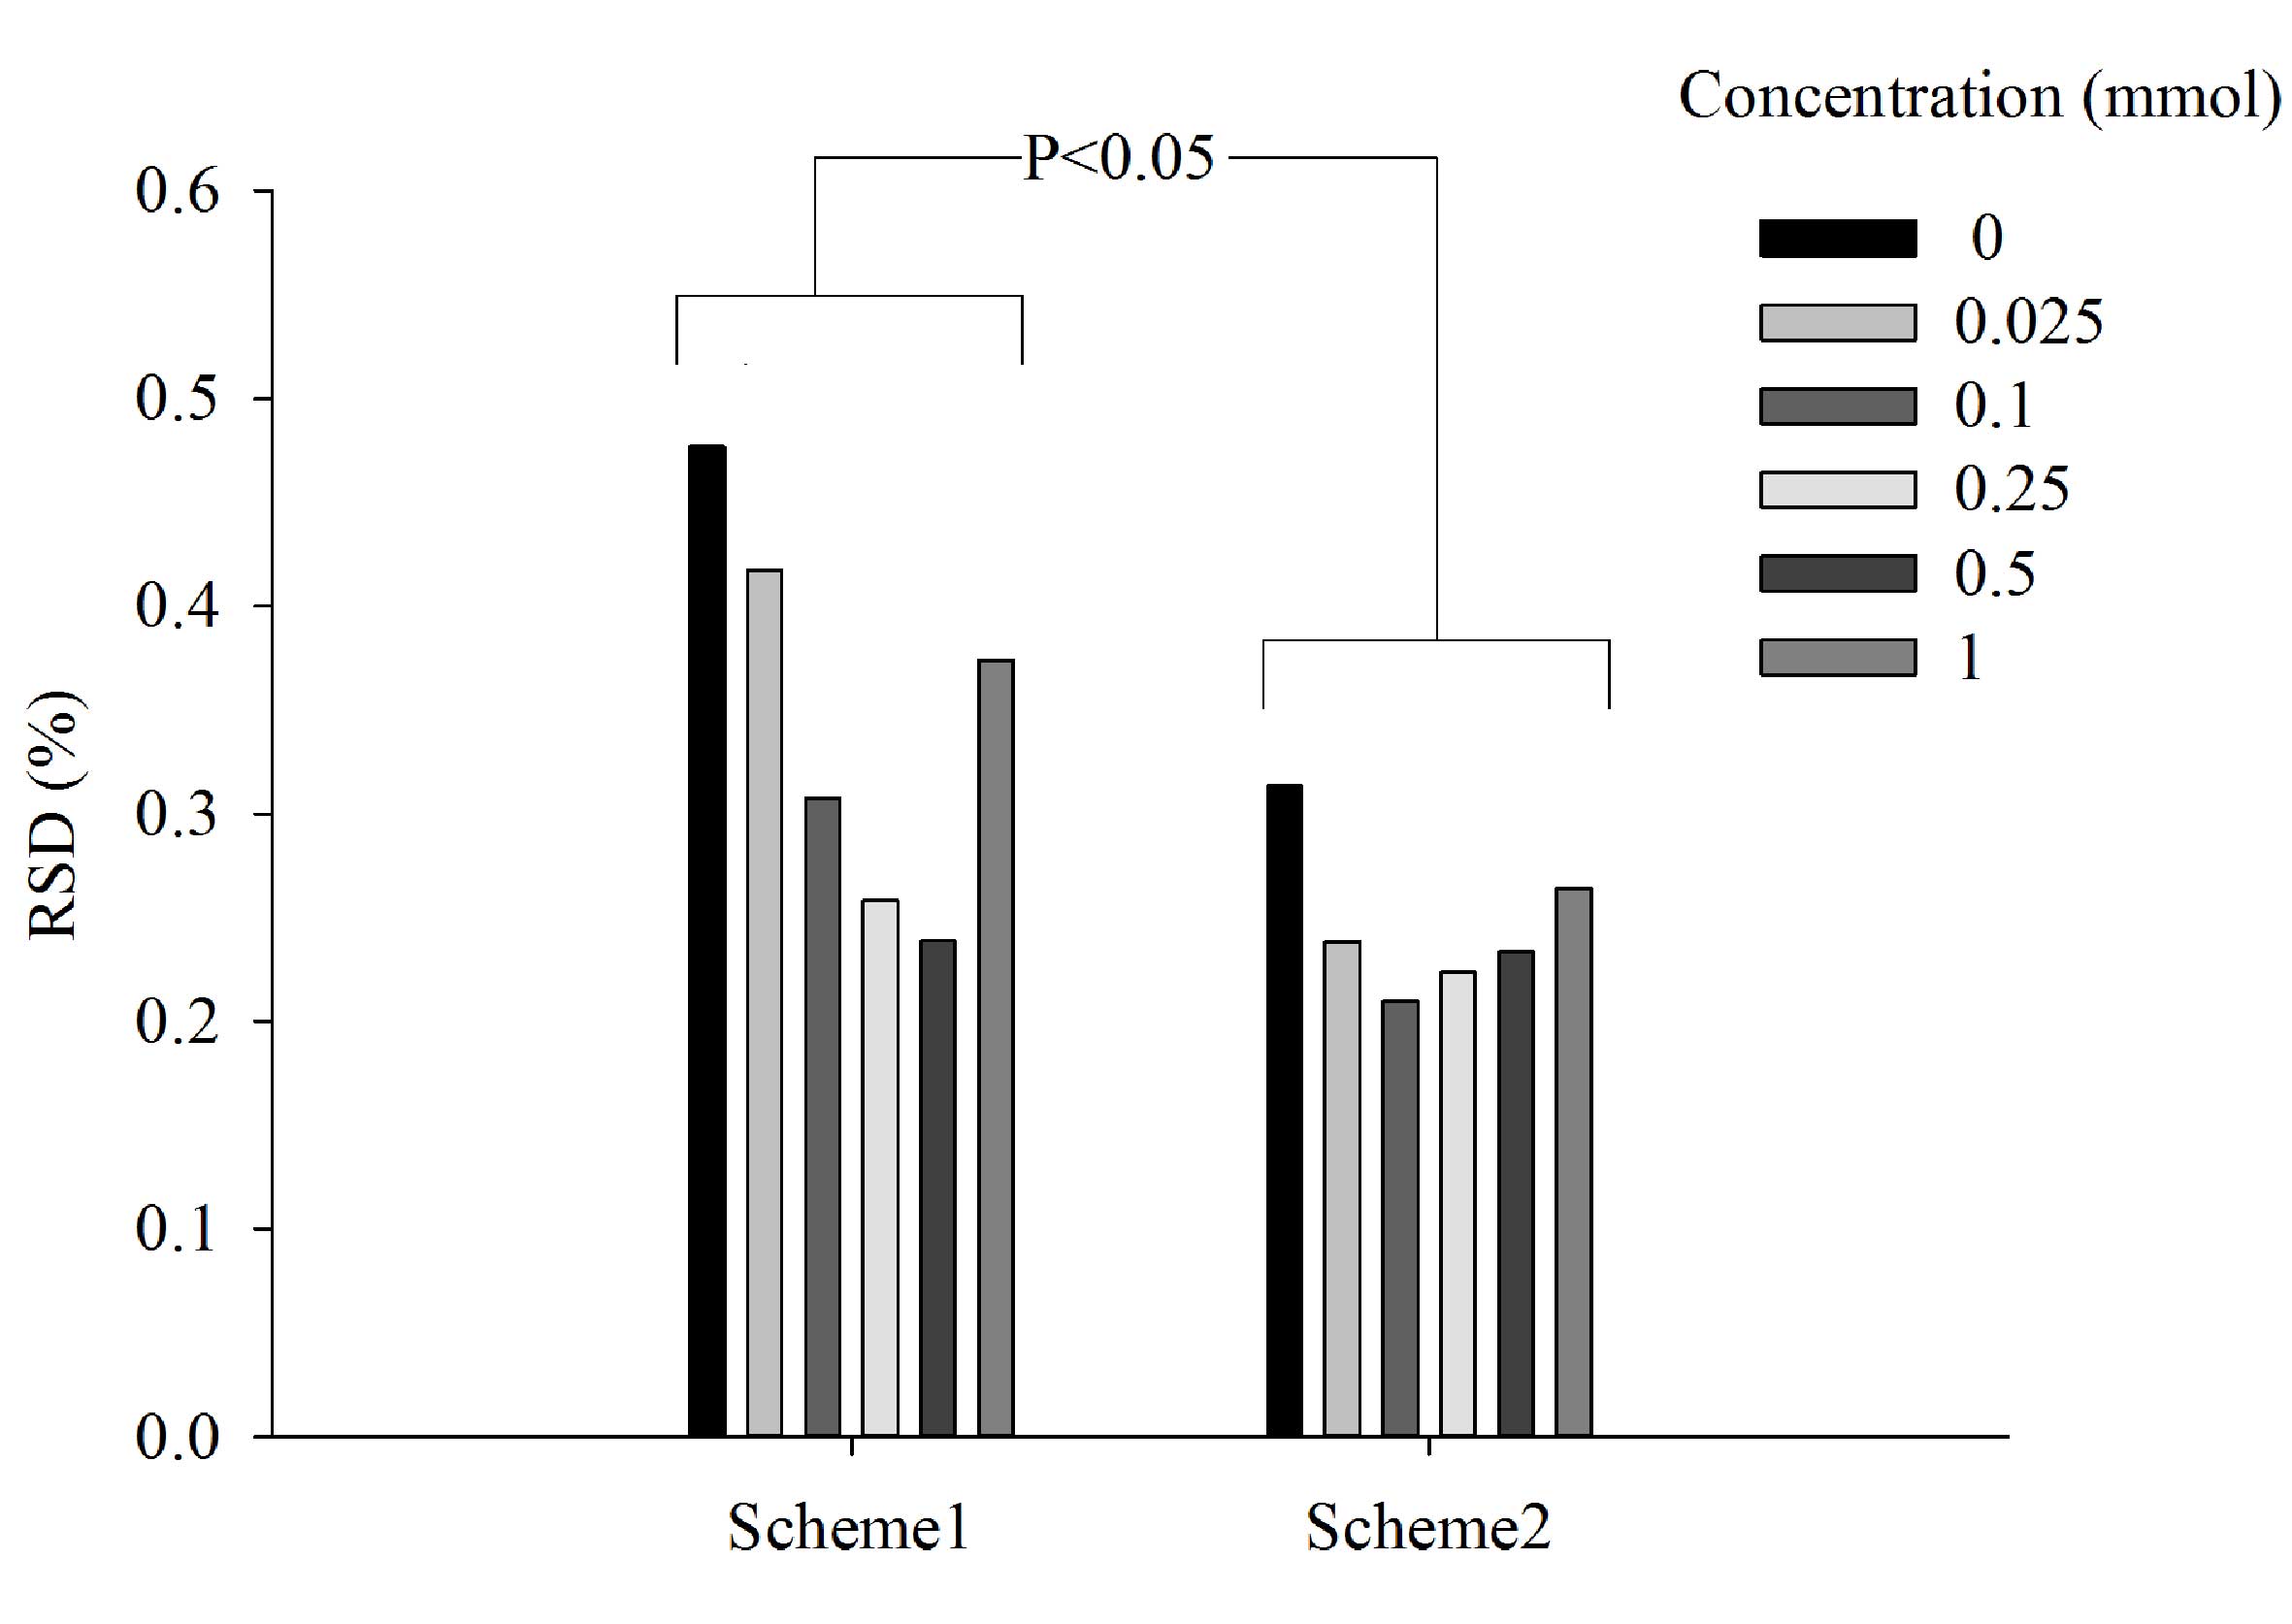
To determine the best approach to measurements, two
different schemes were tested on berberine hydrochloride solutions
(Fig. 4). In scheme 1 each
measurement of the same sample was followed by a single clean,
whereas in scheme 2 measurements of the same sample were taken in a
row. Scheme 2 was identified to be more stable because its RSD
values were between 1.5 and 2 fold lower compared with those from
scheme 1. The difference between the two schemes, at all respective
concentrations, was significant (P<0.05; Fig. 4). In a practical sense, the single
cleaning between each measurement used in scheme 1 required the
E-tongue to switch back and forth between the sample and its
corresponding washing cup. This was more time-consuming than the
method used in scheme 2. Thus, scheme 2 was chosen for the
remaining analysis.
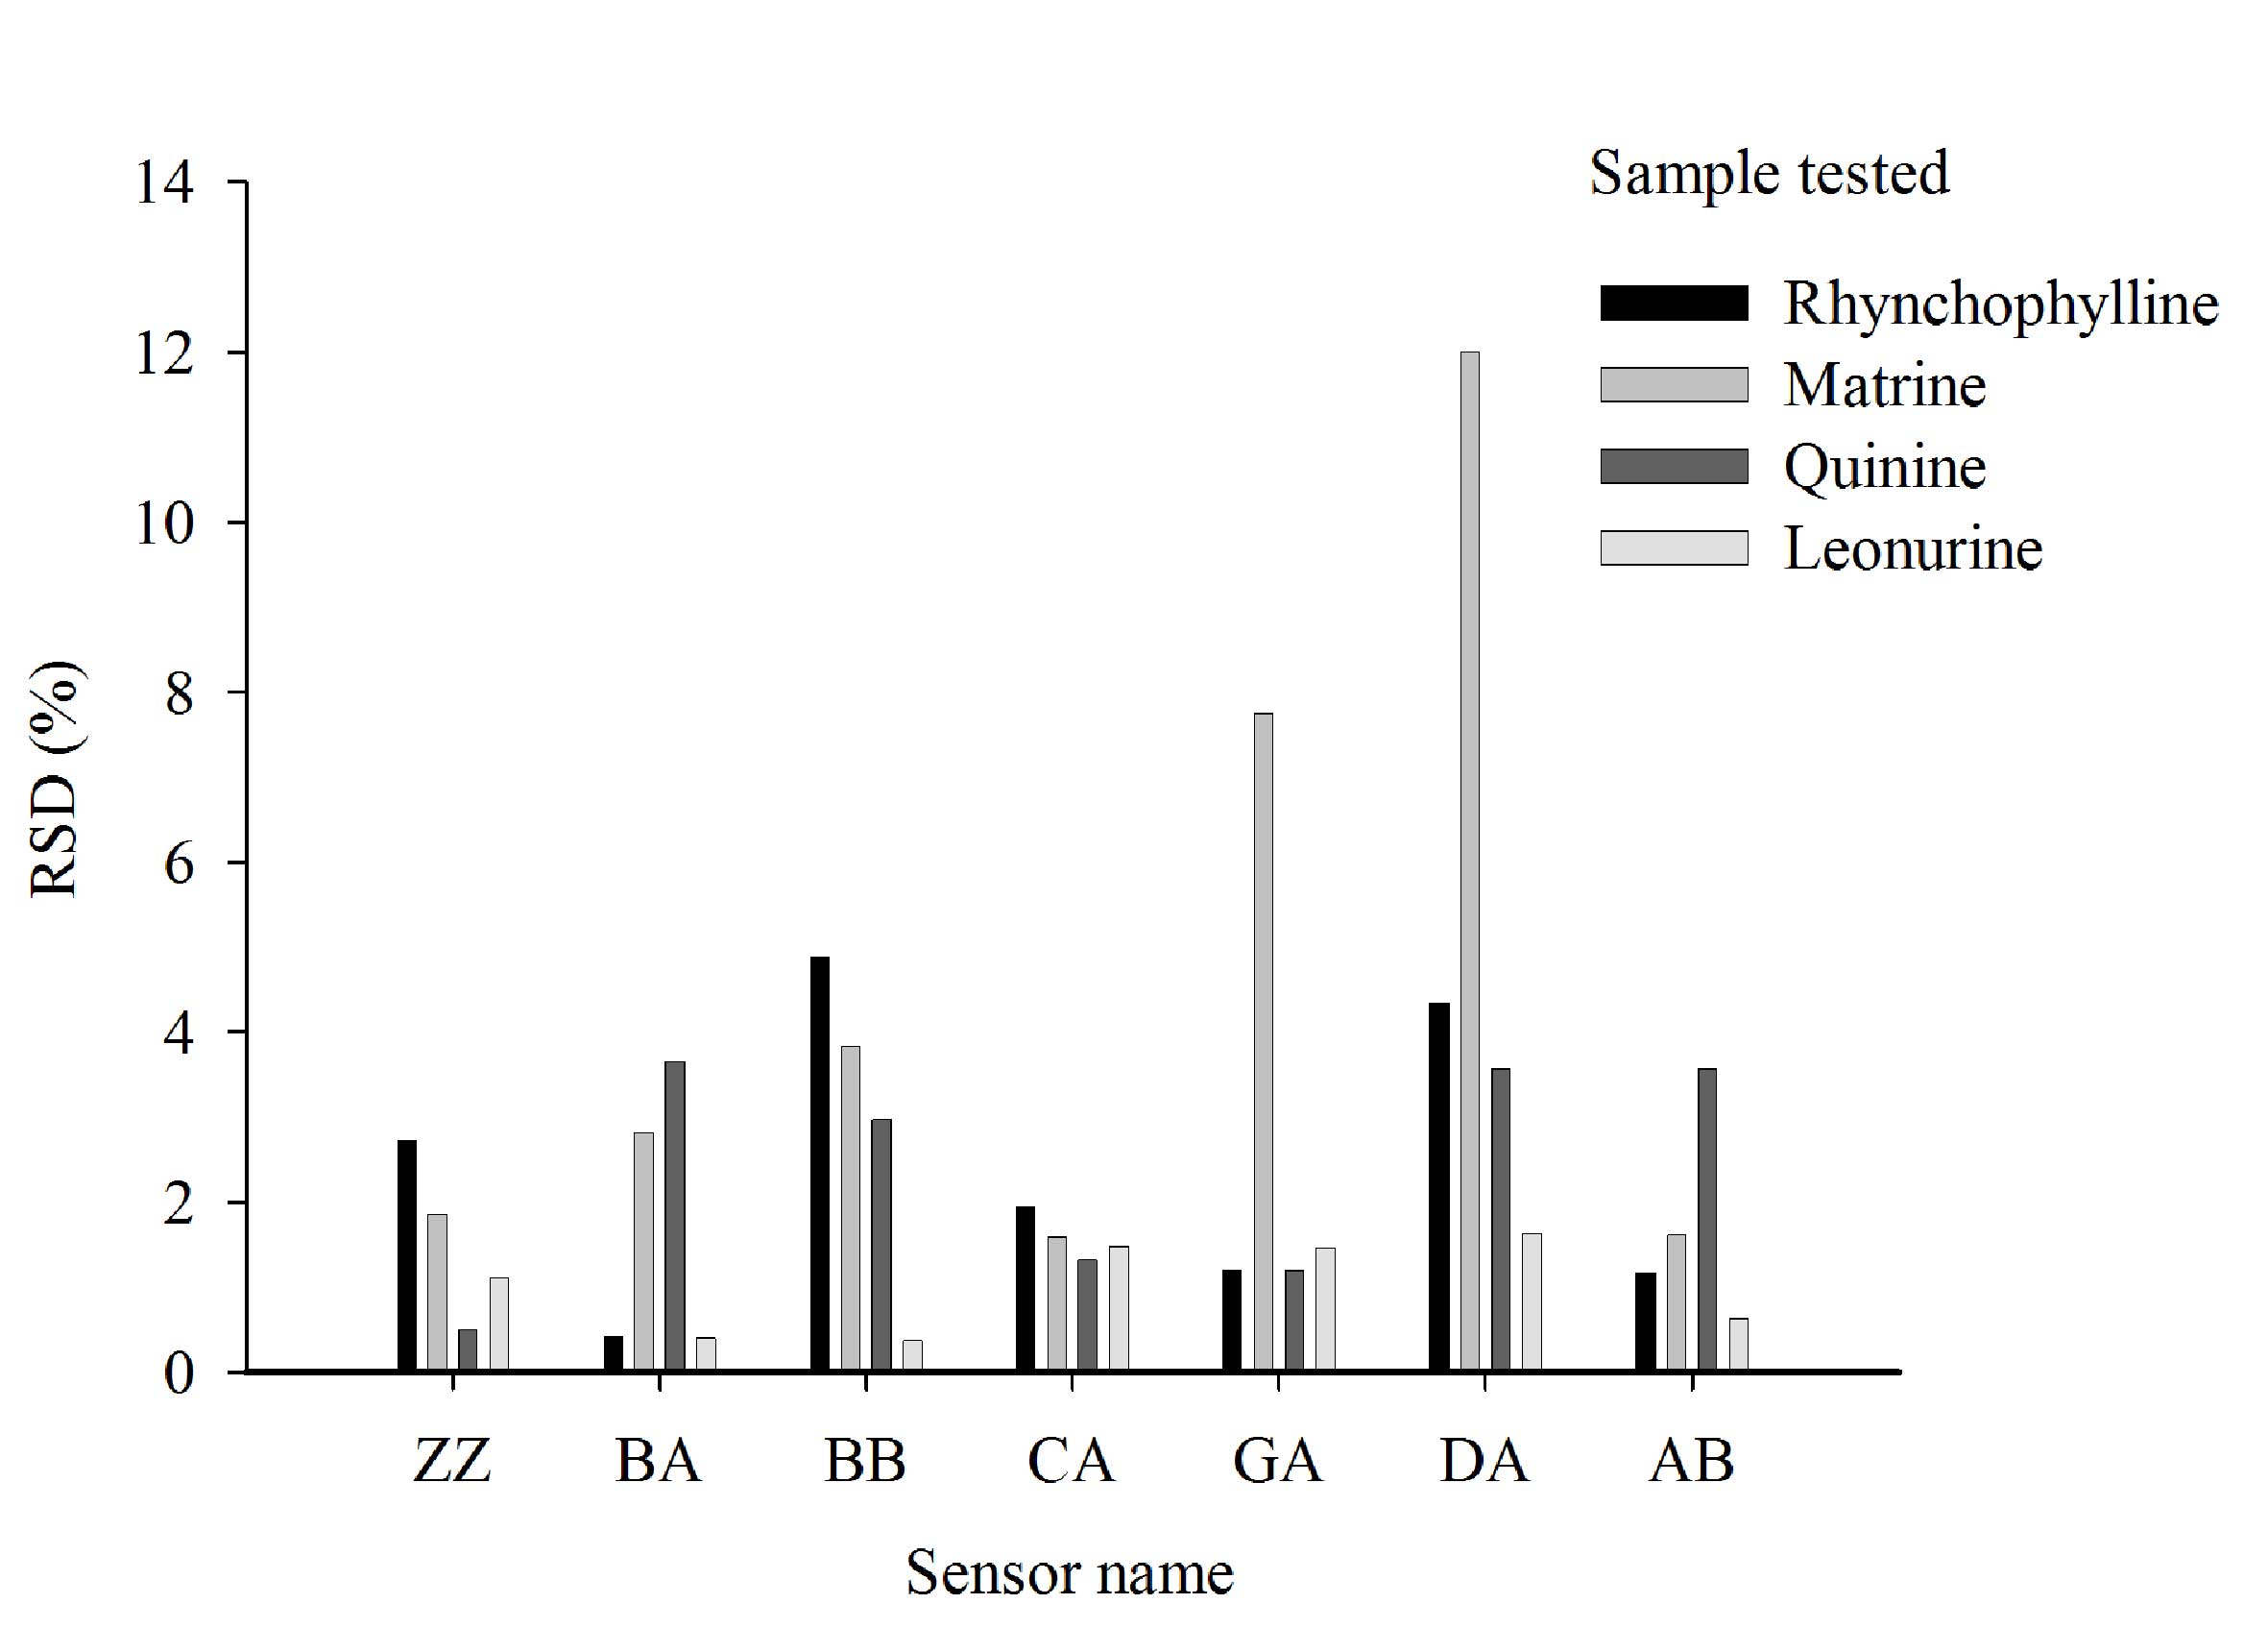
Reproducibility of results
The RSD values of the same sample in triplicate were
typically <5% for the majority of sensors (Fig. 5). However, when the sample was
matrine or quinine, the RSD values from sensors DA and GA were ≥11%
(Fig. 5). The baseline responses of
all seven sensors were normal and the E-tongue passed its
self-checking protocol. Thus, this variation is likely due to the
samples and not the E-tongue.
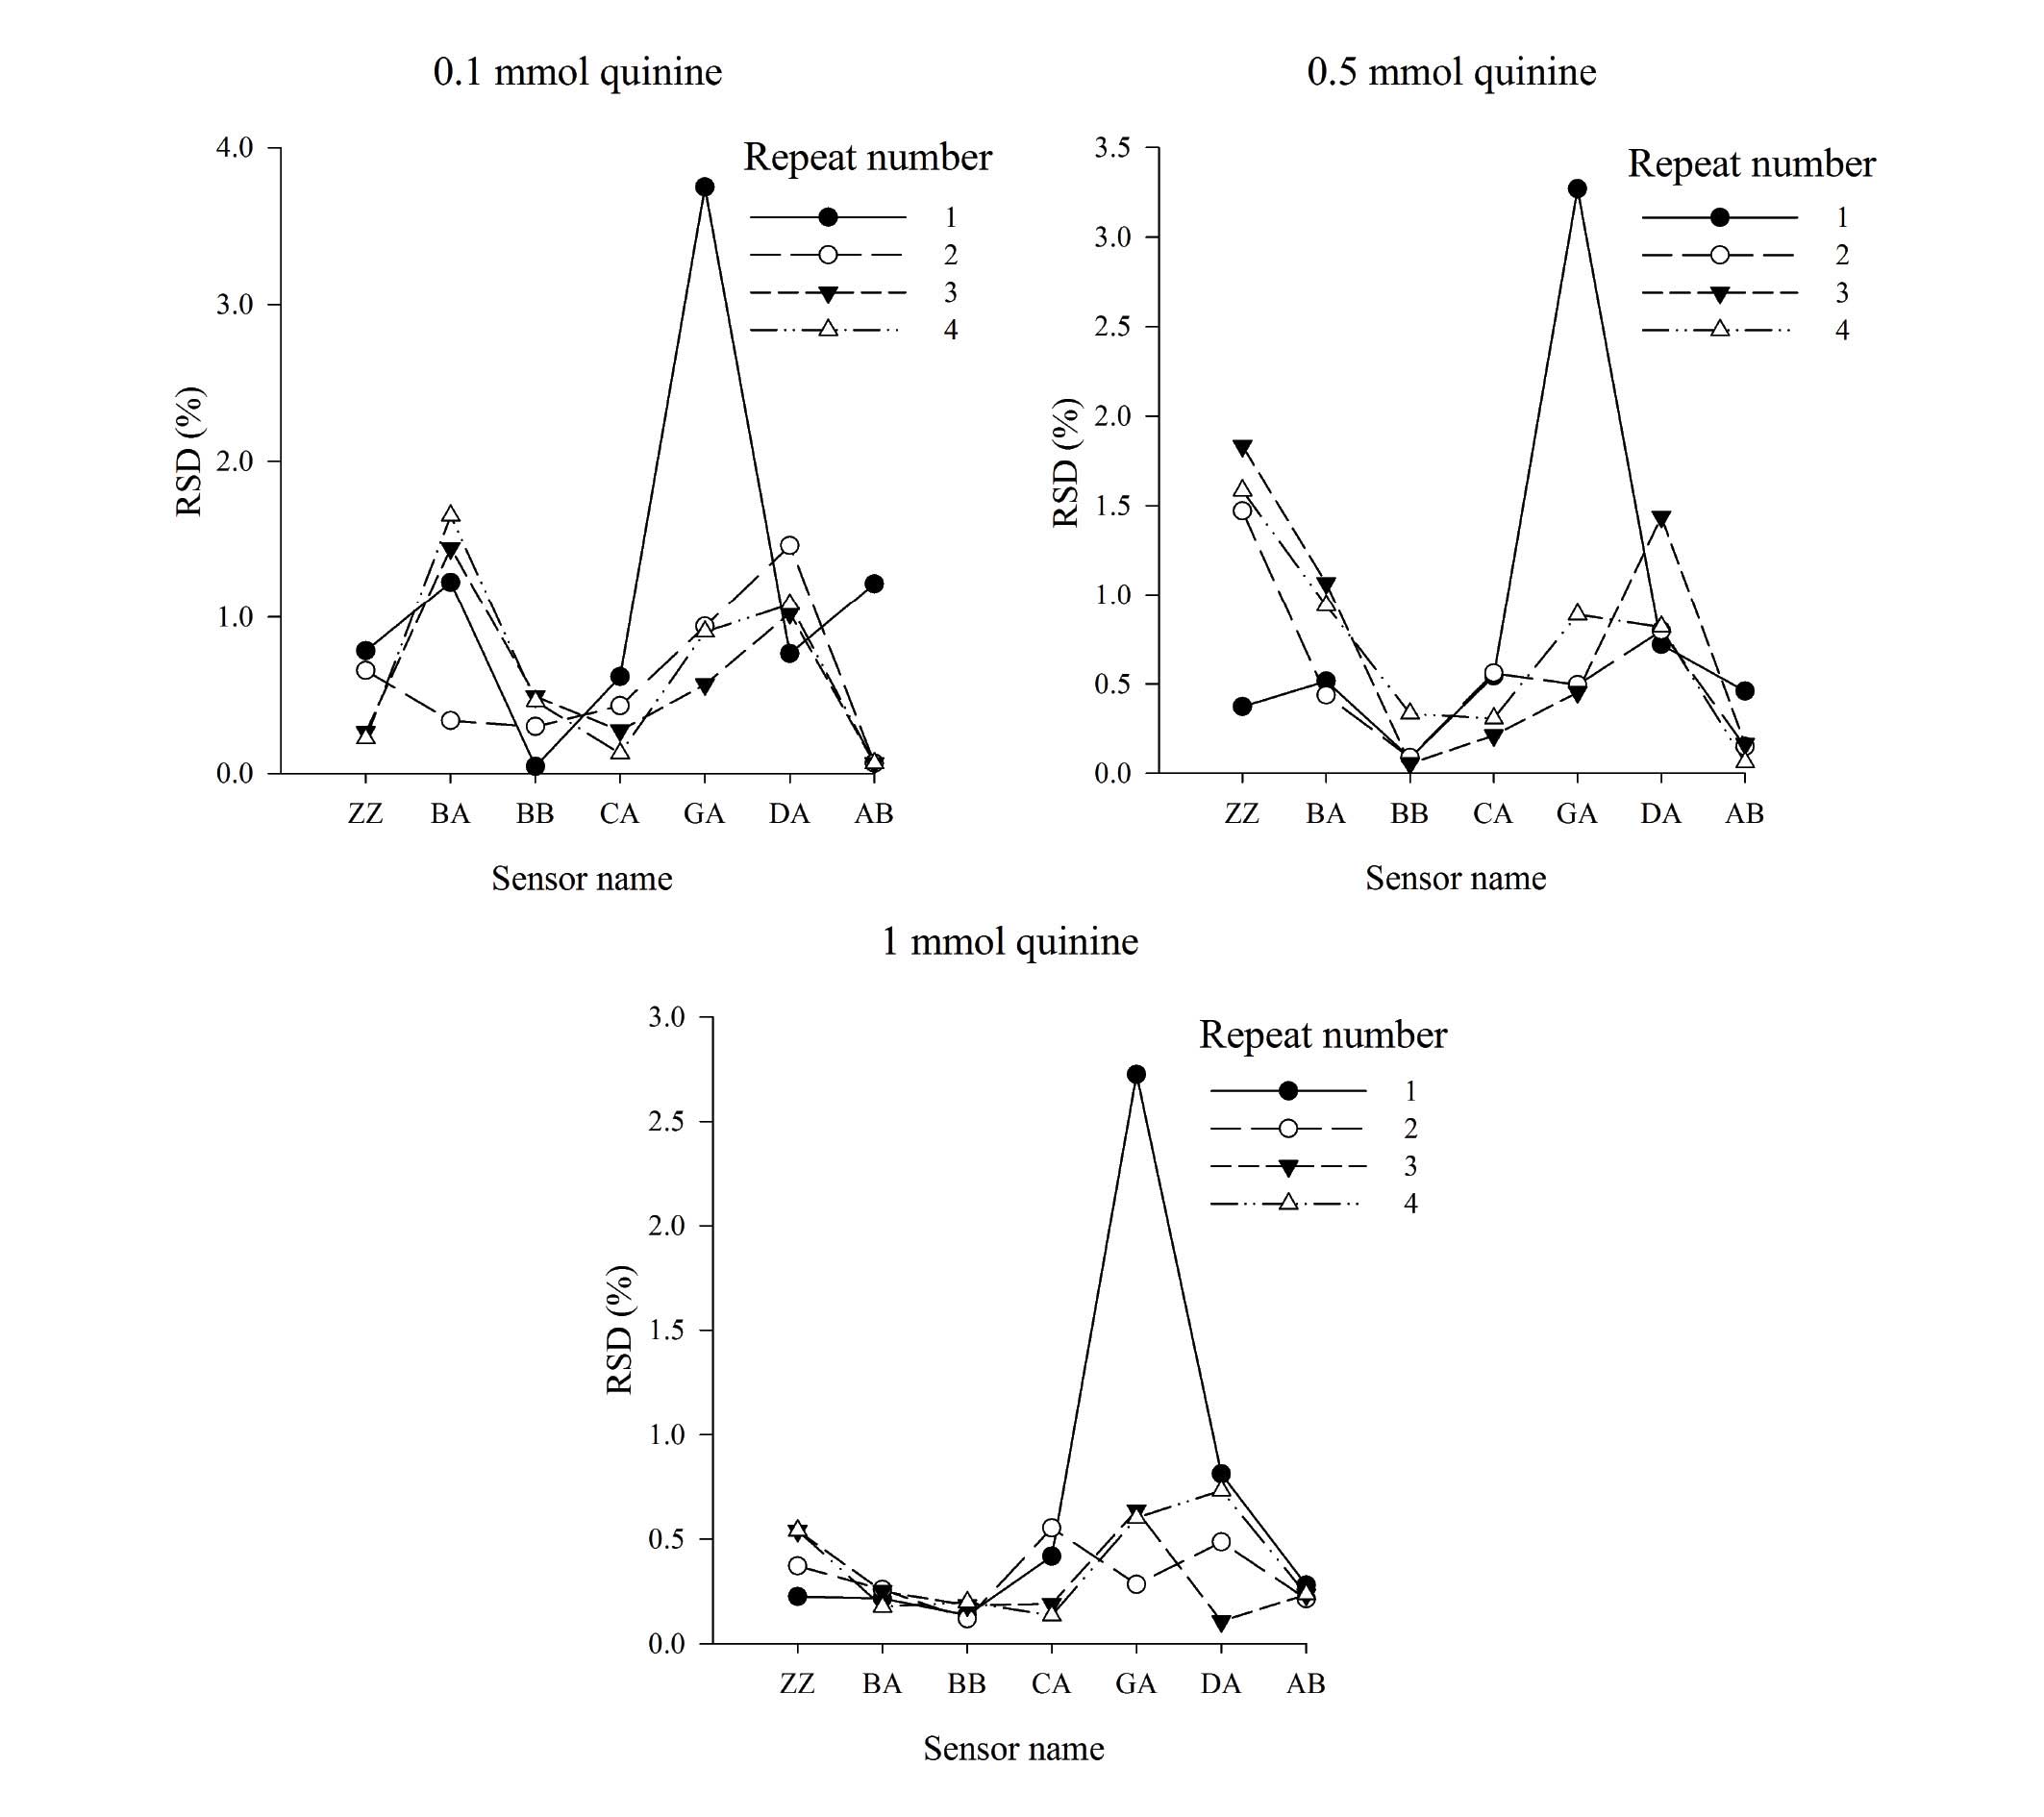
Measurement precision within a 6 h
measurement cycle
Quinine solutions at different concentrations were
measured using the E-tongue within a 6 h measurement cycle
(Fig. 6). The RSD within 6 h was
<4%, indicating that the approach was suitable for sample
analysis.
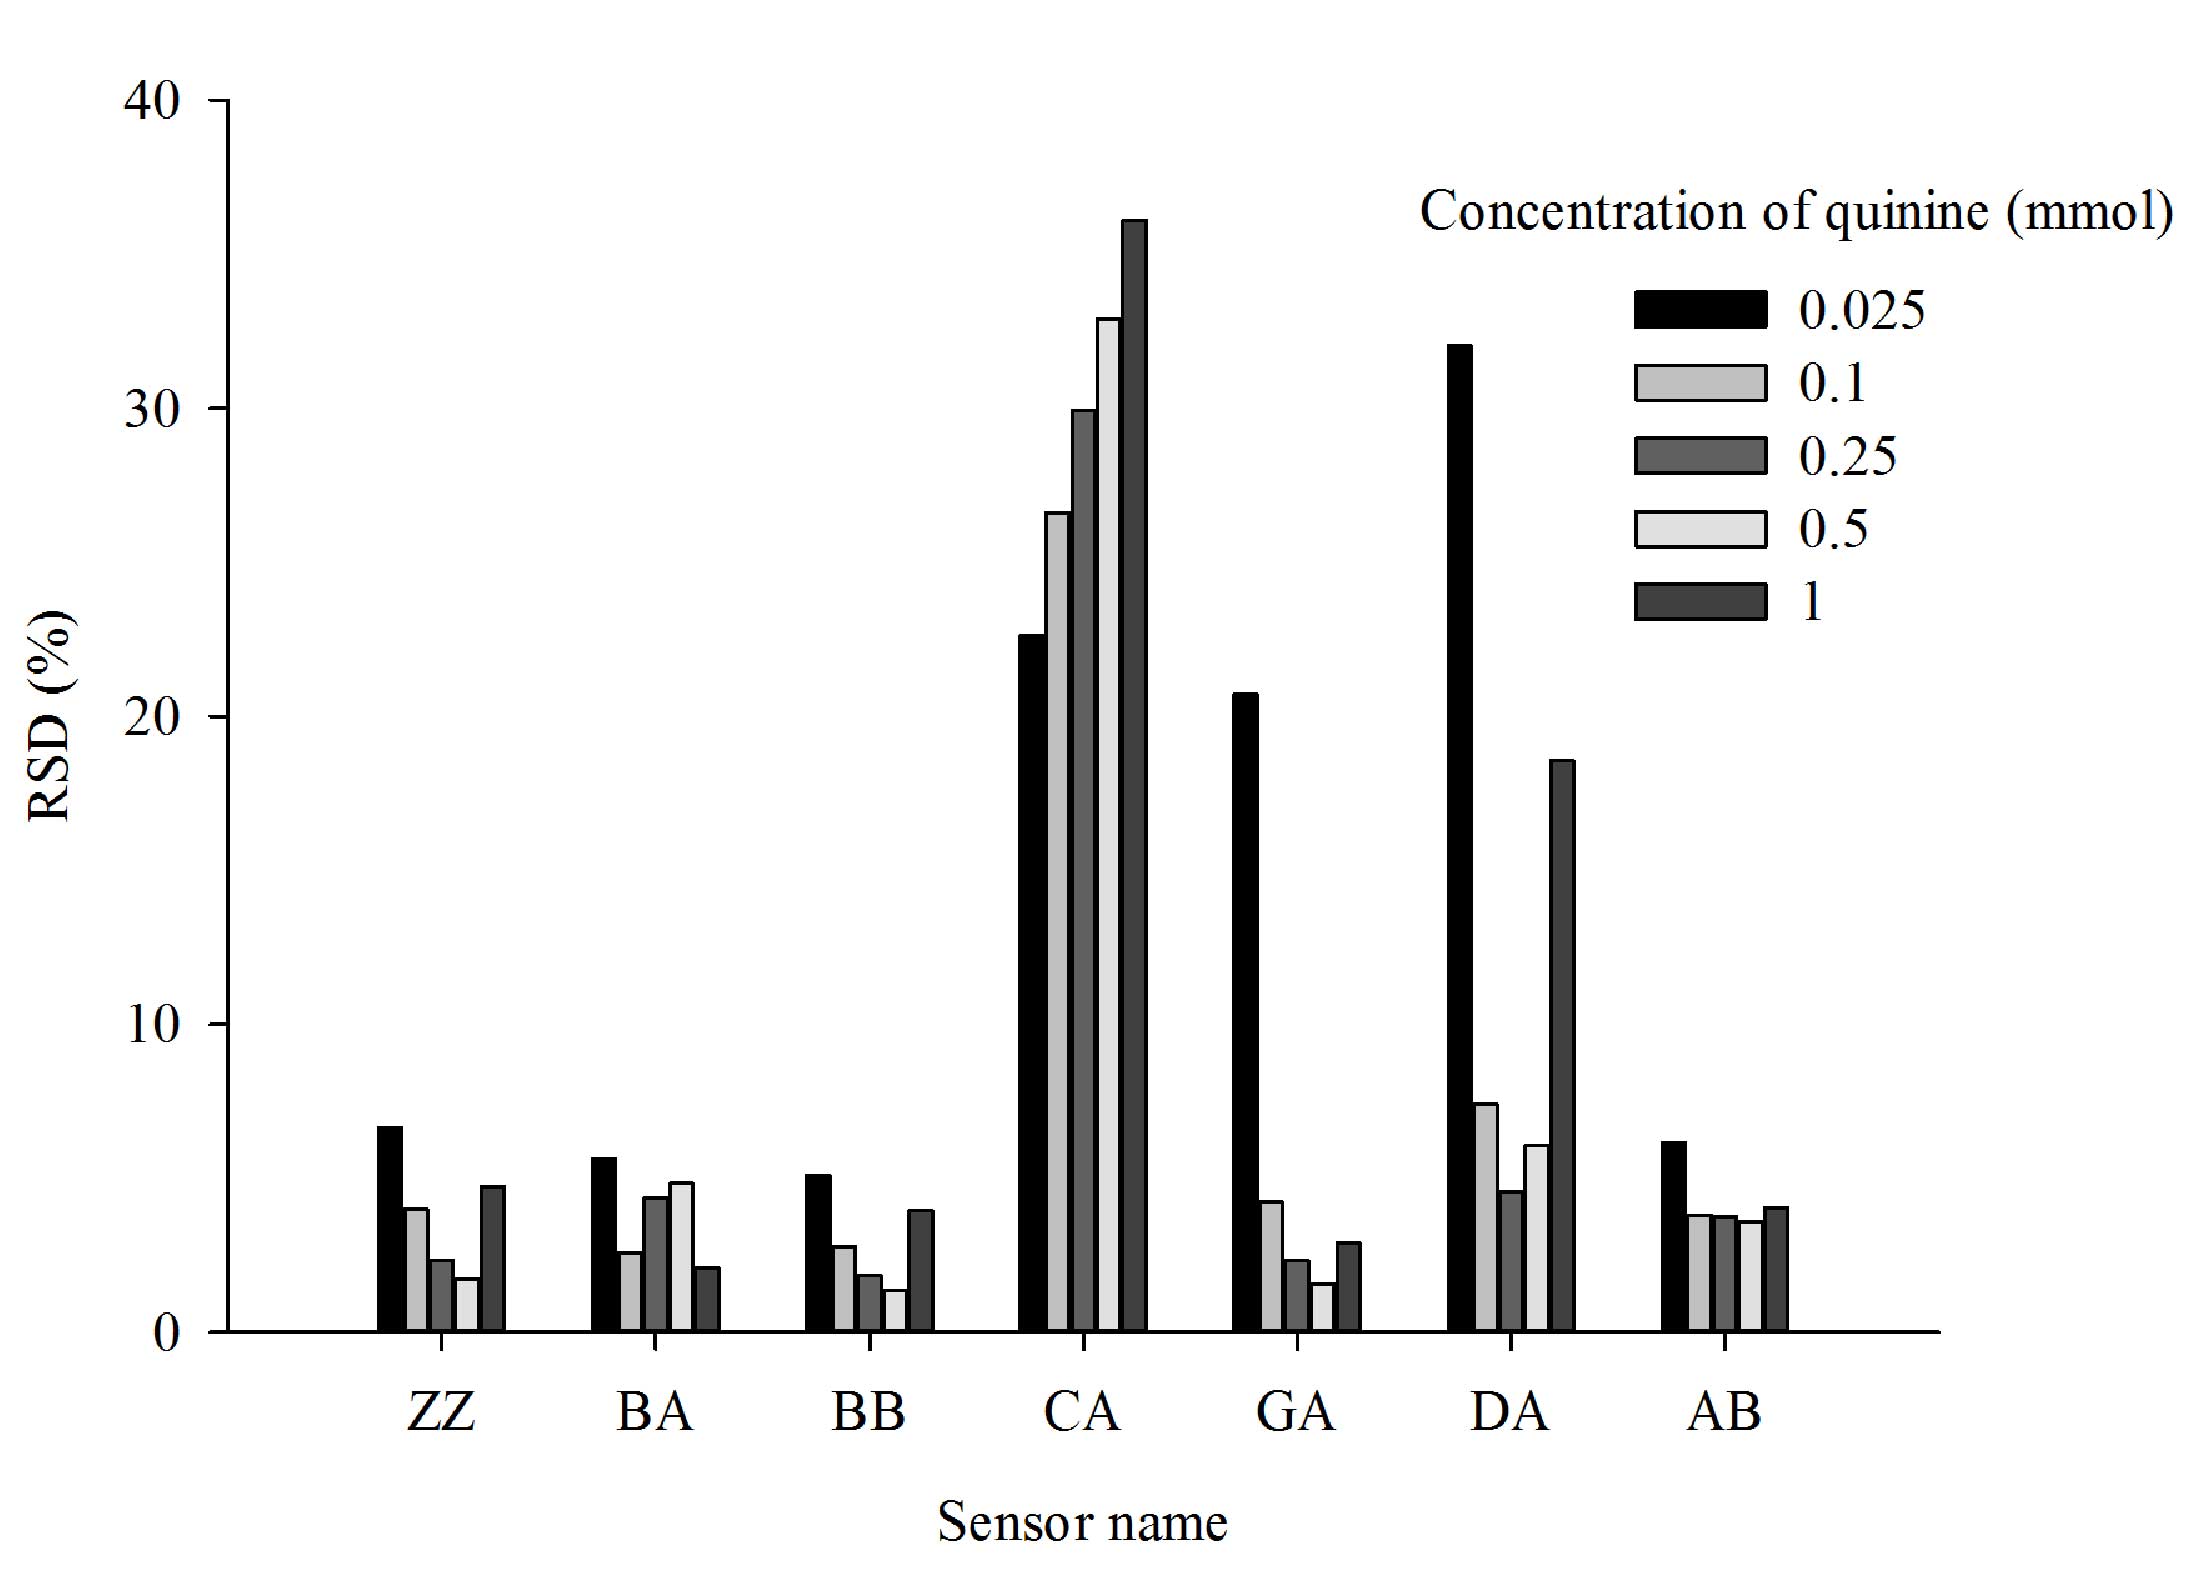
Inter-day precision of
measurements
Quinine solutions of five different concentrations
were measured using the E-tongue to evaluate the inter-day
precision of measurements (Fig. 7).
The results identified that measurements from sensors ZZ, BA, BB
and AB were relatively stable, with an RSD variation over three
days of <10%. Large variations in measurements were found for
sensors CA, GA and DA, with RSD values varying by <37%.
Therefore, subsequent measurements were taken on the same day and
in the same 6 h measurement cycle.
Analysis of the bitterness of
TCMs
In binary and tertiary classification performed with
LS-SVM, the polynomial kernel was selected following optimization.
For binary bitterness classification, all 29 samples were correctly
classified (human taste panel results), with a cross-validation
accuracy rate of 100%. For tertiary bitterness classification, 26
of the 29 samples were correctly classified, with a
cross-validation accuracy rate of 89.66%. The misclassified samples
were samples 8, 14 and 22.
In binary and tertiary classification using SVM, the
polynomial kernel was selected following optimization. For binary
classification, this approach correctly classified 28 out of 29
samples, with a cross-validation accuracy rate of 96.55%. Sample 14
was misclassified. For tertiary classification, 25 of the 29
samples were correctly classified with a cross-validation accuracy
rate of 86.21%. The misclassified samples were sample 14, 17, 22
and 23.
In binary classification of the 29 samples using DA,
26 out of 29 samples were correctly classified, with a
cross-validation accuracy rate of 89.66%. The misclassified samples
were 14, 17, and 23. For tertiary classification using DA, 26 out
of 29 samples were correctly classified, with a cross-validation
accuracy rate of 89.66%. The misclassified samples were sample 14,
17, and 22.
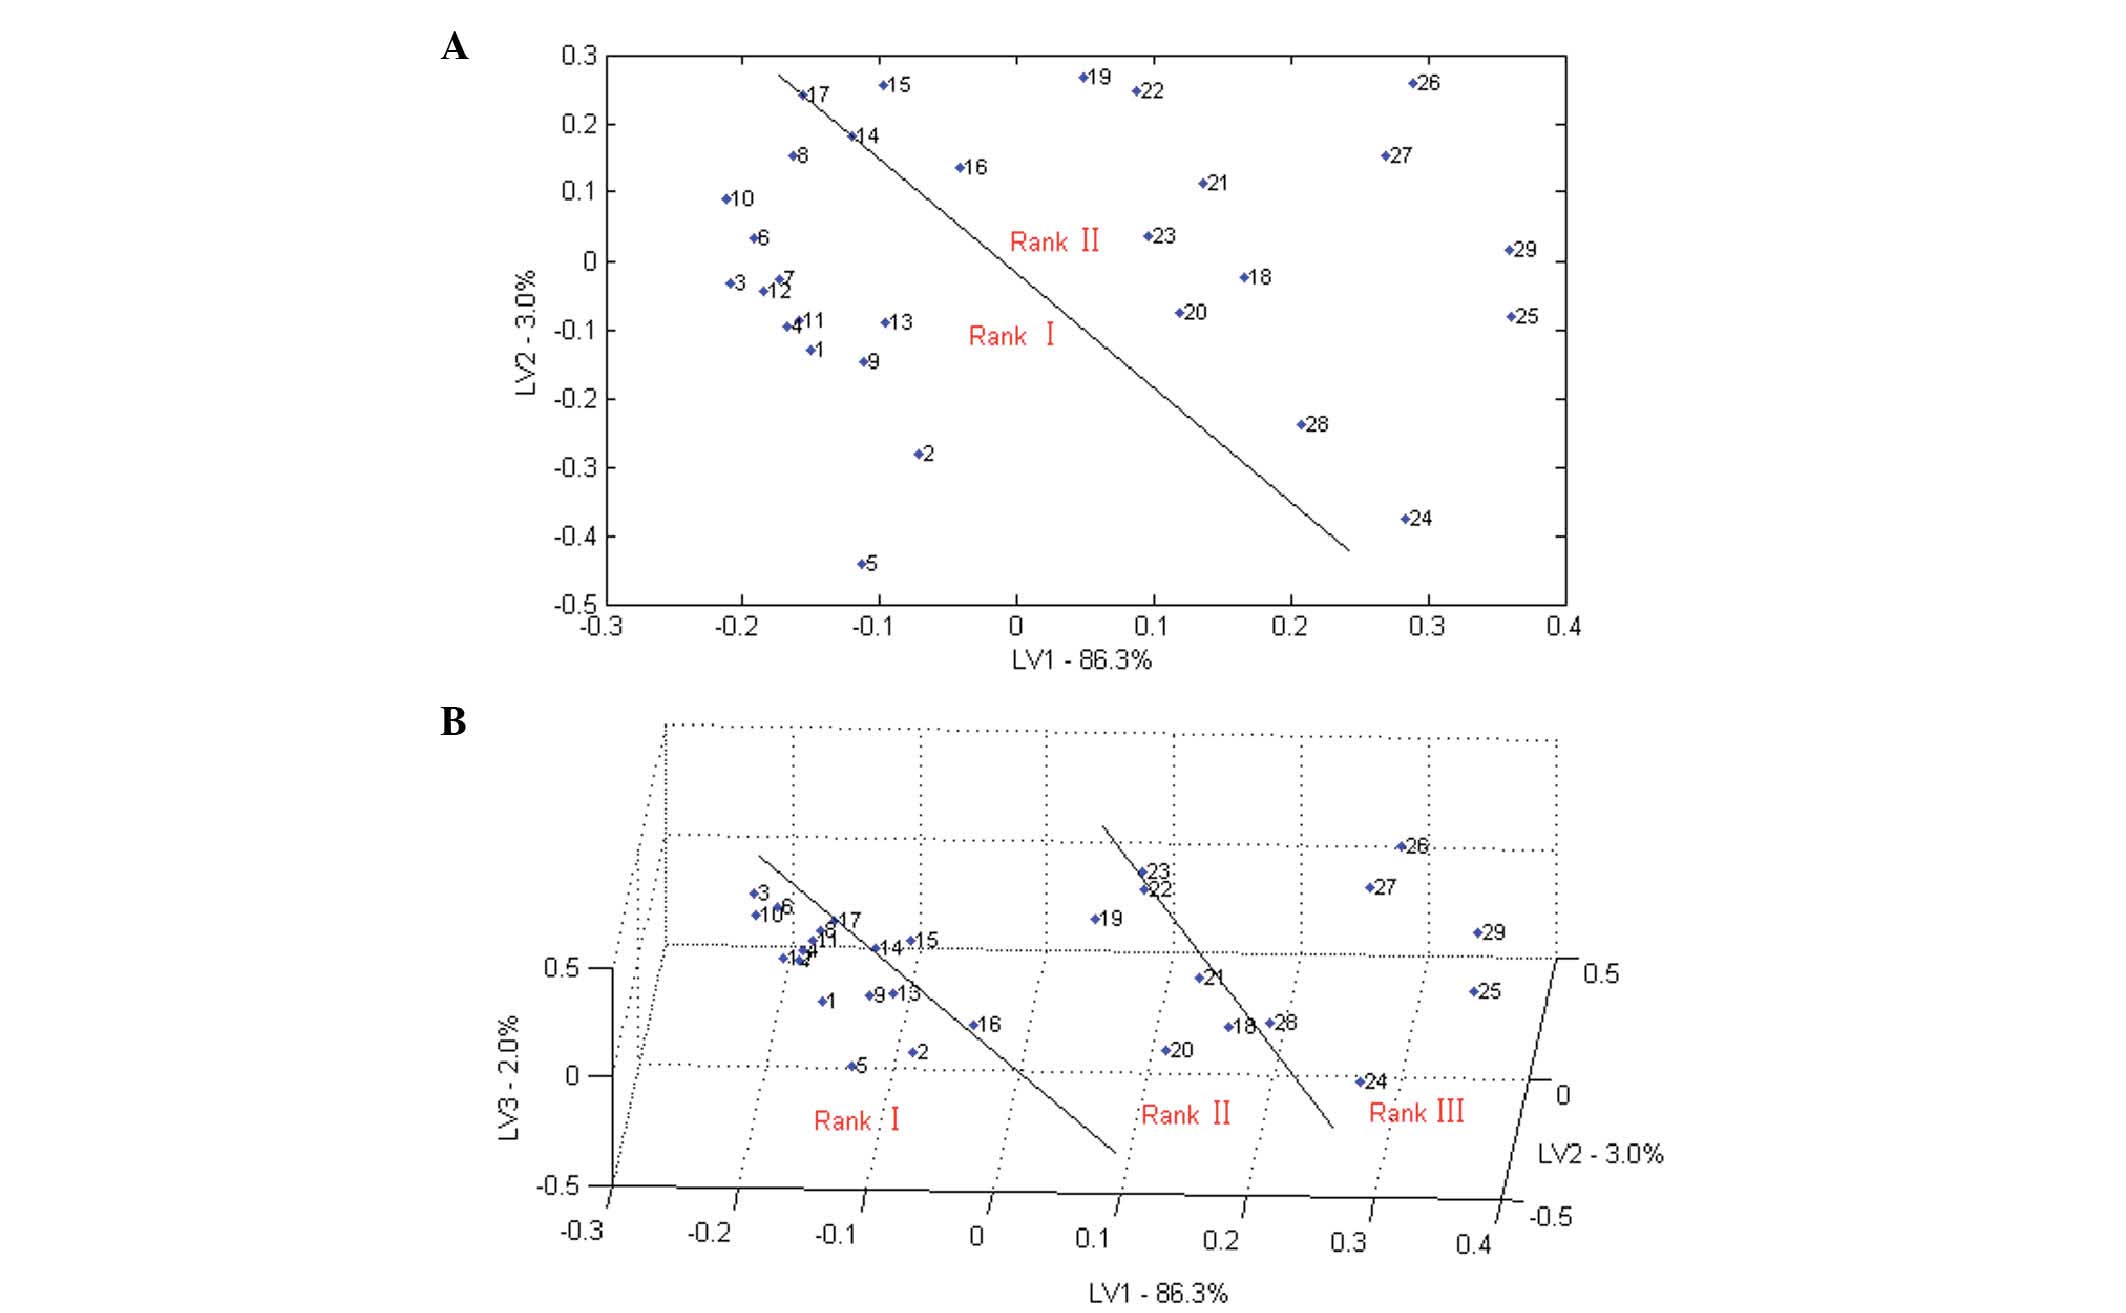
The results of two-dimensional and three-dimensional
bitterness classifications results of 29 samples based on PLS
analysis are shown in Fig. 8A and B,
respectively. The 29 samples could be grouped into two classes or
three classes. However, samples 14 and 17 were on the border of the
binary classification and samples 8, 14, 17, 22 and 23 were on the
border of the tertiary classification, so could easily be
misclassified.
In conclusion, the present study optimized the
E-tongue measurement protocol to use a 120 sec measurement
acquisition time, with 7 replicates and optimized the washing
process. The optimized washing process comprised of 6 cleans of 10
sec each. The sample solution was then measured continuously,
without cleaning in-between measurements of the same sample.
Following completion of measurements, the response values of
sensors were used for further analysis. This optimized method used
had good reproducibility and high precision within 6 h, but poor
inter-day precision. Therefore, measurements should be taken within
the same 6 h measurement cycle, rather than on different days or in
different measurement cycles.
The optimized protocol was then used to screen and
identify the bitterness intensities of 29 TCM decoctions, which
were compared to the bitterness intensities previously established
by a human taste panel. The results showed that with appropriate
data processing, the E-tongue could accurately identify the
bitterness intensity of TCM decoctions.
Acknowledgements
The present study was funded by the following
organizations: National Natural Science Foundation for Young
Scientists (grant no. 81001646); Special Program for Chinese
Medicine Research of Traditional Chinese Medicine Administration of
Henan Province (grant no. 2014ZY02066); Fundamental Research Funds
for Gifted Young Scientists at Provincial Universities by Henan
University of Traditional Chinese Medicine (Zhengzhou, China; grant
no. 2014KYYWF-YQ01); and a Collaborative Project with Jiangying
Tianjiang Pharmaceutical Co., Ltd. (Jiangyin, China; grant no.
XZ2011030042). The authors thank Professor Yuan-Ying Ni and Dr Yang
Yang (College of Food Science and Nutritional Engineering, China
Agricultural University, Beijing, China) for their guidance and
help with the E-tongue.
References
|
1
|
Gupta H, Sharma A, Kumar S and Roy SK:
E-tongue: A tool for taste evaluation. Recent Pat Drug Deliv
Formul. 4:82–89. 2010. View Article : Google Scholar : PubMed/NCBI
|
|
2
|
Ayenew Z, Puri V, Kumar L and Bansal AK:
Trends in pharmaceutical taste masking technologies: A patent
review. Recent Pat Drug Deliv Formul. 3:26–39. 2009. View Article : Google Scholar : PubMed/NCBI
|
|
3
|
Ito M, Ikehama K, Yoshida K, Haraguchi T,
Yoshida M, Wada K and Uchida T: Bitterness prediction of
H1-antihistamines and prediction of masking effects of artificial
sweeteners using an electronic tongue. Int J Pharm. 441:121–127.
2013. View Article : Google Scholar : PubMed/NCBI
|
|
4
|
Anand V, Kataria M, Kukkar V, Saharan V
and Choudhury PK: The latest trends in the taste assessment of
pharmaceuticals. Drug Discov Today. 12:257–265. 2007. View Article : Google Scholar : PubMed/NCBI
|
|
5
|
Dickinson TA, Michael KL, Kauer JS and
Walt DR: Convergent, self-encoded bead sensor arrays in the design
of an artificial nose. Anal Chem. 71:2192–2198. 1999. View Article : Google Scholar : PubMed/NCBI
|
|
6
|
Goodey A, Lavigne JJ, Savoy SM, Rodriguez
MD, Curey T, Tsao A, Simmons G, Wright J, Yoo SJ, Sohn Y, et al:
Development of multianalyte sensor arrays composed of chemically
derivatized polymeric microspheres localized in micromachined
cavities. J Am Chem Soc. 123:2559–2570. 2001. View Article : Google Scholar : PubMed/NCBI
|
|
7
|
Jokerst JV, Jacobson JW, Bhagwandin BD,
Floriano PN, Christodoulides N and McDevitt JT: Programmable
nano-bio-chip sensors: Analytical meets clinical. Anal Chem.
82:1571–1579. 2010. View Article : Google Scholar : PubMed/NCBI
|
|
8
|
Riul A Jr, Dantas CA, Miyazaki CM and
Oliveira ON Jr: Recent advances in electronic tongues. Analyst.
135:2481–2495. 2010. View Article : Google Scholar : PubMed/NCBI
|
|
9
|
Baldwin EA, Bai J, Plotto A and Dea S:
Electronic noses and tongues: Applications for the food and
pharmaceutical industries. Sensors (Basel). 11:4744–4766. 2011.
View Article : Google Scholar : PubMed/NCBI
|
|
10
|
Toko K, Hara D, Tahara Y, Yasuura M and
Ikezaki H: Relationship between the amount of bitter substances
adsorbed onto lipid/polymer membrane and the electric response of
taste sensors. Sensors (Basel). 14:16274–16286. 2014. View Article : Google Scholar : PubMed/NCBI
|
|
11
|
Polshin E, Rudnitskaya A, Kirsanov D,
Legin A, Saison D, Delvaux F, Delvaux FR, Nicolaï BM and Lammertyn
J: Talanta. 81:88–94. 2010. View Article : Google Scholar : PubMed/NCBI
|
|
12
|
Peris M and Escuder-Gilabert L: On-line
monitoring of food fermentation processes using electronic noses
and electronic tongues: A review. Anal Chim Acta. 804:29–36. 2013.
View Article : Google Scholar : PubMed/NCBI
|
|
13
|
Gutiérrez-Capitán M, Santiago JL,
Vila-Planas J, Llobera A, Boso S, Gago P, Martínez MC and
Jiménez-Jorquera C: Classification and characterization of
different white grape juices by using a hybrid electronic tongue. J
Agric Food Chem. 61:9325–9332. 2013. View Article : Google Scholar : PubMed/NCBI
|
|
14
|
Escuder-Gilabert L and Peris M: Review:
Highlights in recent applications of electronic tongues in food
analysis. Anal Chim Acta. 665:15–25. 2010. View Article : Google Scholar : PubMed/NCBI
|
|
15
|
Apetrei C, Apetrei IM, Villanueva S, de
Saja JA, Gutierrez-Rosales F and Rodriguez-Mendez ML: Combination
of an e-nose, an e-tongue and an e-eye for the characterisation of
olive oils with different degree of bitterness. Anal Chim Acta.
663:91–97. 2010. View Article : Google Scholar : PubMed/NCBI
|
|
16
|
Major N, Marković K, Krpan M, Sarić G,
Hruškar M and Vahčić N: Rapid honey characterization and botanical
classification by an electronic tongue. Talanta. 85:569–574. 2011.
View Article : Google Scholar : PubMed/NCBI
|
|
17
|
Cetó X, Gutiérrez-Capitán M, Calvo D and
del Valle M: Beer classification by means of a potentiometric
electronic tongue. Food Chem. 141:2533–2540. 2013. View Article : Google Scholar : PubMed/NCBI
|
|
18
|
Söderström C, Borén H, Winquist F and
Krantz-Rülcker C: Use of an electronic tongue to analyze mold
growth in liquid media. Int J Food Microbiol. 83:253–261. 2003.
View Article : Google Scholar : PubMed/NCBI
|
|
19
|
Zhao G, Lin X, Dou W, Tian S, Deng S and
Shi J: Use of the smart tongue to monitor mold growth and
discriminate between four mold species grown in liquid media. Anal
Chim Acta. 690:240–247. 2011. View Article : Google Scholar : PubMed/NCBI
|
|
20
|
Woertz K, Tissen C, Kleinebudde P and
Breitkreutz J: A comparative study on two electronic tongues for
pharmaceutical formulation development. J Pharm Biomed Anal.
55:272–281. 2011. View Article : Google Scholar : PubMed/NCBI
|
|
21
|
Harada T, Uchida T, Yoshida M, Kobayashi
Y, Narazaki R and Ohwaki T: A new method for evaluating the
bitterness of medicines in development using a taste sensor and a
disintegration testing apparatus. Chem Pharm Bull (Tokyo).
58:1009–1014. 2010. View Article : Google Scholar : PubMed/NCBI
|
|
22
|
Lorenz JK, Reo JP, Hendl O, Worthington JH
and Petrossian VD: Evaluation of a taste sensor instrument
(electronic tongue) for use in formulation development. Int J
Pharm. 367:65–72. 2009. View Article : Google Scholar : PubMed/NCBI
|
|
23
|
Zheng JY and Keeney MP: Taste masking
analysis in pharmaceutical formulation development using an
electronic tongue. Int J Pharm. 310:118–124. 2006. View Article : Google Scholar : PubMed/NCBI
|
|
24
|
Rachid O, Simons FE, Rawas-Qalaji M and
Simons KJ: An electronic tongue: Evaluation of the masking efficacy
of sweetening and/or flavoring agents on the bitter taste of
epinephrine. AAPS PharmSciTech. 11:550–557. 2010. View Article : Google Scholar : PubMed/NCBI
|
|
25
|
Tanigake A, Miyanaga Y, Nakamura T, Tsuji
E, Matsuyama K, Kunitomo M and Uchida T: The bitterness intensity
of clarithromycin evaluated by a taste sensor. Chem Pharm Bull
(Tokyo). 51:1241–1245. 2003. View Article : Google Scholar : PubMed/NCBI
|
|
26
|
Li L, Naini V and Ahmed SU: Utilization of
a modified special-cubic design and an electronic tongue for
bitterness masking formulation optimization. J Pharm Sci.
96:2723–2734. 2007. View Article : Google Scholar : PubMed/NCBI
|
|
27
|
Haraguchi T, Uchida T, Hazekawa M, Yoshida
M, Nakashima M, Sanda H, Hase T and Tomoda Y: Ability of food/drink
to reduce the bitterness intensity of topiramate as determined by
taste sensor analysis. Chem Pharm Bull (Tokyo). 64:14–20. 2016.
View Article : Google Scholar : PubMed/NCBI
|
|
28
|
Yaroshenko I, Kirsanov D, Kartsova L,
Sidorova A, Sun Q, Wan H, He Y, Wang P and Legin A: Exploring
bitterness of traditional Chinese medicine samples by
potentiometric electronic tongue and by capillary electrophoresis
and liquid chromatography coupled to UV detection. Talanta.
152:105–111. 2016. View Article : Google Scholar : PubMed/NCBI
|
|
29
|
Pharmacopoeia of the People's Republic of
China 2010. 8th. I. China Medical Science and Technology Press;
Beijing: 2010
|
|
30
|
Liu R, Zhang X, Zhang L, Gao X, Li H, Shi
J and Li X: Bitterness intensity prediction of berberine
hydrochloride using an electronic tongue and a GA-BP neural
network. Exp Ther Med. 7:1696–1702. 2014.PubMed/NCBI
|
|
31
|
Shi J, Zhang X, Qiu J, Li X and Liu R:
Investigation of bitter masking mechanism of β-cyclodextrin to
several traditional Chinese medicines. Zhong Guo Shi Yan Fang Ji
Xue Za Zhi. 19:1–4. 2013.(In Chinese).
|
|
32
|
Li X, Wu Z, Liu R, Xu Z, Shi J and Li H:
Study on bitterness evaluation of Chinese herbal decoction by
THTPM. Zhong Guo Shi Yan Fang Ji Xue Za Zhi. 17:11–13. 2011.(In
Chinese).
|
|
33
|
Verboven S and Hubert M: Matlab library
LIBRA. Wiley Interdisciplinary Reviews: Computational Statistics.
2:509–515. 2010. View
Article : Google Scholar
|
|
34
|
Verboven S and Hubert M: LIBRA: A MATLAB
library for robust analysis. Chemometr Intell Lab Syst. 75:127–136.
2005. View Article : Google Scholar
|
|
35
|
Lin Z, Zhang Q, Liu R, Gao X, Zhang L,
Kang B, Shi J, Wu Z, Gui X and Li X: Evaluation of the bitterness
of traditional Chinese medicines using an E-tongue coupled with a
robust partial least squares regression method. Sensors (Basel).
16:1512016. View Article : Google Scholar : PubMed/NCBI
|
|
36
|
Newman J, Egan T, Harbourne N, O'Riordan
D, Jacquier JC and O'Sullivan M: Correlation of sensory bitterness
in dairy protein hydrolysates: Comparison of prediction models
built using sensory, chromatographic and electronic tongue data.
Talanta. 126:46–53. 2014. View Article : Google Scholar : PubMed/NCBI
|
|
37
|
Kuligowski J, Pérez-Guaita D and Quintás
G: Application of discriminant analysis and cross-validation on
proteomics data. Methods Mol Biol. 1362:175–184. 2016. View Article : Google Scholar : PubMed/NCBI
|