Introduction
Hepatitis C virus (HCV) infection affects 2–3% of
the worldwide population, and it is estimated that the number of
infected individuals in China is ~29.8 million (1,2).
Sustained HCV infection is associated with liver inflammation and
can cause liver injury (3). Hepatic
fibrosis is a reversible wound-healing response to acute and
chronic liver injury. If the liver inflammation is persistent,
chronic HCV patients are at risk of increased liver fibrosis
progression (4). In ~80% of patients
with HCV infection, chronic infections will develop that gradually
progress into liver fibrosis, cirrhosis and potentially primary
hepatocellular carcinoma (5–7).
The association between serum HCV load and hepatic
injury, such as inflammation and fibrosis, has been extensively
studied (7–9). The serum HCV load prior to antiviral
therapy is an important parameter for evaluating the clinical
outcomes of antiviral therapy (10,11).
Liver parenchyma cells, which are the major component of livers,
are the site at which active viral replication occurs. As hepatic
fibrosis progresses, the liver parenchyma cell volume decreases and
can cause changes in viral loads. Previous studies have reported
that the severity of hepatic injury is not consistent with the
serum HCV load in HCV-infected patients (12,13).
Therefore, it can be hypothesized that hepatic injury is associated
with the HCV load in the parenchyma cells of HCV-infected
patients.
There is a lack of research on the association
between liver parenchyma viral loads and hepatic injury in
HCV-infected patients. Therefore, the present study was designed to
investigate the association between hepatic injury and liver
parenchyma cell HCV load, thereby providing direction for the
diagnosis and treatment of HCV infection.
Patients and methods
Patients
A total of 56 HCV-infected patients, including 35
males (62.5%) and 21 females (37.5%), were recruited into this
retrospective study from the Third Affiliated Hospital of Sun
Yat-Sen University (Guangzhou, China) between January 2008 and
December 2011. The average age of the patients was 42.98 years (age
range, 17–68 years). None of the patients had super- or
co-infections of the hepatitis A, B, D or E virus, or the human
immunodeficiency virus. No patients received anti-viral therapy
prior to the study. In addition, pregnant women and patients with
liver cancer, hepatic cysts, hepatic hemangiomas, drug-induced
hepatitis, Wilson's disease, autoimmune liver diseases or alcoholic
liver disease were excluded from the present study. According to
the liver inflammation grades, patients were divided into four
groups: G1 (slight inflammation); G2 (moderate inflammation); G3
(severe inflammation); and G4 (highly severe inflammation).
According to the different liver fibrosis stages, patients were
divided into five groups: S0 (no fibrosis); S1 (slight fibrosis);
S2 (moderate fibrosis); S3 (severe fibrosis); and S4 (highly severe
fibrosis). The histopathologic diagnosis of liver tissue was based
on the grading system recommended by a previous study (14), which is based on the grading systems
described by Ishak et al (15) and Desmet et al (16), and is currently commonly used in
China. This is a semi-quantitative scoring system that evaluates
the stage based on the distribution changes of hepatic fibrosis,
the lobular structure of the liver and the formation of false
lobules. Liver biopsies were conducted between January 2008 and
December 2011 at the Third Affiliated Hospital of Sun Yat-Sen
University.
Detection of hepatitis virus markers
and liver biopsy
The serum levels of a number of hepatitis virus
markers (including HCV-IgG and HCV-IgM) were determined using
specific enzyme-linked immunosorbent assay (ELISA) kits according
to the manufacturer's instructions (Thermo Fisher Scientific, Inc.,
Waltham, MA, USA). The mRNA level of HCV was evaluated using a
fluorogenic quantitative polymerase chain reaction diagnostic kit
(DaAn Gene, Co., Ltd., Guangzhou, China) with a minimal detection
level of 1,000 IU/ml, according to the standard manufacturer's
protocol.
The liver biopsy was performed using a 16-gauge,
color Doppler-guided (AU4; Esaote, Genoa, Italy) needle technique.
Hepatic specimens were fixed in Bouin's solution (Shanghai Gefan
Biotechnology, Co., Ltd., Shanghai, China), embedded in paraffin,
sectioned and then stained with hematoxylin-eosin (H&E) in
order to view the cellular morphology. The reticular fibers were
stained with H&E to clearly identify the fibrotic cells. The
specimens with reticular staining were examined using a DMI4000 B
inverted fluorescence microscope (Leica Microsystems, Wetzlar,
Germany) and analyzed using Image-Pro Plus version 6.0 (Media
Cybernetics, Inc., Rockville, MD, USA). Each specimen was examined
at ×200 magnification and 5 random fields were imaged to determine
the proportion of fibrotic cells. The different stages were then
classified as follows: S0, <5% fibrotic cells; S1, 5–25%; S2,
25–50%; S3, 50%-75%; and S4, >75%.
Calculation of hepatic parenchyma cell
volume
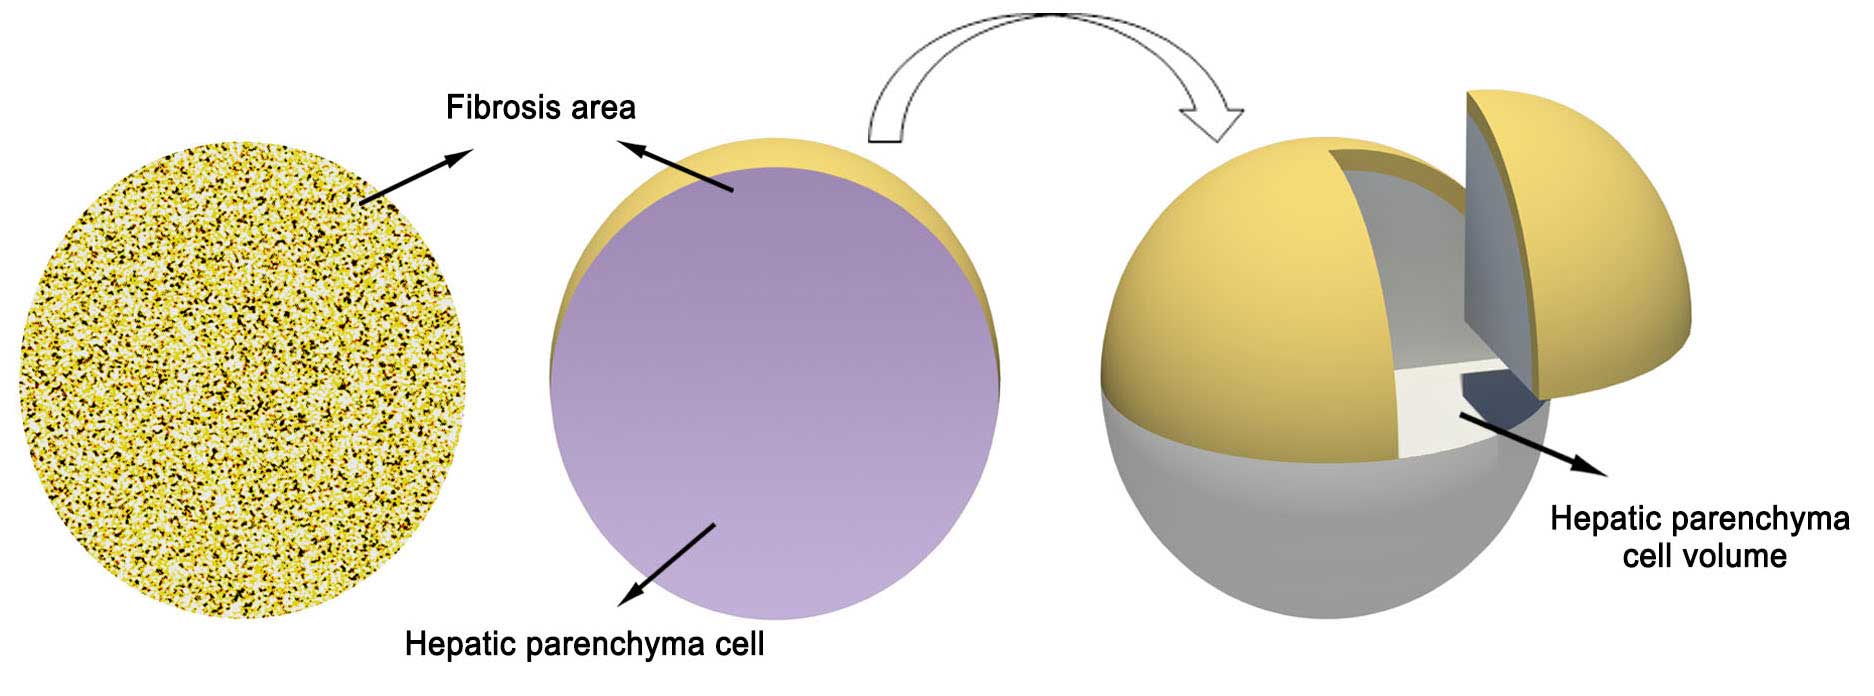
The calculation of hepatic parenchyma cell volume is
presented in Fig. 1. The proportion
of fibrotic cells was analyzed by Image-Pro Plus version 6.0
software. A single circular microscopic field was identified as
100% of the liver tissue. The proportion of hepatic parenchyma cell
was calculated as follows: Hepatic parenchyma cell (%) = 100% -
(proportion of fibrotic cells with different stages) (17). As shown in Fig. 1, a view of 100% round area stands for
the entire live tissue consisting of fibrotic cells (yellow) and
hepatic parenchyma cells (gray).
Rotation of the circular area for 360° formed a
sphere, in which the overall sphere volume represented the fibrotic
volume plus the parenchyma cell volume. The non-fibrotic proportion
of the hepatic volume could then be calculated using the formulae
for the area of a circle and the volume of a sphere. The formula
for the area of a circle is A = πr2, where r is the
radius of the circle and A is the area; therefore, r = √(A/π). The
volume of a sphere is A = (4/3)πr3. These formulas
allowed the determination of the hepatic parenchyma cell volume at
different stages of hepatic fibrosis (18). The HCV load in hepatic parenchymal
cells in each specimen was determined by dividing the serum HCV RNA
level by the hepatic parenchyma cell volume.
Statistical analysis
The area and volume ratio for hepatic parenchyma
cells and the viral load in parenchyma cells was calculated using
Excel 2007 (Microsoft Corp., Redmond, WA, USA). SPSS version 17.0
(SPSS, Inc., Chicago, IL, USA) was used to perform statistical
analyses. The normally distributed data are presented as the mean ±
standard deviation. An independent sample t-test (for normally
distributed data) or a rank-sum test (for non-normally distributed
data) was used to compare data between groups. The differences
among multiple groups were analyzed using one-way analysis of
variance (ANOVA) and the least significant difference test.
Pearson's correlation coefficient and Spearman's rank correlation
coefficient were used for correlation analyses. P<0.05 was
considered to indicate a statistically significant difference.
Results
Hepatic inflammation and fibrosis
grading of chronic HCV infected patients
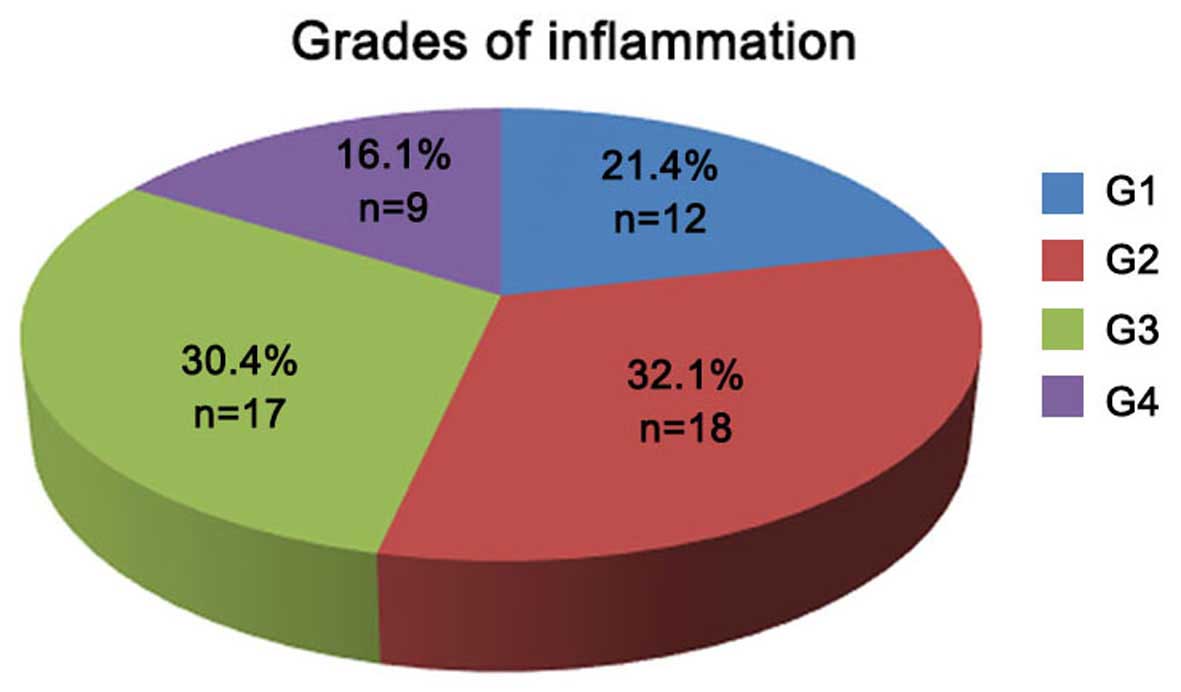
The 56 HCV-infected patients were divided into
groups according to the severity of hepatic inflammation and
fibrosis (as indicated by the different grades and stages,
respectively). As shown in Fig. 2, a
total of 12 (21.4%), 18 (32.1%), 17 (30.4%) and 9 (16.1%) patients
exhibited liver inflammation of grades G1, G2, G3 and G4,
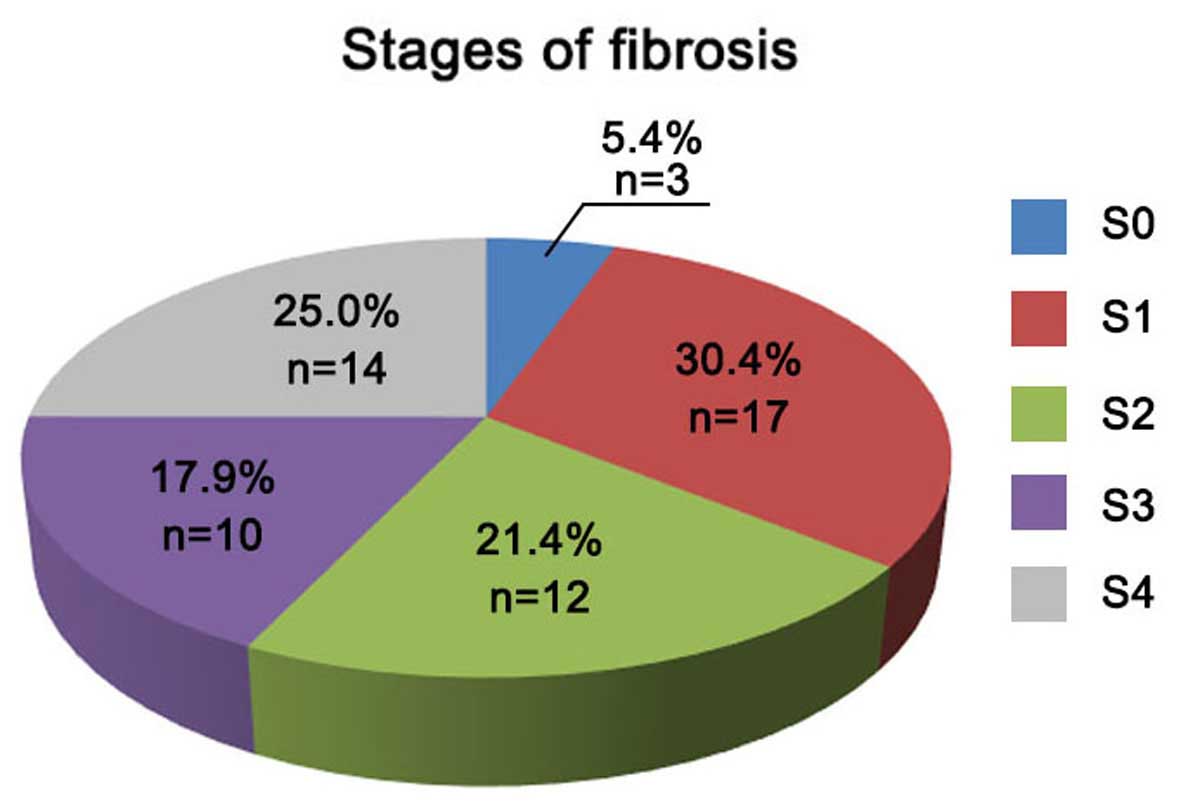
respectively. According to the liver fibrosis scoring system shown
in Fig. 3, the number of patients
with fibrosis stage S0, S1, S2, S3 and S4 were 3 (5.4%), 17
(30.4%), 12 (21.4%), 10 (17.9%) and 14 (25%) patients,
respectively, within the total of 56 chronic HCV infected patients
(Fig. 3).
Association of HCV load with the
different liver inflammation grade and fibrosis stage
In order to investigate the association of HCV load
with the hepatic injury, a pairwise comparison of the HCV load in
the serum or hepatic parenchyma cell volume with the different
inflammation grades was conducted. As shown in Table I, no significant difference in the
mean serum levels of HCV RNA was identified among the various
inflammation grade groups based on a pairwise comparison analysis
(F=0.904, P>0.05). Similarly, no significant difference between
the viral loads and hepatic parenchyma cell volume was identified
among the different inflammation grade groups, with the exception
of groups G1 and G4 (F=1.453, P>0.05; Table I). By contrast, when assessing the
correlation between HCV load and different liver fibrosis grades,
significant differences in the HCV load in the hepatic parenchyma
cell volume were identified among different groups of fibrosis
grades (F=2.860, P<0.05; Table
II). Statistically significant differences existed between
patients with stages S0 and S4, stages S2 and S3, or stages S2 and
S4 (F=2.670, all P<0.05).
 | Table I.Pairwise comparison between HCV RNA
load in the serum or hepatic parenchyma cell volume and the
inflammation grade (G1-G4) in HCV-infected patients. |
Table I.
Pairwise comparison between HCV RNA
load in the serum or hepatic parenchyma cell volume and the
inflammation grade (G1-G4) in HCV-infected patients.
| Grade | HCV level
(serum)a | HCV level
(parenchyma)b |
|---|
| G1 | 5.299±1.527 | 5.461±1.506 |
| G2 | 5.661±1.343 | 5.854±1.319 |
| G3 | 5.408±1.123 | 5.740±1.140 |
| G4 | 6.164±1.234 |
6.610±1.158c |
| Table II.Pairwise comparison between the HCV
RNA load in the serum and hepatic parenchyma cell volume and the
fibrosis stage (S0-S4) in HCV-infected patients. |
Table II.
Pairwise comparison between the HCV
RNA load in the serum and hepatic parenchyma cell volume and the
fibrosis stage (S0-S4) in HCV-infected patients.
| Stage | HCV level
(serum)a | HCV level
(parenchyma)b |
|---|
| S0 | 4.511±2.044 |
4.702±1.968c |
| S1 | 5.833±1.025 | 5.983±1.026 |
| S2 | 4.844±1.580 |
5.066±1.566c,d |
| S3 | 5.793±1.073 | 6.145±1.022 |
| S4 | 6.013±1.118 | 6.422±1.081 |
In order to analyze whether the HCV load is
correlated with inflammation grade and fibrosis stage, univariate
and multivariate analyses were then performed. The results
demonstrated that the grade of inflammation and the stage of
fibrosis were not significantly associated with the serum level of
HCV RNA, as shown in Table III.
However, fibrosis stages may affect HCV load in hepatic parenchyma
cell unit volume in hepatic parenchyma cells (F=2.670, P<0.05;
Table III). In addition, a
positive correlation between inflammation grade and fibrosis stage
was identified using Pearson's correlation analysis (r=0.870,
P<0.001; data not shown).
| Table III.Statistical analysis of the
inflammation grade and fibrosis stage correlation with HCV
load. |
Table III.
Statistical analysis of the
inflammation grade and fibrosis stage correlation with HCV
load.
|
| Serum HCV | Parenchyma HCV |
|---|
|
|
|
|
|---|
| Parameter | F-value | P-value | F-value | P-value |
|---|
| Grade | 1.366 | 0.268 | 1.292 | 0.289 |
| Stage | 2.218 | 0.086 | 2.670 | 0.044 |
Discussion
Previous studies have reported that the progress and
prognosis of HCV infection are associated with age, gender, body
mass index, virus genotype, HCV load, aminotransferase level,
disorder of fat metabolism and a number of other factors (19). In addition, a number of studies have
identified that the serum load of HCV is associated with the degree
of hepatic injury (20,21). Furthermore, a high viral load has
been demonstrated to be associated with infection progression
(8). However, Anand and Velez
(22) reported that serum HCV load
was not associated with hepatic injury. In addition, other studies
have suggested that a patient's immune condition and the efficacy
of therapeutics are influenced by integrated factors such as
hepatic fibrosis grade, virus genotype, viral load, age and
complications (23–26). Thus, the majority of studies have
demonstrated that serum HCV load is not associated with the degree
of histopathological changes in the liver of HCV-infected patients
(20).
The results of the present study suggest that the
pathologic injury caused by chronic HCV infection is more greatly
reflected by severe hepatic fibrosis rather than by hepatic
inflammation. In addition, a positive correlation between the
inflammation grade and stage of fibrosis was detected, suggesting
that the gradual progress of hepatic fibrosis is associated with
increased hepatic inflammation (27). However, no correlation was observed
between hepatic injury and serum HCV load. A previous study
demonstrated that as fibrosis progresses (from grade S1 to S4), the
hepatic parenchyma cell volume decreases with the number of hepatic
parenchyma cells in which HCV is replicating (28), thereby impacting the serum HCV load.
Therefore, it can be concluded that the serum HCV load reflects the
total virus replication; however, serum HCV does not reflect the
replication activity of HCV in hepatic cells.
In the present study, it was demonstrated that the
HCV load in hepatic parenchyma cell volume is an appropriate index
for identifying active HCV replication. A significant difference in
the HCV load in parenchyma cells was observed between patients with
G1 and G4 inflammation grades when the HCV load to parenchyma cell
volume was examined. Therefore, HCV replication may be an important
factor in inducing hepatic inflammation. However, according to the
univariate multifactor ANOVA, the hepatic inflammation grade was
not found to be associated with the HCV load in hepatic parenchyma
cells (P>0.05).
The conflicting results in the current study may be
explained by a number of factors. The present study was a
cross-sectional study, thus hepatic inflammation identified in the
biopsy specimen may not be consistent with the general severity of
liver injury. HCV escapes host immunity through high levels of
viral variations, pantropic distribution and weak immunogenicity
that lead to chronic infection and indefinite inflammation. In
addition, hepatic fibrosis may progress to cirrhosis, resulting
from long-term inflammation. The direct influence of HCV infection
and host immunity-mediated hepatic injury triggered by HCV
infection are involved in HCV pathogenesis. The host
immunity-mediated hepatic injury is mainly induced by the
cytotoxicity of HCV-specific cytotoxic T lymphocytes and
non-cytotoxic dissolution mediated by inflammation. Thus, hepatic
inflammation may be the result of active virus replication or host
immunity-mediated hepatic injury (20). A previous study demonstrated that
autoimmune reactions and the secondary onset of immune injury are
primarily associated with hepatic injury resulting from HCV
infection (29). Thus, the severity
of hepatic inflammation may not be consistent with the serum HCV
load in patients with chronic HCV infection.
In conclusion, correlation analysis in the present
study identified a significant difference between the HCV load in
parenchyma cells and hepatic fibrosis grades (groups S0 and S4, S2
and S3, and S2 and S4; P<0.05). In addition, multi-factor
analysis suggested that the hepatic fibrosis grade was associated
with HCV load in parenchyma cells (F=2.670, P<0.05). According
to the results, it can be concluded that an increased HCV load in
parenchymal cells increases the severity of hepatic fibrosis. The
current findings implied that the HCV load in parenchyma cells is a
more appropriate index compared with the serum viral load for
evaluating HCV replication in hepatocytes, and may function as an
important factor in HCV-infected hepatic injury evaluation.
Acknowledgements
The present study was supported by the National
Science and Technology Major Project (grant no. 2012ZX10002003),
the National Natural Science Foundation of China (grant no.
81572726), Science and the Technology Planning Project of Guangdong
Province, China (grant nos. 2014B020212025 and 2016A020212004).
Glossary
Abbreviations
Abbreviations:
|
G
|
inflammation grade
|
|
S
|
stage of fibrosis
|
|
HCV
|
hepatitis C virus
|
References
|
1
|
Hajarizadeh B, Grebely J and Dore GJ:
Epidemiology and natural history of HCV infection. Nat Rev
Gastroenterol Hepatol. 10:553–562. 2013. View Article : Google Scholar : PubMed/NCBI
|
|
2
|
Lavanchy D: Evolving epidemiology of
hepatitis C virus. Clin Microbiol Infect. 17:107–115. 2011.
View Article : Google Scholar : PubMed/NCBI
|
|
3
|
Bartenschlager R: Hepatitis C virus: From
molecular virology to antiviral therapy. Current Topics in
Microbiology & Immunology. 369:V–VI. 2013.
|
|
4
|
Hernandez-Gea V and Friedman SL:
Pathogenesis of liver fibrosis. Annu Rev Pathol. 6:425–456. 2011.
View Article : Google Scholar : PubMed/NCBI
|
|
5
|
Alberti A and Benvegnù L: Management of
hepatitis C. J Hepatol. 38:Suppl 1. S104–118. 2003. View Article : Google Scholar : PubMed/NCBI
|
|
6
|
Marcellin P, Asselah T and Boyer N:
Fibrosis and disease progression in hepatitis C. Hepatology. 36(5):
Suppl 1. S47–S56. 2002. View Article : Google Scholar : PubMed/NCBI
|
|
7
|
Zeuzem S, Alberti A, Rosenberg W,
Marcellin P, Diago M, Negro F, Prati D, Puoti C, Roberts SK and
Shiffman ML: Review article: Management of patients with chronic
hepatitis C virus infection and ‘normal’ alanine aminotransferase
activity. Aliment Pharmacol Ther. 24:1133–1149. 2006. View Article : Google Scholar : PubMed/NCBI
|
|
8
|
Adinolfi LE, Utili R, Andreana A, Tripodi
MF, Marracino M, Gambardella M, Giordano M and Ruggiero G: Serum
HCV RNA levels correlate with histological liver damage and concur
with steatosis in progression of chronic hepatitis C. Dig Dis Sci.
46:1677–1683. 2001. View Article : Google Scholar : PubMed/NCBI
|
|
9
|
Petit JM, Benichou M, Duvillard L, Jooste
V, Bour JB, Minello A, Verges B, Brun JM, Gambert P and Hillon P:
Hepatitis C virus-associated hypobetalipoproteinemia is correlated
with plasma viral load, steatosis, and liver fibrosis. Am J
Gastroenterol. 98:1150–1154. 2003. View Article : Google Scholar : PubMed/NCBI
|
|
10
|
Durante-Mangoni E, Zampino R, Portella G,
Adinolfi LE, Utili R and Ruggiero G: Correlates and prognostic
value of the first-phase hepatitis C virus RNA kinetics during
treatment. Clin Infect Dis. 49:498–506. 2009. View Article : Google Scholar : PubMed/NCBI
|
|
11
|
Hsu CS, Liu CH, Liu CJ, Chen CL, Lai MY,
Chen PJ, Chen DS and Kao JH: Factors affecting early viral load
decline of Asian chronic hepatitis C patients receiving pegylated
interferon plus ribavirin therapy. Antivir Ther. 14:45–54.
2009.PubMed/NCBI
|
|
12
|
Ke WM, Xie SB, Yu LN, Liu T, Lai J, He DQ,
Li XH, Gao ZL, Ke Y and Chen PJ: Decline of serum HBV DNA and no
change apportioned by the same hepatic parenchyma cell volume from
hepatic fibrosis stage 1 to stage 4 during the natural history of
chronic hepatitis B. Intervirology. 51:235–240. 2008. View Article : Google Scholar : PubMed/NCBI
|
|
13
|
Lee YS, Yoon SK, Chung ES, Bae SH, Choi
JY, Han JY, Chung KW, Sun HS, Kim BS and Kim BK: The relationship
of histologic activity to serum ALT, HCV genotype and HCV RNA
titers in chronic hepatitis C. J Korean Med Sci. 16:585–591. 2001.
View Article : Google Scholar : PubMed/NCBI
|
|
14
|
Chinese Medical Association, . Viral
hepatitis prevention and treatment programs. Chuan Ran Bing Xin Xi.
13:141–150. 2000.(In Chinese).
|
|
15
|
Ishak K, Baptista A, Bianchi L, Callea F,
De Groote J, Gudat F, Denk H, Desmet V, Korb G, MacSween RN, et al:
Histological grading and staging of chronic hepatitis. J Hepatol.
22:696–699. 1995. View Article : Google Scholar : PubMed/NCBI
|
|
16
|
Desmet VJ, Gerber M, Hoofnagle JH, Manns M
and Scheuer PJ: Classification of chronic hepatitis: Diagnosis,
grading and staging. Hepatology. 19:1513–1520. 1994. View Article : Google Scholar : PubMed/NCBI
|
|
17
|
Xie SB, Yao JL, Zheng SS, Yao CL and Zheng
RQ: The levels of serum fibrosis marks and morphometric
quantitative measurement of hepatic fibrosis. Hepatobiliary
Pancreat Dis Int. 1:202–206. 2002.PubMed/NCBI
|
|
18
|
Ke WM, Xie SB, Li XJ, Zhang SQ, Lai J, Ye
YN, Gao ZL and Chen PJ: There were no differences in serum HBV DNA
level between HBeAg-positive and HBeAg-negative chronic hepatitis B
with same liver histological necroinflammation grade but
differences among grades 1, 2, 3 and 4 apportioned by the same
hepatic parenchyma cell volume. J Viral Hepat. 18:637–645. 2011.
View Article : Google Scholar : PubMed/NCBI
|
|
19
|
Kar P: Risk factors for hepatocellular
carcinoma in India. J Clin Exp Hepatol. 4:(Suppl 3). S34–S42. 2014.
View Article : Google Scholar : PubMed/NCBI
|
|
20
|
Cerny A and Chisari FV: Pathogenesis of
chronic hepatitis C: Immunological features of hepatic injury and
viral persistence. Hepatology. 30:595–601. 1999. View Article : Google Scholar : PubMed/NCBI
|
|
21
|
Rehermann B: Interaction between the
hepatitis C virus and the immune system. Semin Liver Dis.
20:127–141. 2000. View Article : Google Scholar : PubMed/NCBI
|
|
22
|
Anand BS and Velez M: Assessment of
correlation between serum titers of hepatitis C virus and severity
of liver disease. World J Gastroenterol. 10:2409–2411. 2004.
View Article : Google Scholar : PubMed/NCBI
|
|
23
|
Bacon BR: Treatment of patients with
hepatitis C and normal serum aminotransferase levels. Hepatology.
36:(Suppl 1). S179–S184. 2002. View Article : Google Scholar : PubMed/NCBI
|
|
24
|
Leone N and Rizzetto M: Natural history of
hepatitis C virus infection: from chronic hepatitis to cirrhosis,
to hepatocellular carcinoma. Minerva Gastroenterol Dietol.
51:31–46. 2005.(In English and Italian). PubMed/NCBI
|
|
25
|
Orellana NI, Poniachik TJ, Smok SG, Madrid
SAM, Menéndez AA, Tobar AE and Brahm BJ: Factors associated with
the severity of liver damage in chronic hepatitis C. Rev Med Chil.
133:1311–1316. 2005.(In Spanish). PubMed/NCBI
|
|
26
|
Ramos Gómez M: Natural history of chronic
hepatitis C. Rev Gastroenterol Mex 67 Suppl. 2:S17–S20. 2002.(In
Spanish).
|
|
27
|
Zechini B, Pasquazzi C and Aceti A:
Correlation of serum aminotransferases with HCV RNA levels and
histological findings in patients with chronic hepatitis C: The
role of serum aspartate transaminase in the evaluation of disease
progression. Eur J Gastroenterol Hepatol. 16:891–896. 2004.
View Article : Google Scholar : PubMed/NCBI
|
|
28
|
Shen L, Li JQ, Zeng MD, Fan ST, Lu LG, Bao
H and Cao AP: Evaluation of the value of ultrasonography in
diagnosis of liver fibrosis in patients with chronic viral
hepatitis. Zhonghua Gan Zang Bing Za Zhi. 13:117–120. 2005.(In
Chinese). PubMed/NCBI
|
|
29
|
Umbetova KT, Volchkova EV, Kiselevskiĭ MV,
Lazareva AS and Pak SG: Lymphocyte subpopulation composition in
hepatic tissue and autoimmune manifestations in viral hepatitis.
Vestn Ross Akad Med Nauk. 12:37–40. 2010.
|