Introduction
H7N9 influenza is a recently emerging infection and
has a high rate of mortality. Typical clinical manifestations
include fever, cough, dyspnea and rapid progression of pulmonary
infiltration or consolidation (1,2).
Cytokines and immune cells regulate the immune response to viral
infection, mediate inflammatory responses, and are involved in
tissue damage and repair. Following initial infection, the innate
immune system of the host, as a first line of defense, reacts
earlier than the adaptive immune system to reduce further viral
invasion or replication. However, too strong an immune reaction
also causes aggravation, and subsequently induces lung injury
(3–5). Although successfully eliminating the
virus is essential, the response of virus-specific T cells could
also result in tissue damage and autoimmune responses in the host.
Therefore, monitoring the variation of cellular immune functions in
patients with H7N9 infection has important clinical significance,
particularly in critical patients, as it would contribute to the
establishment of a predictive immune parameter.
The aim of the present study was to analyze the
dynamic fluctuations of T cells, B cells, natural killer (NK) cells
and macrophages in patients infected with H7N9 influenza, and to
examine the association between persistence of computed tomography
(CT) abnormalities and dynamic variations of the peripheral blood
immune cell subpopulation.
Materials and methods
Study subjects
The study subjects comprised 9 patients that were
admitted to the First Affiliated Hospital of Soochow University
(Suzhou, China) and diagnosed with H7N9 infection from April 1 to
April 20, 2013. Diagnosis of H7N9 infection in patients was made by
positive throat-swab specimen tests for viral RNA. Among those
patients, 8 were male and 1 was female. The ages of the patients
ranged from 20 to 75 years, and the median age was 69 years. Two
patients succumbed during the course of the study; data for 7 and 5
patients were recorded during progression and recovery
respectively. In addition, 8 healthy volunteers were enrolled in
the study and used as control group. This retrospective,
small-scale study was approved by the Ethics and Review Committee
of the First Affiliated Hospital of Soochow University.
Clinical manifestations
All patients had been treated with oseltamivir (150
mg twice daily; Roche, Basel, Switzerland) and additionally treated
with methylprednisolone (1–2 mg/kg/day). Antibiotics given to all
patients included moxifloxacin, sulbactam and cefoperazone,
levofloxacin, meropenem, piperacillin, imipenem and cilastatin.
Some patients also received continuous renal replacement therapy
(n=4) and mechanical ventilation therapy (n=7).
Following guidelines from the influenza A H7N9
clinic program published by the National Health and Family Planning
Commission of P.R. China (2nd edition, 2013), patients were
considered critically ill if they met the following criteria: i)
Pneumonia with two or more complications, such as acute respiratory
distress syndrome, heart failure, renal failure, septic shock,
encephalopathy and secondary infections, and ii) no improvement in
at least one of the above mentioned complications after 3 days of
active treatment. Recovery was considered by improvement of
symptoms, no detectable H7N9 virus in the throat-swab specimens and
the initiation of absorption in chest computed tomography
images.
Antibodies, sample collection and
analysis
Monoclonal antibodies (mAbs) fluorescently labeled
with phycoerythrin (PE), fluorescein isothiocyanate (FITC),
phycoerythrin-anthocyanidin (PE-Cy5) or phycoerythrin-Texas red
(ECD) were used. PE-programmed death 1 (PE-PD-1; cat. no. 557946)
mAb and PE-interleukin (IL)-17A (cat. no. 560486) mAb were
purchased from BD Biosciences (San Jose, CA, USA), and the other
mAbs were obtained from Beckman Coulter, Inc. (Brea, CA, USA).
Results are expressed as the percentages of the T-cell subset in
the total lymphocyte population. The samples were analyzed using a
flow cytometer (Beckman Coulter Epics XL; Beckman Coulter, Inc.).
Data were collected and analyzed using EXPO32™ ADC software
(Beckman Coulter, Inc.).
Whole blood samples (2 ml) were collected from
patients for the detection of CD4+T cells (FITC-CD45
mAb, cat. no. 6603838; PE-Cy5-CD3 mAb, cat. no. 6607010; PE-CD4
mAb, cat. no. IM0449U), CD8+T cells (FITC-CD45 mAb;
PE-Cy5-CD3 mAb; ECD-CD8 mAb, cat. no. 6604728), NK cells (FITC-CD45
mAb; PE-Cy5-CD3 mAb; PE-CD56 mAb, cat. no. IM2073U), B cells
(ECD-CD19 mAb, cat. no. 6604551), regulatory T cells (Tregs;
FITC-CD4 mAb, cat. no. 6602393; PE-Cy5-CD25 mAb, cat. no. IM2646U;
PE-CD127 mAb, cat. no. IM1980U), monocytes (PE-CD14 mAb, cat. no.
IM0650U; FITC-CD16 mAb, cat. no. 6604894),
CD4+PD-1+T cells (PE-Cy5-CD4 mAb, cat. no.
IM2636U; PE-PD-1 mAb) and CD8+PD-1+T cells
(FITC-CD8 mAb, cat. no. 6602385; PE-PD-1 mAb). Briefly, 100 µl
sodium citrate anticoagulant was added to the sample in each flow
tube and mouse anti-human fluorescence-labeled mAbs were then added
(10 µl). After mixing, the samples were incubated for 15 min away
from light at room temperature. Red blood cell lysis and cell
fixation was conducted using a Coulter Q-Prep specimen processing
instrument (Beckman Coulter, Inc.), and >1×10⁵ cells
were counted.
For the detection of T helper (Th)1
(CD3+CD8−IFN-γ+ T cells; ECD-CD3
mAb, cat. no. IM2705U; PE-Cy5-CD8 mAb, cat. no. IM2638U; FITC-IFN-γ
mAb, cat. no. IM2716U), Th2
(CD3+CD8−IL4+ T cells; ECD-CD3
mAb; PE-Cy5-CD8 mAb; PE-IL-4 mAb, cat. no. IM2719U) and Th17 cells
(CD3+CD8−IL17+ T cells; PE-IL-17A
mAb; ECD-CD3 mAb; PE-Cy5-CD8 mAb), 50 µl whole blood was treated
with hemolysis reagent (BD Pharmingen™; San Diego, CA, USA) for 4–6
h. Cells were then harvested, stained with ECD-CD3 mAb and
PE-Cy5-CD8 mAb (10 µl), permeabilized in IntraPrep Permeabilization
Reagent 1 and Reagent 2 (BD Pharmingen™), then stained with
FITC-IFN-γ mAb, PE-IL-4 mAb or PE-IL-17A mAb (10 µl) according to
the manufacturer's recommendations. Flow cytometric acquisition was
gated on CD3+CD8− cells.
Statistical analysis
Statistical analysis was performed with SPSS
statistical software (SPSS version 9.0; SPSS Inc., Chicago, IL,
USA). One-way analysis of variance with multiple comparisons tests
(Kruskal-Wallis tests) were used and P<0.05 was considered to
indicate a statistically significant difference.
Results
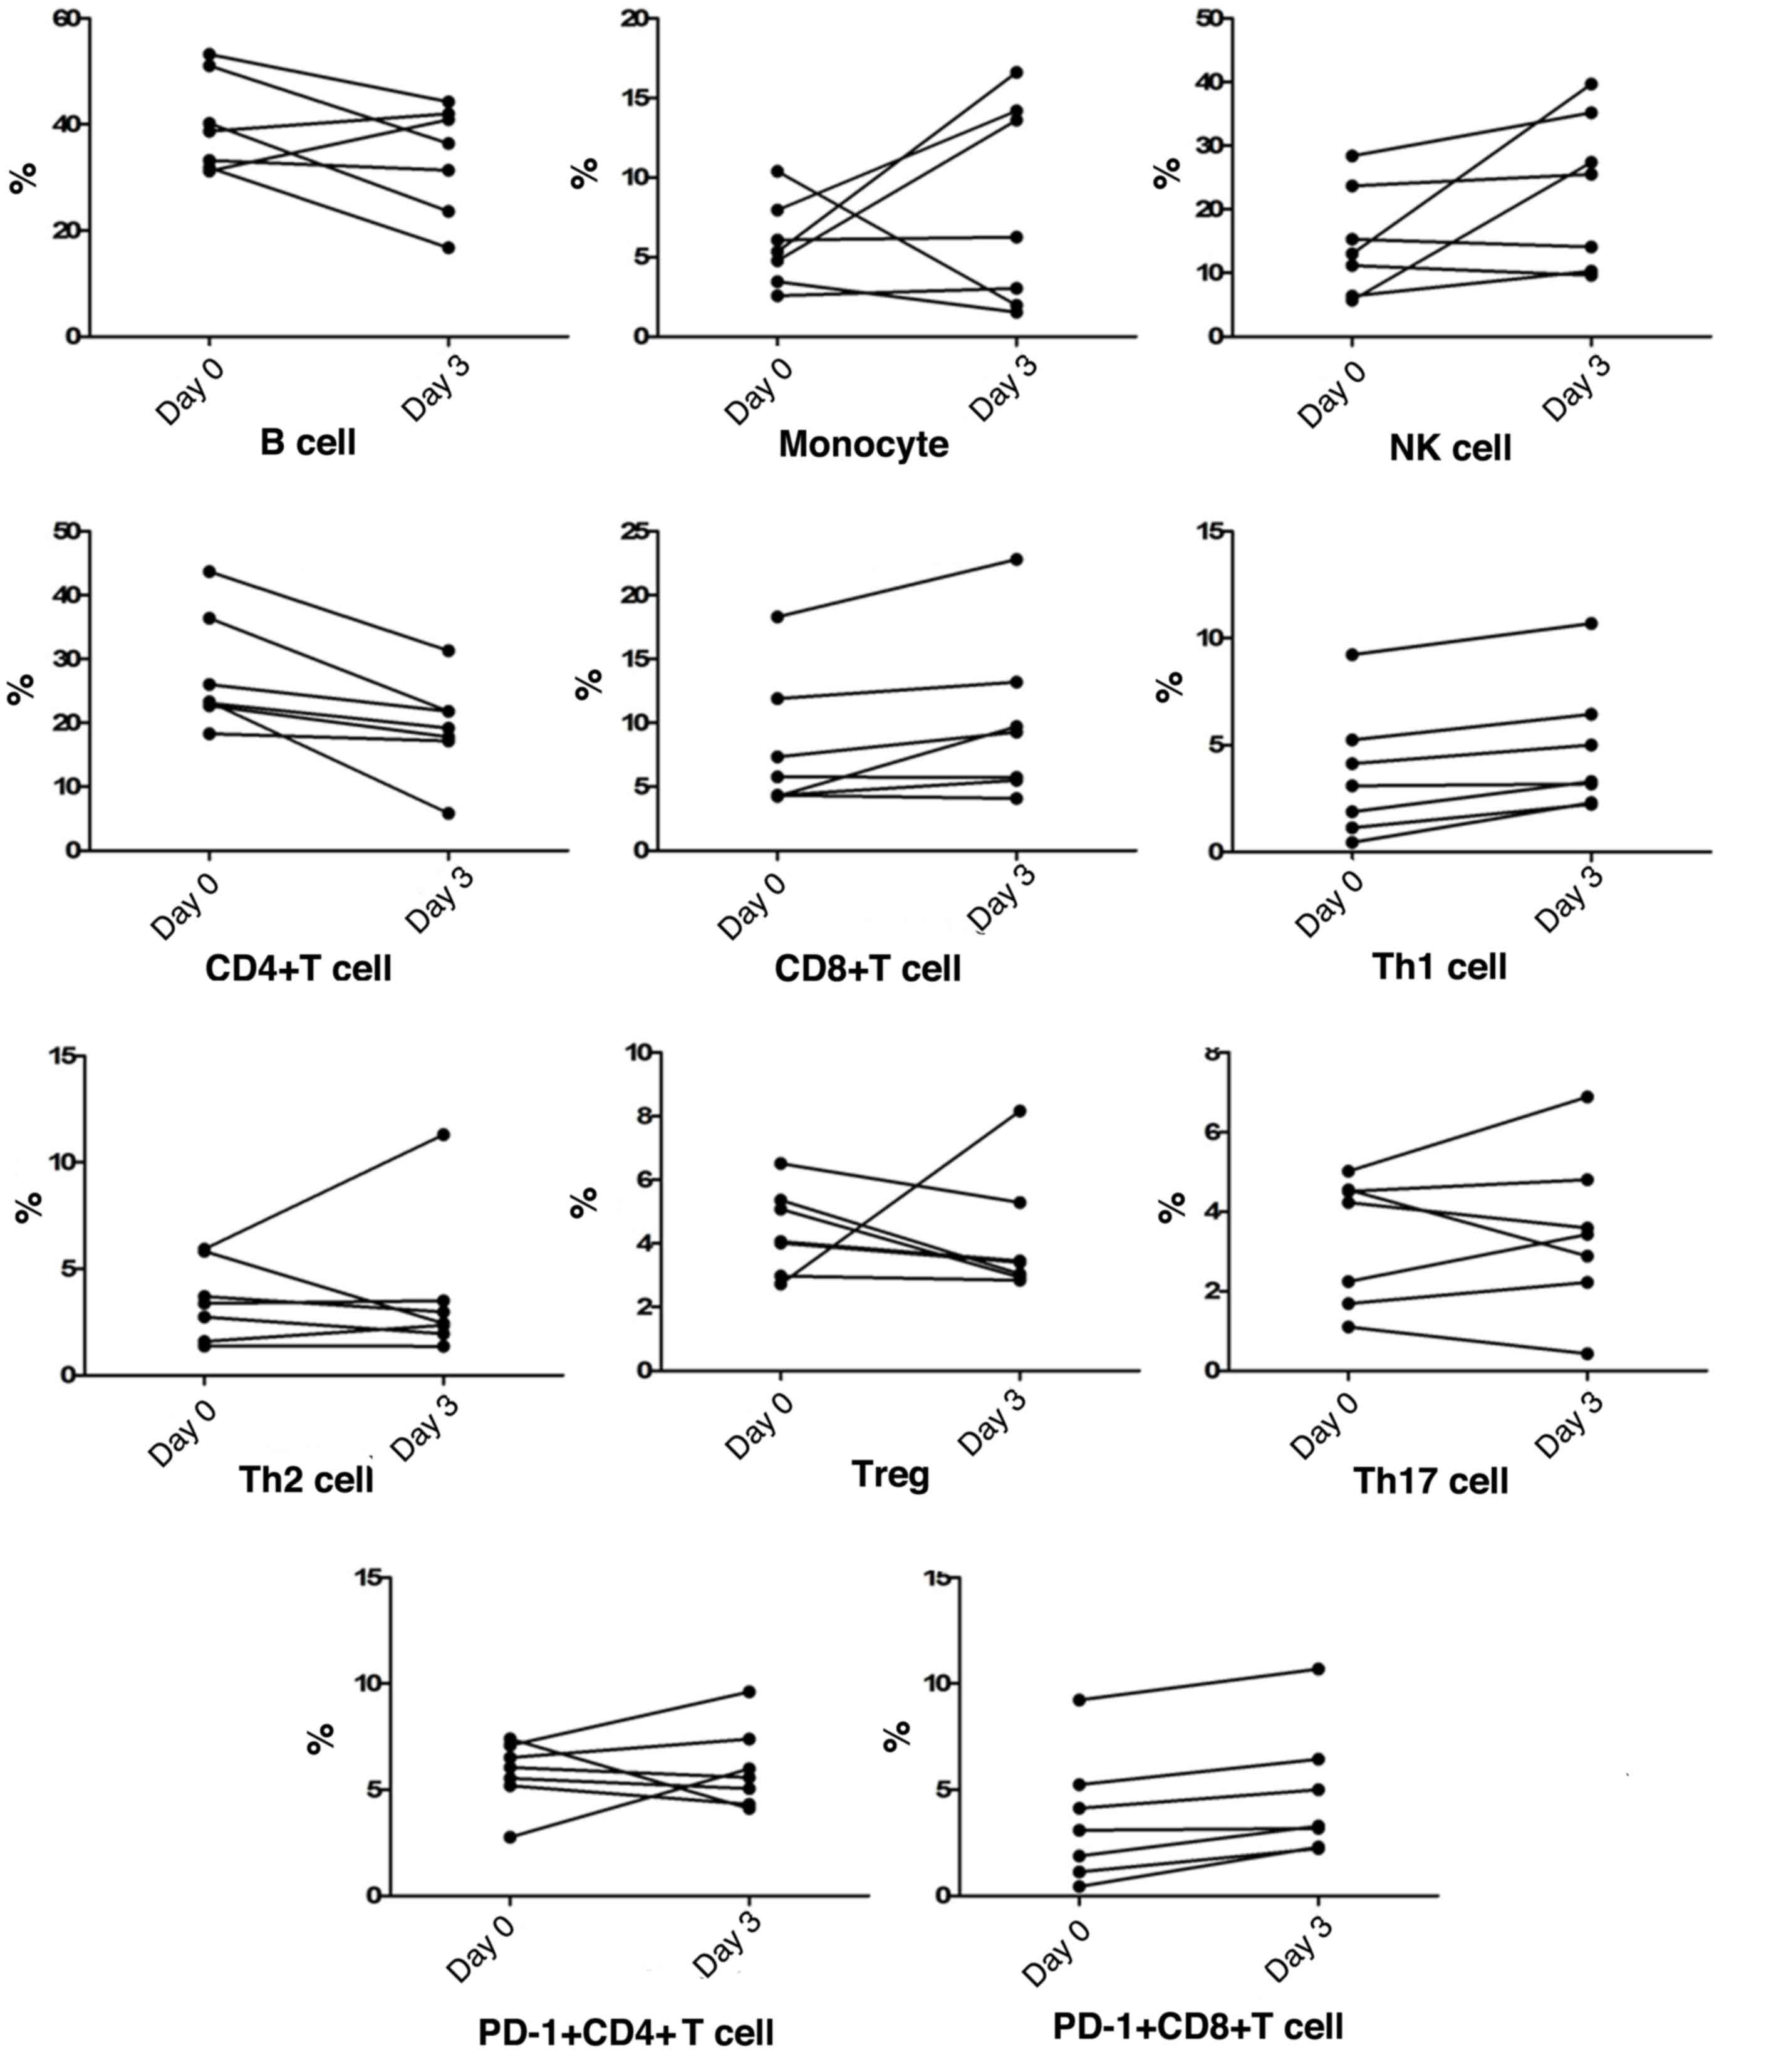
Peripheral blood cell subgroup changes
at progression
Along with chest radiological progression within the
first 3 days, in most patients, the NK cell counts were similar to
monocyte counts, which both demonstrated a gradual increase,
whereas the frequency of B cells showed an obvious reduction. The
frequency of peripheral blood CD4+T cells gradually
decreased in all patients, whereas CD8+T cell
frequencies showed a gradual increase in the majority of patients,
thus causing a CD4/CD8 imbalance. Among T cell subtypes, Th1 cells,
Th2 cells, CD8+PD-1+T cells,
CD4+PD-1+T cells, Tregs and Th17 cell
frequencies fluctuated by ~10%. Notably, peripheral blood
CD8+PD-1+T cells and Th1 cells both
demonstrated a slight increase in frequency in all patients,
together with a downward trend of Tregs frequencies in most cases
(Fig. 1).
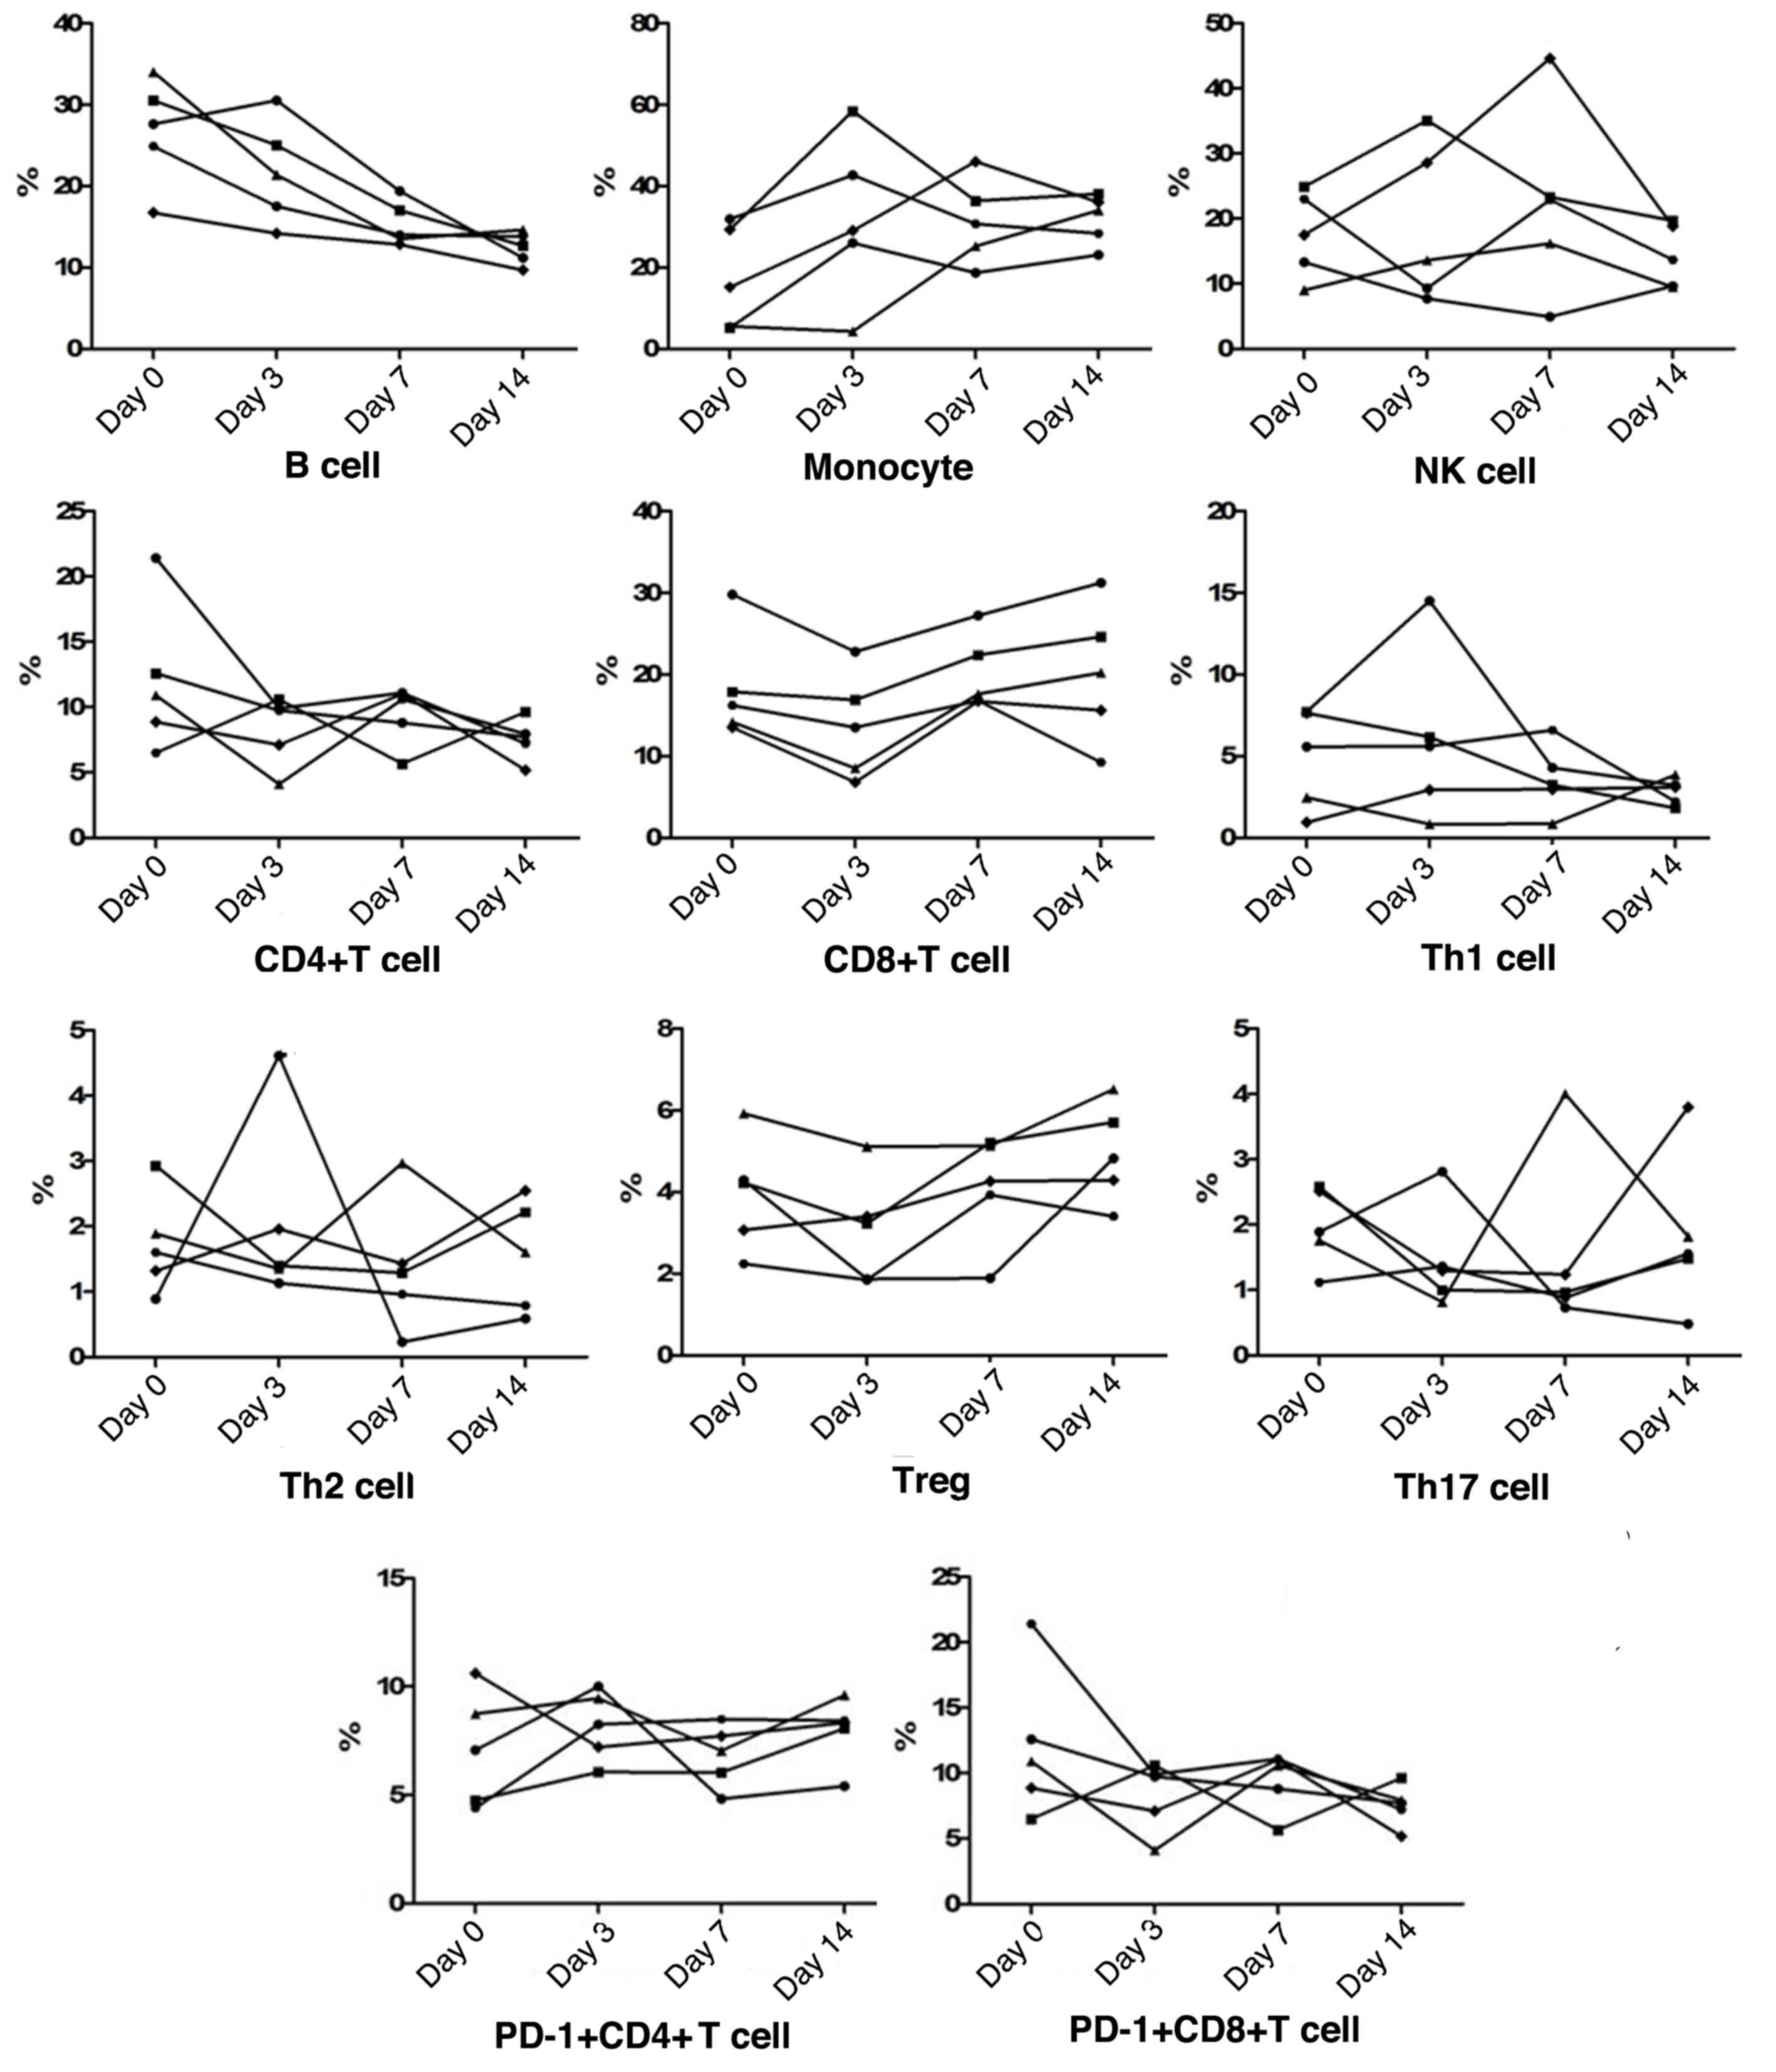
Peripheral blood cell subgroup changes
during recovery
During recovery, both NK cell and monocyte
frequencies were found to be increased initially and gradually
reduce again in most patients, whereas all cases were classified as
having a reduction in B cells. As for T cell subsets, the frequency
of CD4+T cells gradually decreased, whereas
CD8+T cell frequencies showed an initial reduction and a
subsequent increase in all patients, to restore the CD4/CD8
balance. Furthermore, peripheral Th1 cell, Th2 cell,
CD4+PD-1+T cell,
CD8+PD-1+T cell, Tregs and Th17 cell
frequencies fluctuated slightly in a narrow range. Among these T
cell subsets, all recovering patients exhibited an increased trend
of Tregs frequencies, and in patients who presented with higher
levels of Th1 cells, the levels were subsequently reduced during
recovery (Fig. 2).
Differences between the progression
and recovery periods
The frequencies of the different cell subsets at
different periods were statistically compared (Table I). The preliminary data from this
study showed that the frequencies of B cells, Th2 cells and Th17
cells in the progression period were significantly higher than
those in the recovery period (P<0.01, P=0.001 and P=0.001,
respectively). The frequencies of CD4+T cells,
CD8+T cells, monocytes, CD4+PD-1+T
cells and CD8+PD-1+T cells in the progression
period were less than those in the recovery period (P<0.001,
P=0.0003, P=0.0001, P=0.013 and P=0.0001, respectively). The
frequencies of NK cells, Th1 cells and Tregs exhibited no
significant differences between the two periods (P=0.85, P=0.88 and
P=0.62, respectively).
 | Table I.Analysis of differences of lymphocyte
subgroups in the peripheral blood of patients with influenza A
(H7N9) between the progression and recovery periods. |
Table I.
Analysis of differences of lymphocyte
subgroups in the peripheral blood of patients with influenza A
(H7N9) between the progression and recovery periods.
| Cell type | Healthy (n=8) | Progression
(n=7) | Recovery (n=5) |
|---|
| B cells | 12.59±1.23 | 36.78±2.63 |
19.05±1.62a |
| NK cells | 16.40±2.21 | 18.97±2.92 | 18.26±2.22 |
| Monocytes | 2.57±0.47 | 6.99±1.31 |
25.21±3.31a |
| CD4+T
cells | 38.75±2.40 | 23.46±2.43 |
39.43±2.33b |
| CD8+T
cells | 22.79±2.16 | 9.04±1.54 |
18.08±1.50a |
| Th1 cells | 4.16±0.52 | 4.17±0.79 | 4.33±0.72 |
| Th2 cells | 0.35±0.08 | 3.60±0.70 |
1.69±0.22a |
|
PD-1+CD4+T
cells | 3.78±0.92 | 5.90±0.45 |
7.52±0.41a |
|
PD-1+CD8+T
cells | 0.50±0.15 | 4.17±0.79 |
9.33±0.81a |
| Tregs | 5.95±0.56 | 4.28±0.43 |
4.02±0.31c |
| Th17 cells | 0.29±0.75 | 3.40±0.47 |
1.71±0.22a |
When compared with healthy volunteers, it was
observed that increases of B cell, Th2 cell and Th17 cell
frequencies in the pathogenesis of the critical H7N9 infection
occurred and these frequencies exhibited a normalization trend
during recovery, while reductions of CD4+T cell
andCD8+T cell frequencies occurred during progression
and the frequencies subsequently normalized during recovery. With
regard toCD8+PD-1+T cell,
PD-1+CD4+T cell and monocyte frequencies,
they exhibited further increases during recovery compared with
those during progression.
Discussion
NK cells are the major effector cells during acute
infection, rapidly killing infected cells in the process. Previous
studies have shown that a reduction in NK cell count occurs mainly
because the virus directly infects and kills NK cells, thereby
limiting their activity and leading to their apoptosis (5,6). In a
study of H1N1-infected patients, the frequency of NK cells in
patients with severe and moderate disease was found to be less than
that of the control group (6). In
the present study, for the majority of patients, although no
significant difference in the frequency of NK cells was found
between the progression period and recovery, the NK cell frequency
demonstrated a gradual increase in the progression period and an
early increase and sequential reduction during recovery. Notably,
the patients with a higher level of NK cells in the progression
period exhibited a quicker recovery from the disease. In
conclusion, when infection is accompanied by a dynamic NK cell
change, this could indicate that the body is in a balance between
anti-infective immunity and autoimmune damage.
Previously, mononuclear cell infiltration and
alveolar cell desquamation have been described during the acute
phase of severe acute respiratory syndrome, together with
dysregulation of plasma cytokine levels (7). Exposure of monocytes or macrophages to
viruses causes the release of proinflammatory cytokines, such as
TNF-α, IL-1 and IL-6, and chemokines, as well as members of the
CC-chemokine subfamily such as MIP-1α, MCP-1 and RANTES, which
preferentially attract monocytes and lymphocytes (8). In the present study, for most patients,
the frequency of monocytes in the progression period was less than
that during recovery, and the monocyte counts demonstrated a
gradual increase in the progression period and an early increase
and subsequent reduction during recovery. It is hypothesized that
the increase of monocyte frequency in the progression period
exhibits both immune protective and chemoattracting functions, and
its subsequent reduction was important in achieving balanced
cytokine production.
CD4+ and CD8+ T cells are
associated with viral immunity and a lack of these cells would lead
to a delay in viral clearance and an increase in mortality. In an
animal study, it was found that CD4+ T cells,
CD8+ T cells and B cells achieved peak values within 5–6
days after swine-origin influenza A virus infection (9). In accordance with previous data
concerning H1N1, which indicated that the frequency of B cells in
patients with severe disease was significantly higher than that in
patients with moderate disease and the control (10), the present study showed that
CD4+ T cells, CD8+ T cells and B cells all
demonstrated detectable changes, which included an imbalance of
CD4/CD8 in the progression stage, together with a continuous
reduction in CD4+ T cells and B cells. This could
indicate that the disease progression may be attributed to
inhibition of the antiviral immune response of T cells, thereby
causing the CD4/CD8 ratio to balance during recovery, and a
downregulation of B cell-induced humoral immune responses against
H7N9 virus.
No statistically significant changes were found
during the continuous monitoring of
CD4+IFN-γ+ T cell,
CD4+IL-4+ T cell,
CD4+PD-1+ T cell,
CD8+PD-1+ T cell, Tregs and Th17 cell
frequencies of patients with severe H7N9 in the progression period,
or during recovery. However, despite the relatively low numbers of
study subjects, the observations of the present study indicate that
there are persistent abnormalities of these T cell subsets in
patients who have suffered from H7N9 infection. In the progression
period, although CD4+IFN-γ+ T cell
frequencies increased, CD8+PD-1+ T cell
frequencies also increased in all patients, together with higher
levels ofCD4+IL-4+ T cells, which might
induce the inhibition of Th1 cell-mediated antiviral immunity. In
support, during recovery, the Th1/Th2 balance was maintained, and
CD8+PD-1+ T cell frequencies demonstrated a
mild downward trend in the majority of cases. With regard to
regulatory T cells, a downward trend of Treg frequencies in the
majority of cases might contribute to an enhancement of the immune
response to virus during disease progression, along with subsequent
uncontrolled immune damage in patients with H7N9 infection
(11). It was also found that the
frequency of Th17 cells in the progression period was significantly
higher than that in recovery, which suggested that Th17 cells
promote pathogenesis of the disease. In addition, pro-inflammatory
cytokine responses, characterized by a combined Th1/Th17 cytokine
induction may be responsible for the disease progression of
patients with H7N9 infection (12).
In present study, it was noted that the immune cell
changes in H1N1- and H7N9-infected patients differ. This could be
associated with T cells, the peak detection of which may have been
missed because of failure to diagnose and treat the disease at an
early stage. Furthermore, a study by Cao et al has indicated
that the incidence of severe H1N1 is highest in the 15- to
19-year-old age group and lowest for patients aged >65 years
(13). However, the clinical data in
the current study indicated that the most severe H7N9 infections
occurred in individuals >60 years old. This difference in
patient age might be responsible for differences in immune cell
differences between H1N1- and H7N9-infections.
In conclusion, H7N9 infection stimulates host and
cellular immune responses. Each lymphocyte subgroup in patients
infected with the H7N9 virus plays a more important antiviral role
in the early stages of infection, but an excessive immune response
leads to an increase of immunological injury, and establishment of
immunological homeostasis is helpful to control the disease. Since
the preliminary results reported in the present study were based on
a small sample, further studies with larger sample sizes are
required to verify and extend its findings.
Acknowledgements
This study was supported by Clinical Medical Center
of Suzhou (no. SZZX201502), Suzhou Key Laboratory for Respiratory
Medicine (no. SZS201617), Projects of the Department of Health of
Jiangsu Province (no. QNRC2016748) and the Natural Science
Foundation of Jiangsu Province University (no. 13KJB320021). The
authors would like to acknowledge Professor Xue-Guang Zhang of The
First Affiliated Hospital of Soochow University for providing
constructive criticism and helpful suggestions for this
manuscript.
Glossary
Abbreviations
Abbreviations:
|
NK
|
natural killer
|
|
Treg
|
regulatory T cell
|
|
PD-1
|
programmed death 1
|
|
PE
|
phycoerythrin
|
|
FITC
|
fluorescein isothiocyanate
|
|
PE-Cy5
|
phycoerythrin-anthocyanidin
|
|
ECD
|
phycoerythrin-Texas red
|
References
|
1
|
Wang XF, Shi GC, Wan HY, Hang SG, Chen H,
Chen W, Qu HP, Han BH and Zhou M: Clinical features of three avian
influenza H7N9 virus-infected patients in Shanghai. Clin Respir J.
8:410–416. 2014. View Article : Google Scholar : PubMed/NCBI
|
|
2
|
Gao HN, Lu HZ, Cao B, Du B, Shang H, Gan
JH, Lu SH, Yang YD, Fang Q, Shen YZ, et al: Clinical findings in
111 cases of influenza A (H7N9) virus infection. N Engl J Med.
368:2277–2285. 2013. View Article : Google Scholar : PubMed/NCBI
|
|
3
|
Koyama S, Ishii KJ, Coban C and Akira S:
Innate immune response to viral infection. Cytokine. 43:336–341.
2008. View Article : Google Scholar : PubMed/NCBI
|
|
4
|
Heltzer ML, Coffin SE, Maurer K, Bagashev
A, Zhang Z, Orange JS and Sullivan KE: Immune dysregulation in
severe influenza. J Leukoc Biol. 85:1036–1043. 2009. View Article : Google Scholar : PubMed/NCBI
|
|
5
|
Mao H, Tu W, Qin G, Law HK, Sia SF, Chan
PL, Liu Y, Lam KT, Zheng J, Peiris M and Lau YL: Influenza virus
directly infects human natural killer cells and induces cell
apoptosis. Virol. 83:9215–9222. 2009. View Article : Google Scholar
|
|
6
|
Giamarellos-Bourboulis EJ, Raftogiannis M,
Antonopoulou A, Baziaka F, Koutoukas P, Savva A, Kanni T, Georgitsi
M, Pistiki A, Tsaganos T, et al: Effect of the novel influenza A
(H1N1) virus in the human immune system. PLoS One. 4:e83932009.
View Article : Google Scholar : PubMed/NCBI
|
|
7
|
Tse GM, To KF, Chan PK, Lo AW, Ng KC, Wu
A, Lee N, Wong HC, Mak SM, et al: Pulmonary pathological features
in coronavirus associated severe acute respiratory syndrome (SARS).
J Clin Pathol. 57:260–265. 2004. View Article : Google Scholar : PubMed/NCBI
|
|
8
|
Wang CH, Liu CY, Wan YL, Chou CL, Huang
KH, Lin HC, Lin SM, Lin TY, Chung KF and Kuo HP: Persistence of
lung inflammation and lung cytokines with high-resolution CT
abnormalities during recovery from SARS. Respir Res. 6:422005.
View Article : Google Scholar : PubMed/NCBI
|
|
9
|
Lange E, Kalthoff D, Blohm U, Teifke JP,
Breithaupt A, Maresch C, Starick E, Fereidouni S, Hoffmann B,
Mettenleiter TC, et al: Pathogenesis and transmission of the novel
swine-origin influenza virus A/H1N1 after experimental infection of
pigs. J Gen Virol. 90:2119–2123. 2009. View Article : Google Scholar : PubMed/NCBI
|
|
10
|
Guo X, Chen Y, Li X, Kong H, Yang S, Ye B,
Cui D, Wu W and Li L: Dynamic variations in the peripheral blood
lymphocyte subgroups of patients with 2009 pandemic H1N1
swine-origin influenza A virus infection. Virol J. 8:2152011.
View Article : Google Scholar : PubMed/NCBI
|
|
11
|
Joedicke JJ, Dietze KK, Zelinskyy G and
Dittmer U: The phenotype and activation status of regulatory T
cells during Friend retrovirus infection. Virol Sin. 29:48–60.
2014. View Article : Google Scholar : PubMed/NCBI
|
|
12
|
Tan HL and Rosenthal M: IL-17 in lung
disease: Friend or foe? Thorax. 68:788–790. 2013. View Article : Google Scholar : PubMed/NCBI
|
|
13
|
Cao B, Li XW, Mao Y, Wang J, Lu HZ, Chen
YS, Liang ZA, Liang L, Zhang SJ, Zhang B, et al: Clinical features
of the initial cases of 2009 pandemic influenza A (H1N1) virus
infection in China. N Engl J Med. 361:2507–2517. 2009. View Article : Google Scholar : PubMed/NCBI
|