Introduction
Tonometry is a fundamental procedure in routine
ophthalmologic examination. Accurate measurements of intraocular
pressure (IOP) are key to diagnosing and monitoring glaucoma
(1–4). The Goldmann applanation tonometer (GAT)
is regarded as the reference standard in tonometry in current
clinical practice (5). The GAT uses
a small probe to gently flatten a part of the cornea to measure eye
pressure and a microscope known as a slit lamp to examine the eye.
The pressure in the eye is measured by the amount of force required
to flatten the cornea. This type of tonometry is extremely accurate
and is often used to measure IOP after a simple screening test. The
iCare rebound tonometer (RT) is a new type of portable tonometer.
It calculates IOP by measuring the motion parametric variation
after the probe strikes the cornea. Compared with the GAT, the RT
is handy, convenient and independent from other equipment.
In the present study, the two tonometers were
compared to assess the reliability of applying RT in clinical
procedures.
Patients and methods
General information
In total, 336 patients (672 eyes) from the
Department of Ophthalmology, the First People's Hospital of
Xiangyang (Hubei, China) from January 2013 to October 2013 were
recruited to participate in this study. There were 151 males and
185 females whose ages ranged from 23 to 81, with an average age of
53 years. The patients were diagnosed with glaucoma and suspected
glaucoma (150 patients), ametropia (91 patients) and other eye
diseases (95 patients). Patients with corneal cicatrix, corneal
edema and corneal refractive surgeries as well as those with
corneal astigmatism ≥3D were excluded from the study. Ratified by
the Ethics Committee of the hospital, all the subjects were
informed of the purpose and process of this study, and signed
informed consents before the examination.
Major measuring equipment
The Goldmann AT 900 applanation tonometer
(Hagg-Streit AG, Koeniz, Switzerland); iCare TA01i rebound
tonometer (Tiolat Oy, Helsinki, Finland); and the DGH Pachette 3
cornea thickness meter (DGH Technology Inc., Exton, PA, USA) were
used to conduct this study.
Methods
Tonometry
To obtain the IOP reading using the RT, the one-off
probe was changed for each reading and the patient was required to
be seated, staring straight ahead at the 0.05 sighting mark within
a distance of 5 meters. The frontal support bar was adjusted to
position the probe at the same height as the corneal vertex at
about 4–8 mm. The probe was vertical to the central corneal plane.
After obtaining six successful measurements by continuous
measurements, the iCare analyzes the data automatically and
displays the IOP. Based on the standard deviation of the
measurements, the tonometer showed 4 types of error bars - null,
low, medium and high. This study only recorded IOP results with
null error bar; otherwise, another measurement would be
implemented.
To obtain the IOP reading using the GAT, the patient
was seated and was required to stare at the 0.05 sighting mark
within a distance of 5 meters. According to conventional methods,
the eyelid margins and eyelashes could not be touched when the head
was pressed, and the eyeball should not receive any external
pressure when lightly lifting the upper eyelid during the
measurement. The reading was carried out three times and if the
difference value was within ±1 mmHg, the medium value was recorded
as the result of this IOP measurement.
When measuring the IOP, the RT and GAT were operated
by Q. Zhao and F. Gao, respectively. Considering that the eyeball
massage effect occurring during the examination would lower the
IOP, every patient was tested with the RT first. The doctor who
operated the GAT had no knowledge of the RT measurements before
each examination. The measurements of two tonometers were completed
within 10 min. During the examination, the right eye was tested
first and then the left. Only the measured values of the right eyes
were used to conduct the statistical analysis.
The RT tolerance and security
measurement using the visual analog scale (VAS) was used to
evaluate the degree of comfort during the examination
Patients were required to mark the comfort level of
the RT measurement in a calibrated line segment with one end (0)
referring to pain while the other end (10) referring to comfort in order to
quantitate the record results. After the RT measurement, the
corneal fluorescein dye was inspected under the slit lamp and used
to record the integrity of the patients' corneal epithelium.
Central corneal thickness (CCT)
measurement
The central part of the pupil was selected to locate
the central cornea. After measuring for five times, the minimum
value was recorded as the result.
Statistical method
The SPSS 17.0 statistical software (Chicago, IL,
USA) was used to conduct the statistical analysis. The measured
data in this study are shown as mean ± SD. According to the K-S
verification, the IOP values measured by the RT and GAT conformed
to the normal distribution. The consistency of the RT and GAT
measurements were analyzed by Bland-Altman with a paired t-test to
indicate the differences between the two. The correlation among the
RT, GAT and CCT were assessed with the Pearson linear regression
correlation analysis. P<0.05 indicates a statistical
significance.
Results
Consistency of the RT and GAT
measurements
The average IOP value of the 336 right eyes measured
by the RT and GAT were 18.30±5.10 and 18.52±4.46 mmHg,
respectively. The RT readings were relatively lower than those
obtained by GAT. However, their difference had no statistical
significance (t=−1.31, P=0.19) (Table
I). As shown by the linear regression analysis, the
measurements of the two tonometers had a significant correlation
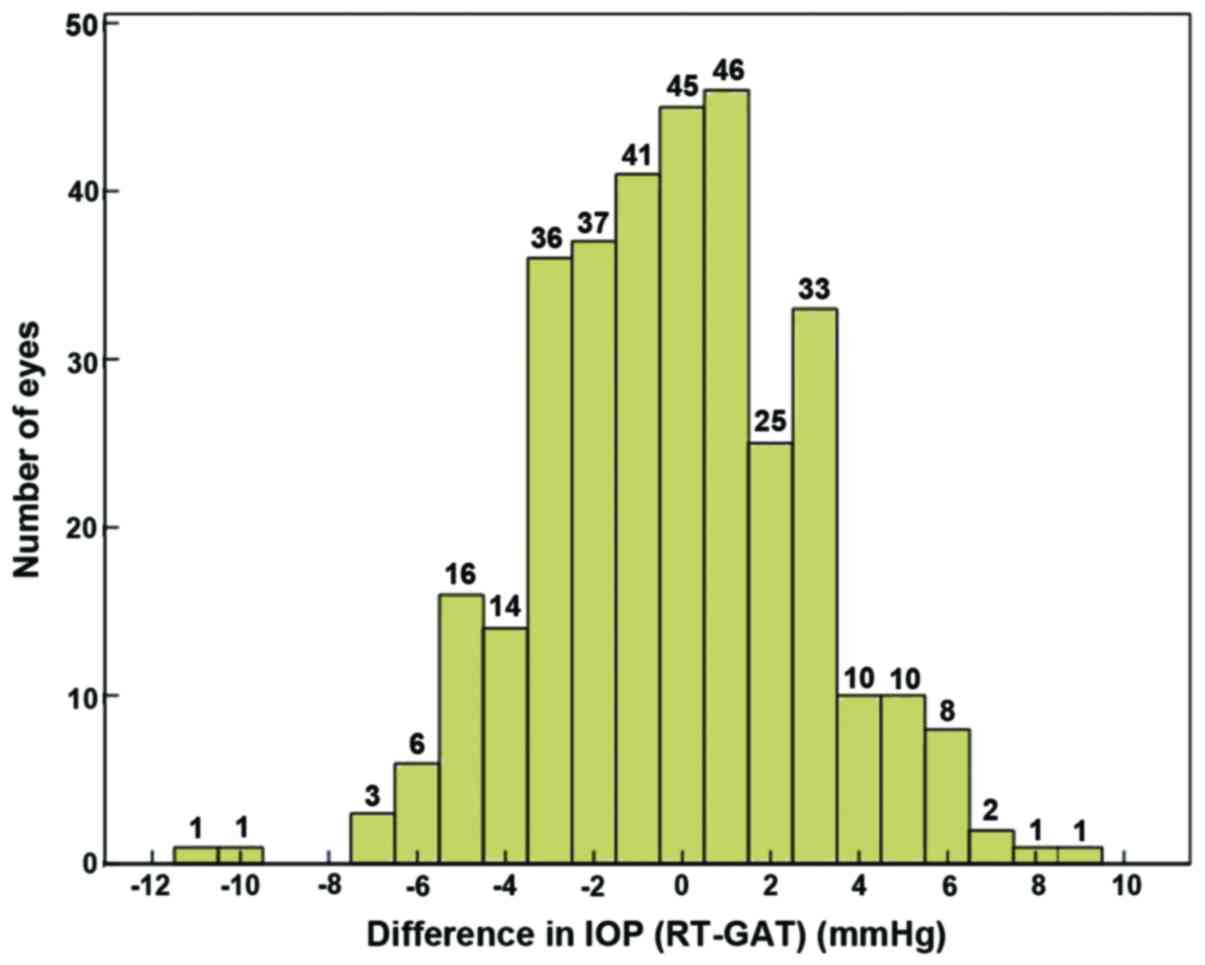
(r=0.806, P=0.001). The measurement difference of the tested 263
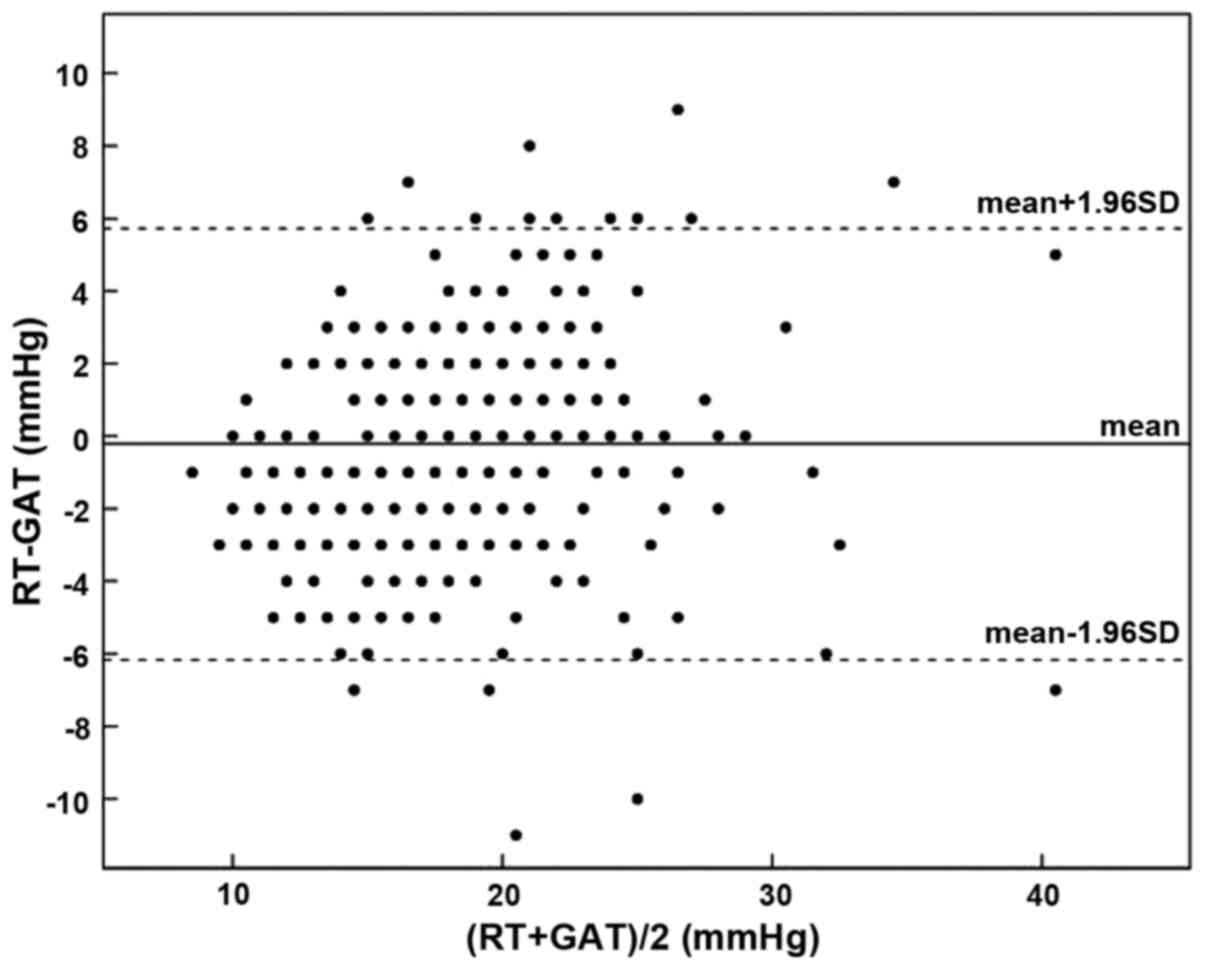
eyes (78.3%) was ≤ ±3 mmHg, with its distribution shown in Fig. 1. The Bland-Altman diagram showed that
the difference value between the RT and GAT measurements was
−0.22±3.07 mmHg, with a 95% confidence interval (CI) of −5.80–6.24
mmHg (Fig. 2).
 | Table I.Measured IOP values of RT and GAT. |
Table I.
Measured IOP values of RT and GAT.
|
| RT (mmHg) | GAT (mmHg) | ΔIOP (mmHg) |
|---|
| Mean ± SD | 18.30±5.10 | 18.52±4.46 | −0.22±3.07 |
| Range | 8–43 | 9–44 | −11–9 |
| 95% CI | 8.30–28.30 | 9.78–27.78 | −5.80–6.80 |
According to the IOP value measured by GAT and ISO
8612 (6), tested patients were
classified into three groups: group A, 7–15 mmHg, n=74; group B,
16–22 mmHg, n=218; and group C, 23–50 mmHg, n=44. As shown by the
group comparison (Table II), when
GAT measurement fell into the range of 7–15 and 16–22 mmHg, the
difference of the IOP value measured by the RT and the GAT was
quite small and of no statistical significance, which were
−0.12±2.77 and 0.04±2.86 mmHg, respectively. However, when the GAT
reading was ≥23 mmHg, the RT measurement −1.66±3.87 mmHg was
significantly lower than those obtained with the GAT. The
difference was statistically significant (t=−2.84, P=0.007).
Moreover, 95% CI (−9.25–5.93) of the difference increased
significantly. The measurement difference of 206 eyes (61.4%) was ≤
±3 mmHg while that of 76 eyes (22.7%) was > ±5 mmHg.
| Table II.RT and GAT measured values of three
different IOP groups. |
Table II.
RT and GAT measured values of three
different IOP groups.
|
| Group A (IOP 7–15
mmHg, n=74) | Group B (IOP 16–22
mmHg, n=218) | Group C (IOP 23–50
mmHg, n=44) |
|---|
|
|
|
|
|
|---|
|
| RT |
| GAT | RT |
| GAT | RT |
| GAT |
|---|
| Mean ± SD | 13.28±3.09 |
| 13.41±1.60 | 18.64±3.58 |
| 18.60±1.85 | 25.07±5.54 |
| 26.73±4.44 |
| Range | 8–20 |
| 9–15 | 11–31 |
| 16–12 | 15–43 |
| 23–44 |
| ΔIOP (mmHg) |
| −0.12±2.77 |
|
| 0.04±2.86 |
|
| −1.66±3.87 |
|
| (mean ± SD) |
| (t=−0.38,
P=0.71) |
|
| (t=0.21, P=0.83) |
|
| (t=−2.84,
P=0.007) |
|
| 95% CI |
| −5.66–5.66 |
|
| −5.57–5.57 |
|
| −9.25–5.25 |
|
| ΔIOP ≤ ±3
mmHga |
| 83.7% |
|
| 79.8% |
|
| 61.4% |
|
| ΔIOP > ±5
mmHgb |
| 2.7% |
|
| 5.5% |
|
| 22.7% |
|
Correlation between the RT and GAT
measured values and CCT
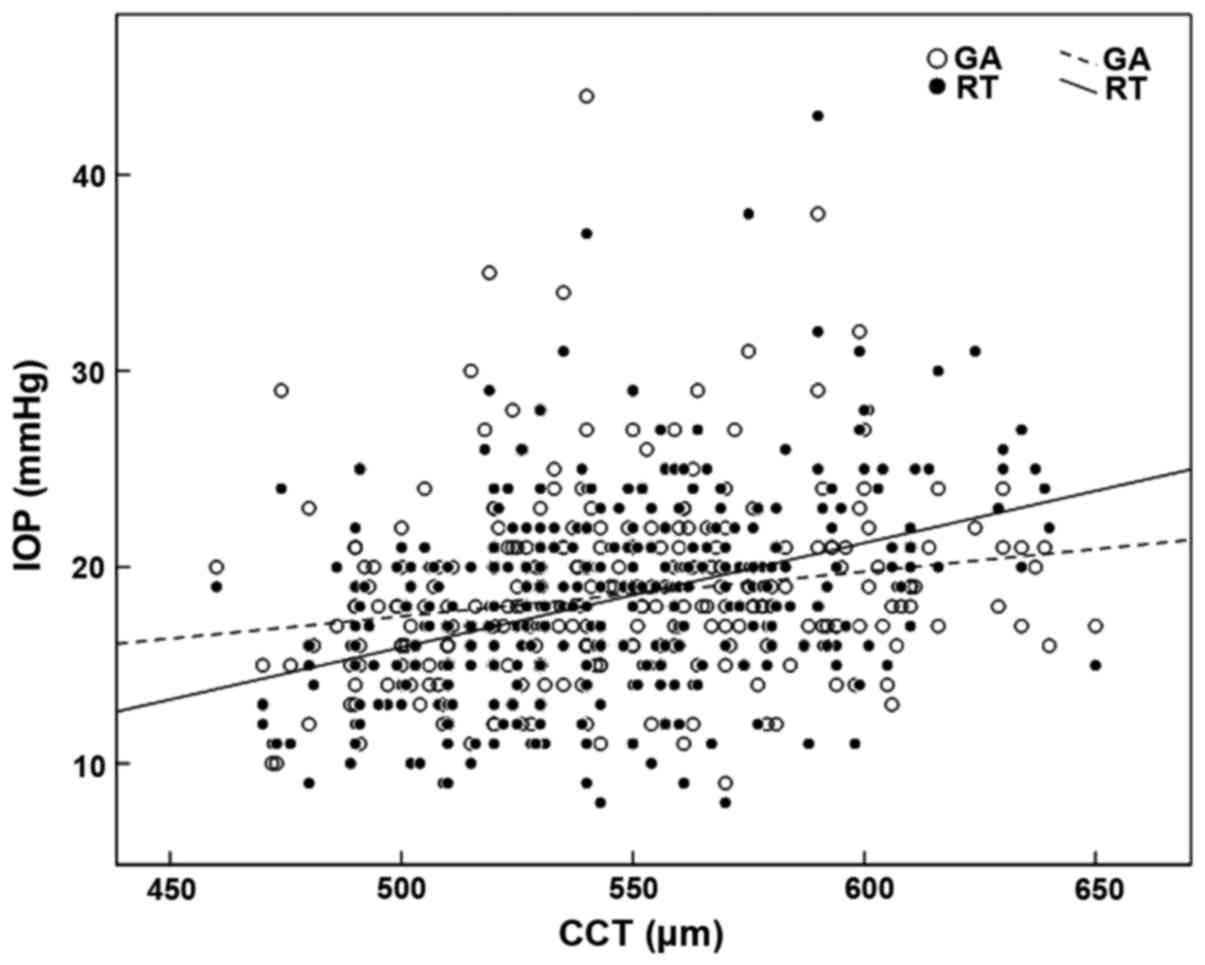
The linear regression analysis showed that the RT
(r=0.390, P=0.001) and the GAT (r=0.191, P=0.001) showed a positive
correlation with CCT. The impact of CCT on the RT was stronger than
that following GAT. The equation of linear regression was
RT=−10.67+0.053 × CCT and GAT=6.10+0.023 × CCT, respectively. The
scatter diagram is shown in Fig.
3.
Security and endurance of the RT
After the RT measurement, no corneal epithelial
defect was detected among the 336 tested patients. All the subjects
denied discomfort with the average VAS of 9.82±1.05.
Discussion
Tonometry is a fundamental procedure in routine
ophthalmologic examination. IOP is especially important for
treating glaucoma. Although intraocular hypertension is not a
requirement, it is still a significant risk factor in the
development of glaucoma treatment (7,8).
Lowering the IOP level is also the only effective treatment means
to control the development of glaucoma in clinical practices.
Therefore, accurately measuring IOP is crucial when diagnosing and
monitoring glaucoma.
The anterior chamber cannula technique is the most
accurate method to measure IOP directly (9). However, it is an invasive operation, as
this method can only be applied in experimental research (10). In clinical applications, GAT is
recognized as the global reference standard of tonometry (11–14).
With relatively high accuracy, the GAT has become a standard to
test the reliability of other tonometers in clinical applications.
The iCare RT invented by Kontiola is a new type of portable
tonometer, which calculates the tonometer through magnetic
induction and records velocity change after the probe strikes the
cornea (15–17). The RT measurement shows relatively
high accuracy in rats and other animals. However, few studies with
large sample size have been conducted concerning its clinical
application.
This study, in which patients who had cornea-related
diseases are removed, investigates 336 patients by using the GAT
and the RT to measure IOP. The comparison shows that the results of
two tonometers have a significant correlation (r=0.806, P=0.001),
and the RT measurements are a little lower than those obtained with
GAT (−0.22±3.07 mmHg) and have no statistical significance
(t=−1.31, P=0.19). The Bland-Altman diagram shows that a 95% CI of
the difference value is −5.80–6.24 mmHg and the difference value of
263 eyes (78.3%) ≤ ±3 mmHg, which is similar to Iliev et al
(18) study of 95% CI −3.2–5.2 mmHg
and difference value ≤ ±3 mmHg. All of these results indicate high
consistency between the RT and the GAT.
When the tested eyes are further grouped with the
IOP results obtained with the GAT, the results show that in the
normal IOP range of 7–22 mmHg, the RT measurements are consistent
with the overall results. However, in the high IOP values (23–50
mmHg), there is a significant difference between the RT and the GAT
readings with the average of −1.66 mmHg (t=−2.84, P=0.007).
However, this difference may not be of great significance in
clinical practice (19). Considering
that the discrete parameter SD (3.87) and 95% CI (−9.25–5.93) are
on the increase, we still think that we should be cautious in the
clinical application since the measurement with the RT does not
correlate well with the GAT in high IOP values.
Many studies (20,10) show
that the GAT readings are influenced by CCT. When the corneal
thickness increases by 10 µm, the GAT readings will increase by
about 0.2 mmHg accordingly. This study verifies the results that we
obtained while conducting this research. The linear regression
equation of the GAT and the CCT are GAT=6.10+0.023 × CCT (r=0.191,
P=0.001). Moreover, the RT shows a positive correlation with the
CCT (RT=−10.67+0.053 × CCT; r=0.390, P=0.001). When the CCT
increases by 10 µm, the RT readings will increase by about 0.5
mmHg. Besides, as the RT has a higher correlation coefficient than
that of the GAT, the RT readings are influenced more by the CCT
compared to the GAT. However, some studies (21,22)
consider that the corneal biomechanical property including the
corneal hysteresis (CH) and the corneal resistance factor (CRF)
impose more influence on the IOP. Thus, the multivariate regression
analysis is much more suitable to uncover and interpret the
correlation among the IOP and CCT, and CH and CRF. The weaker
correlation coefficient between the GAT, RT and CCT is shown in
this study.
The RT probe weighs about 24 mg, and the radius of
the plastic head end that contacts the cornea is about 0.9 mm. The
speed of the probe striking the cornea is about 0.25–0.35 m/sec
which is faster than a blink reflex. All these characteristics
enable the RT measurement to be quick and comfortable. When
compared with the GAT, the advantages of the RT measurement can be
best reflected in patients who are disabled, have poor
coordination, and those with corneal cicatrix (23).
In conclusion, the RT is well tolerated and safe,
and is a reliable alternative to the GAT in patients with a low to
moderate IOP range. However, in patients with high IOP values, the
measurements obtained with RT do not correlate well with the GAT.
The RT readings are influenced more by the CCT compared to the GAT.
Beside, further investigations should be conducted to discuss the
influence of corneal biomechanical properties with the GAT and RT
measurements.
References
|
1
|
Tamburrelli FC, Genitiempo M, Bochicchio
M, Donisi L and Ratto C: Cauda equina syndrome: evaluation of the
clinical outcome. Eur Rev Med Pharmacol Sci. 18:1098–1105.
2014.PubMed/NCBI
|
|
2
|
Zicari AM, Rugiano A, Ragusa G, Savastano
V, Bertin S, Vittori T and Duse M: The evaluation of adenoid
hypertrophy and obstruction grading based on rhinomanometry after
nasal decongestant test in children. Eur Rev Med Pharmacol Sci.
17:2962–2967. 2013.PubMed/NCBI
|
|
3
|
Portincasa P, Moschetta A, Giampaolo M and
Palasciano G: Diffuse gastrointestinal dysmotility by
ultrasonography, manometry and breath tests in colonic inertia. Eur
Rev Med Pharmacol Sci. 4:81–87. 2000.PubMed/NCBI
|
|
4
|
Jiang SP and Huang LW: Role of
gastroesophageal reflux disease in asthmatic patients. Eur Rev Med
Pharmacol Sci. 9:151–160. 2005.PubMed/NCBI
|
|
5
|
Kass MA: Standardizing the measurement of
intraocular pressure for clinical research. Guidelines from the Eye
Care Technology Forum. Ophthalmology. 103:183–185. 1996. View Article : Google Scholar : PubMed/NCBI
|
|
6
|
Internationaler Standard für
Augentonometer ISO 8612. Beuth-Verlag GmbH; Berlin: 2001, (In
German).
|
|
7
|
Hu J, Bui KM, Patel KH, Kim H, Arruda JA,
Wilensky JT and Vajaranant TS: Effect of hemodialysis on
intraocular pressure and ocular perfusion pressure. JAMA
Ophthalmol. 131:1525–1531. 2013. View Article : Google Scholar : PubMed/NCBI
|
|
8
|
Vyas P, Naik U and Gangaiah JB: Efficacy
of bimatoprost 0.03% in reducing intraocular pressure in patients
with 360° synechial angle-closure glaucoma: a preliminary study.
Indian J Ophthalmol. 59:13–16. 2011. View Article : Google Scholar : PubMed/NCBI
|
|
9
|
Matsuura K, Suto C, Akura J and Inoue Y:
Bag and chamber flushing: a new method of using intracameral
moxifloxacin to irrigate the anterior chamber and the area behind
the intraocular lens. Graefes Arch Clin Exp Ophthalmol. 251:81–87.
2013. View Article : Google Scholar : PubMed/NCBI
|
|
10
|
Kohlhaas M, Boehm AG, Spoerl E, Pürsten A,
Grein HJ and Pillunat LE: Effect of central corneal thickness,
corneal curvature, and axial length on applanation tonometry. Arch
Ophthalmol. 124:471–476. 2006. View Article : Google Scholar : PubMed/NCBI
|
|
11
|
Eldaly MA: Goldmann versus disposable
applanation tonometer tips in glaucoma patients and normal
subjects. Curr Eye Res. Aug 19–2015.(Epub ahead of print).
View Article : Google Scholar : PubMed/NCBI
|
|
12
|
Tamçelik N, Atalay E, Cicik E and Özkök A:
Comparability of Icare pro rebound tonometer with Goldmann
applanation and noncontact tonometer in a wide range of intraocular
pressure and central corneal thickness. Ophthalmic Res. 54:18–25.
2015. View Article : Google Scholar : PubMed/NCBI
|
|
13
|
Sinha G, Gupta S, Temkar S, Pandey V,
Sihota R and Dada T: IOP agreement between I-Care TA01 rebound
tonometer and the Goldmann applanation tonometer in eyes with and
without glaucoma. Int Ophthalmol. Dec 16–2014.(Epub ahead of
print).
|
|
14
|
Farhood QK: Comparative evaluation of
intraocular pressure with an air-puff tonometer versus a Goldmann
applanation tonometer. Clin Ophthalmol. 7:23–27. 2013.PubMed/NCBI
|
|
15
|
Lee TE, Yoo C, Hwang JY, Lin S and Kim YY:
Comparison of intraocular pressure measurements between Icare pro
rebound tonometer and Tono-Pen XL tonometer in supine and lateral
decubitus body positions. Curr Eye Res. 40:1–7. 2014.PubMed/NCBI
|
|
16
|
Lee YK, Lee JY, Moon JI and Park MH:
Effectiveness of the ICare rebound tonometer in patients with
overestimated intraocular pressure due to tight orbit syndrome. Jpn
J Ophthalmol. 58:496–502. 2014. View Article : Google Scholar : PubMed/NCBI
|
|
17
|
Sanz Borrego L, Morales-Fernandez L,
de-la-Casa Martínez JM, Sáenz-Francés F, Fuentes M and
García-Feijóo J: The Icare-pro rebound tonometer versus the
hand-held applanation tonometer in congenital glaucoma. J Glaucoma.
25:149–154. 2016. View Article : Google Scholar : PubMed/NCBI
|
|
18
|
Iliev ME, Goldblum D, Katsoulis K, Amstutz
C and Frueh B: Comparison of rebound tonometry with Goldmann
applanation tonometry and correlation with central corneal
thickness. Br J Ophthalmol. 90:833–835. 2006. View Article : Google Scholar : PubMed/NCBI
|
|
19
|
Pakrou N, Gray T, Mills R, Landers J and
Craig J: Clinical comparison of the Icare tonometer and Goldmann
applanation tonometry. J Glaucoma. 17:43–47. 2008. View Article : Google Scholar : PubMed/NCBI
|
|
20
|
Martinez-de-la-Casa JM, Garcia-Feijoo J,
Vico E, Fernandez-Vidal A, del Benitez Castillo JM, Wasfi M and
Garcia-Sanchez J: Effect of corneal thickness on dynamic contour,
rebound, and goldmann tonometry. Ophthalmology. 113:2156–2162.
2006. View Article : Google Scholar : PubMed/NCBI
|
|
21
|
Liu J and Roberts CJ: Influence of corneal
biomechanical properties on intraocular pressure measurement:
quantitative analysis. J Cataract Refract Surg. 31:146–155. 2005.
View Article : Google Scholar : PubMed/NCBI
|
|
22
|
Chui WS, Lam A, Chen D and Chiu R: The
influence of corneal properties on rebound tonometry.
Ophthalmology. 115:80–84. 2008. View Article : Google Scholar : PubMed/NCBI
|
|
23
|
Moreno-Montañés J, García N,
Fernández-Hortelano A and García-Layana A: Rebound tonometer
compared with goldmann tonometer in normal and pathologic corneas.
Cornea. 26:427–430. 2007. View Article : Google Scholar : PubMed/NCBI
|