Introduction
The clinical term for gestational hypertension is
clinically pregnancy-induced hypertension (PIH) syndrome (1). It is a distinctive and common disease
during pregnancy which is characterized by high blood pressure,
edema, proteinuria, convulsions, coma, heart failure and renal
failure (2). This disease severely
affects maternal and child health and is one of the leading causes
of maternal and neonatal mortality (3). Insulin resistance (IR) refers to a
physiological condition in which cells fail to take in glucose,
amino acids and fatty acids and cause high blood glucose (4). To maintain stable blood sugar levels, β
cells in the pancreas subsequently increase their production of
insulin, which results in hyperinsulinemia (5). A study has shown that in a non-diabetic
population, systolic and diastolic blood pressure were higher in
the high insulin group when compared with that in a normal insulin
group (6). IR is positively
correlated with the prevalence of hypertension.
Insulin receptor substrate (IRS) can be affected by
insulin receptor tyrosine kinase (7). IRS-1-4 are known insulin receptor
substrates. Phosphorylation of IRS-1 can activate downstream
effectors to then regulate the insulin signal transduction pathways
(8). IRS-1 is phosphorylated by
tyrosine kinase and then activates the downstream AKT (9). Therefore, IRS-1 and AKT are two
important kinases in the insulin signal transduction pathways.
The aim of the present study was to explore the
association between PIH and IR, which may provide a reasonable
solution for the clinical treatment of PIH.
Materials and methods
Ethics statement
The present study was approved by the Ethics
Committee of Nantong Maternity and Child Health Care Hospital
(Nantong, China; no. 20130215). All subjects were provided with the
relevant information (purpose and content) of the present study and
informed consent was obtained from all participants.
Antibodies and reagents
Human triglyceride (TG) ELISA kit, human total
cholesterol (TC) ELISA kit, human low density lipoprotein (LDL)
ELISA kit, human insulin ELISA kit, human high density lipoprotein
(HDL) kit and fasting blood glucose (FBG) kit were purchased from
Sigma-Aldrich (Merck Millipore, Darmstadt, Germany). human urine
protein C ELISA kit, human blood urea nitrogen (BUN) ELISA kit and
human serum creatinine (Scr) ELISA kit were purchased from R&D
Systems Inc., (Minneapolis, MN, USA). Human apolipoprotein A-1
(apoA-1) ELISA and apolipoprotein B (apoB) ELISA kits were
purchased from Abcam (Cambridge, MA, USA). Bicinchoninic acid (BCA)
kit, enhanced chemiluminescence (ECL) chemiluminescence kit and
β-actin antibody (AF0003) were purchased from Beyotime Institute of
Biotechnology (Jiangsu, China). AKT antibody (sc-5298), phospho-AKT
antibody (sc-293125), IRS-1 antibody (sc-515017) and phospho-IRS-1
antibody (sc-33956) were purchased from Santa Cruz Biotechnology
Inc., (Dallas, TX, USA).
Subjects
A total of 50 pregnant women with hypertension
(average gestational age, 230.12±18.9 days) were enrolled at
Nantong Maternity and Child Health Care Hospital (Nantong, China)
between May and October of 2013 as the pregnancy-induced
hypertension group (PIH group). Hypertension was diagnosed
according to the guidelines of the National Hypertension Education
Project Group (National High Blood Pressure Working Group) from
2000 and Williams Obstetrics 21st edition (10,11).
Another 50 healthy pregnant women who underwent regular obstetric
examination at Nantong Maternity and Child Health Care Hospital at
the same time (average gestational age, 228.5±15.5 days) were
enrolled as the normal group (control group).
After 12 h of fasting overnight, 5 ml venous blood
was collected. One aliquot of the blood was placed in a centrifuge
tube containing heparin, mixed and centrifuged at 5,000 × g
for 10 min. The supernatant, i.e., plasma, was obtained for western
blot analysis. Another aliquot of the venous blood was placed in a
centrifuge tube without heparin. After blood coagulation, the
supernatant obtained after removal of condensed blood clots was
serum, which was used for determining TG, TC, LDL, HDL, FBG and
fasting insulin (FINS). Early morning urine was obtained for
detecting urine protein, blood urea nitrogen (BUN) and serum
creatinine (Scr).
All subjects had a single fetus and did not suffer
from gestational diabetes, but experienced obstetric complications,
including impaired sugar tolerance, premature rupture of membranes
and placenta previa as well as a history of medical complications,
including chronic hypertension, diabetes mellitus, heart disease
and nephropathy.
Determination of TG, TC, LDL, HDL,
apoA-1, apoB, urine protein, BUN and Scr
The concentrations of TG, TC, LDL, HDL, apoA-1,
apoB, urine protein, BUN and Scr were measured in the serum using
the respective commercial kits. All measurements were performed
according to the manufacturer's instructions. An automatic
biochemistry analyzer (model 7600; Hitachi, Tokyo, Japan) was used
to record various indexes. TG, TC and LDL levels were measured via
the enzymatic method. HDL levels were detected by the polyanion
polymer/detergent assay. Levels of apoA-1 apoB were determined via
the immunoturbidimetric method. Urine protein, BUN and Scr contents
were detected by the enzymatic method. Creatinine clearance rate
(Ccr) was calculated as Ccr=[40-age (years)] × weight (kg)/[0.85 ×
Scr (µmol/l)].
Measurement of FBG and FINS
FBG was detected by the glucose oxidase method
following the manufacturer's instructions. The glucose
concentration was determined by the absorbance of known
concentrations of control blue substances at 625 nm wavelength.
The blood insulin level was detected by an
enzyme-linked immune chemiluminescence method with a human insulin
ELISA kit according to the manufacturer's instructions. To detect
FINS, samples, standard preparation and horseradish peroxidase
(HRP)-labeled detection antibody were added in micropores coated
with capture antibody one by one. After incubation at 37°C for 30
min, pores were washed thoroughly and antibodies were visualized
with a 3,3′,5,5′-tetramethylbenzidine substrate. Optical density
values were measured at 450 nm with automatic chemiluminescence
analyzer (DTX880 Multimode Plate Reader; Beckman Coulter, Inc.,
Brea, CA, USA), from which the insulin content in samples was
calculated.
Homeostasis model assessment
(HOMA)
Islet β cell function and the degree of insulin
resistance were evaluated via HOMA using the following formulas:
HOMA-IR=FINS × FBG/22.5; HOMA-insulin sensitivity index (ISI)=In
[22.5/(FBG × FINS)]; and HOMA-β cell function (β%)=20 ×
FINS/(FBG-3.5).
Determination of placental bed blood
flow parameters
Placental bed blood flow parameters, including the
ratio of the systolic maximum velocity and the end-diastolic
velocity (S/D), pulsatility index (PI), resistance index (RI) and
time averaged velocity (TAV) were measured with YF-E820 color
Doppler ultrasonic diagnosis apparatus (Sichuan Yufeng Technology
Development Co., Ltd., Mianyang, China) at the 32nd week of
gestation.
Western blot analysis
After fasting for 12 h overnight, 4 ml venous blood
was collected. The serum was separated and stored at −80°C until
analysis. The protein levels of IRS-1, p-IRS-1, AKT and p-AKT were
measured by western blot analysis as described previously (9). In brief, serum protein content was
quantified by a BCA kit. A total of 60 µg serum protein was
separated by 8–12% SDS-PAGE and transferred onto a polyvinylidene
fluoride membrane (EMD Millipore, Billerica, MA, USA). Following
blocking in 5% non-fat milk diluted with Tris-buffered saline with
Tween-20 (TBST; Tris-HCl 20 mM, NaCl 150 mM, pH 7.4, 0.1% Tween-20)
at room temperature for 45 min and then probed overnight at 4°C
with the following primary antibodies: β-actin, IRS-1, AKT (1:4,000
dilution), p-IRS-1 and p-AKT (1:1,000 dilution). Following washing
with TBST, membranes were incubated with the appropriate secondary
antibodies for 1 h at room temperature. The bands were developed
using an ECL chemiluminescence kit and then visualized by exposure
to X-ray film (Kodak, Rochester, NY, USA). The results were scanned
and analyzed using ImageJ software (version 1.48; National
Institutes of Health, Bethesda, MD, USA).
Evaluation of the degree of IR
The euglycemic-hyperinsulinemic clamp method was
used to evaluate the degree of IR. Intravenous injection of insulin
can cause hyperproinsulinemia. The insulin infusion speed was 127.6
mU/m3/min at the beginning, was reduced to 40
mU/m3/min 10 min later and maintained at this speed
until end of the test. The experiment lasted 2 h. When insulin was
infused for 20 min, the blood insulin concentrations increased from
14±1 to 105±5 mU/l and reached a steady state. The glucose was
infused 4 min after insulin infusion and the glucose levels were
monitored every 5 min. The infusion speed and concentration of
glucose were adjusted to prevent low blood glucose. The production
of liver endogenous glucose was inhibited by 90% when the
concentration of blood insulin was >50 mU/l. The blood glucose
was maintained at a normal level via mediating the exogenous
glucose at this time. The infusion amount of exogenous glucose was
equal to the processed amount of glucose by the body through the
action of insulin. So the body's sensitivity to insulin was
determined by the ratio of exogenous glucose and blood insulin.
Patients were diagnosed as having IR when the utilization of
glucose was <7.24 mg/kg/min.
Statistical analysis
Values are expressed as the mean ± standard
deviation. The correlation of p-IRS-1 and p-AKT with HOMA-IR,
HOMA-ISI and HOMA-β% was analyzed using the Spearman Rank
Correlation test. Comparisons between 2 groups were analyzed using
Student's t-test and the differences among 3 groups were
analyzed by analysis of variance followed by a post hoc comparison
using the least significant difference test (SPSS 19.0; SPSS IBM,
Armonk, NY, USA). P<0.05 was considered to indicate a
statistically significant difference.
Results
Clinical data of healthy control and
PIH groups
As shown in Table I,
there was no significant differences in average age between the two
groups (P>0.05); however, body mass index (BMI), SBP level and
DBP level in the PIH group were significantly higher than those in
the control group (P<0.01).
 | Table I.Clinical data on the healthy control
and PIH groups. |
Table I.
Clinical data on the healthy control
and PIH groups.
|
|
|
| BMI
(kg/m2) |
|
|
|---|
|
|
|
|
|
|
|
|---|
| Group | N | Age (years) | 4 weeks | 32 weeks | SBP (mmHg) | DBP (mmHg) |
|---|
| Control group | 50 | 26.8±3.2 | 20.74±2.32 | 26.6±3.34 | 112.6±12.5 | 75.6±7.4 |
| PIH group | 50 | 27.2±2.5 | 26.74±1.63 | 32.5±4.62 | 162.7±10.5 | 108.5±6.9 |
| P-value |
| 0.854 | 0.023 | 0.038 | 0.048 | 0.006 |
Differences in FBG, FINS, HOMA-IR,
HOMA-ISI and HOMA-β% between healthy control and PIH groups
As shown in Table
II, compared with the healthy control group, the FBG, FINS and
HOMA-IR in the PIH group were significantly increased, while the
HOMA-ISI and HOMA-β% were significantly reduced compared with those
in the control group (P<0.05).
| Table II.Differences in parameters between
healthy control and PIH groups. Significant differences in FBG,
FINS, HOMA-IR, HOMA-ISI and HOMA-β% were observed. |
Table II.
Differences in parameters between
healthy control and PIH groups. Significant differences in FBG,
FINS, HOMA-IR, HOMA-ISI and HOMA-β% were observed.
| Parameter | Control group
(n=50) | PIH group (n=50) | P-value |
|---|
| FBG (pmol/l) | 45.3±8.6 | 85.9±8.2 | <0.001 |
| FINS (mmol/l) | 8.23±1.92 | 15.78±1.35 | 0.022 |
| HOMA-IR | 1.63±0.58 | 4.34±0.76 | 0.014 |
| HOMA-β% | 225.49±19.02 | 136.58±25.42 | <0.001 |
| HOMA- ISI | −0.25±0.02 | −1.49±0.13 | <0.001 |
| TG (mmol/l) | 2.12±0.72 | 3.35±1.43 | 0.035 |
| TC (mmol/l) | 5.89±1.35 | 5.96±1.02 | 0.896 |
| LDL (mmol/l) | 2.09±0.52 | 3.02±0.42 | 0.014 |
| HDL (mmol/l) | 2.55±0.32 | 1.94±0.25 | 0.028 |
| apoB (pmol/l) | 1.01±0.04 | 1.18±0.06 | 0.041 |
| apoA-1 (pmol/l) | 2.69±0.12 | 2.01±0.11 | 0.036 |
| Urine protein (g/24
h) | 0.12±0.24 | 1.36±0.42 | 0.002 |
| BUN (mmol/l) | 5.10±1.03 | 7.73±1.15 | 0.039 |
| Scr (µmol/l) | 102.32±10.51 | 159.15±17.32 | 0.008 |
| Ccr (ml/min) | 90.23±12.32 | 55.33±8.36 | 0.004 |
Correlation of p-IRS-1 and p-AKT with
HOMA-IR, HOMA-ISI and HOMA-β% in the PIH group
As shown in Table
III, the correlation analyses revealed a negative correlation
between p-IRS-1 and HOMA-IR (P<0.01) but a positive correlation
between p-IRS-1 and HOMA-ISI (P<0.05). Similarly, there was a
negative correlation between p-AKT and HOMA-IR (P<0.01) but a
positive correlation between p-AKT and HOMA-ISI (P<0.05).
| Table III.Analysis of the correlation of p-IRS-1
and p-AKT with HOMA-IR and HOMA-ISI in PIH group. |
Table III.
Analysis of the correlation of p-IRS-1
and p-AKT with HOMA-IR and HOMA-ISI in PIH group.
|
| p-IRS-1 | p-AKT |
|
|---|
|
|
|
|
|
|---|
| Parameter | Correlation
coefficient | P-value | Correlation
coefficient | P-value |
|---|
| HOMA-IR | −0.473 | <0.01 | −0.520 | <0.01 |
| HOMA-ISI | 0.342 | <0.05 | 0.487 | <0.05 |
Differences in placental bed blood
flow parameters between IR and non-IR groups
Dlood flow parameters, including PI, RI, S/D and
TAV, were determined in all subjects using a color Doppler
ultrasonic diagnosis apparatus. As shown in Table IV, the results revealed that the PI,
RI and S/D in the IR group were significantly higher than those in
the non-IR group (P<0.05), while the TAV in the IR group was
significantly lower than that in the non-IR group (P<0.05).
| Table IV.Differences in placental bed blood
flow parameters between IR and non-IR groups. |
Table IV.
Differences in placental bed blood
flow parameters between IR and non-IR groups.
| Group | N | RI | PI | S/D | TAV |
|---|
| Non-IR group | 30 | 0.43±0.05 | 0.62±0.09 | 1.75±0.25 | 15.33±1.72 |
| IR group | 70 | 0.67±0.12 | 0.92±0.07 | 2.78±0.36 | 9.86±2.47 |
| P-value |
| <0.05 | <0.05 | <0.05 | <0.05 |
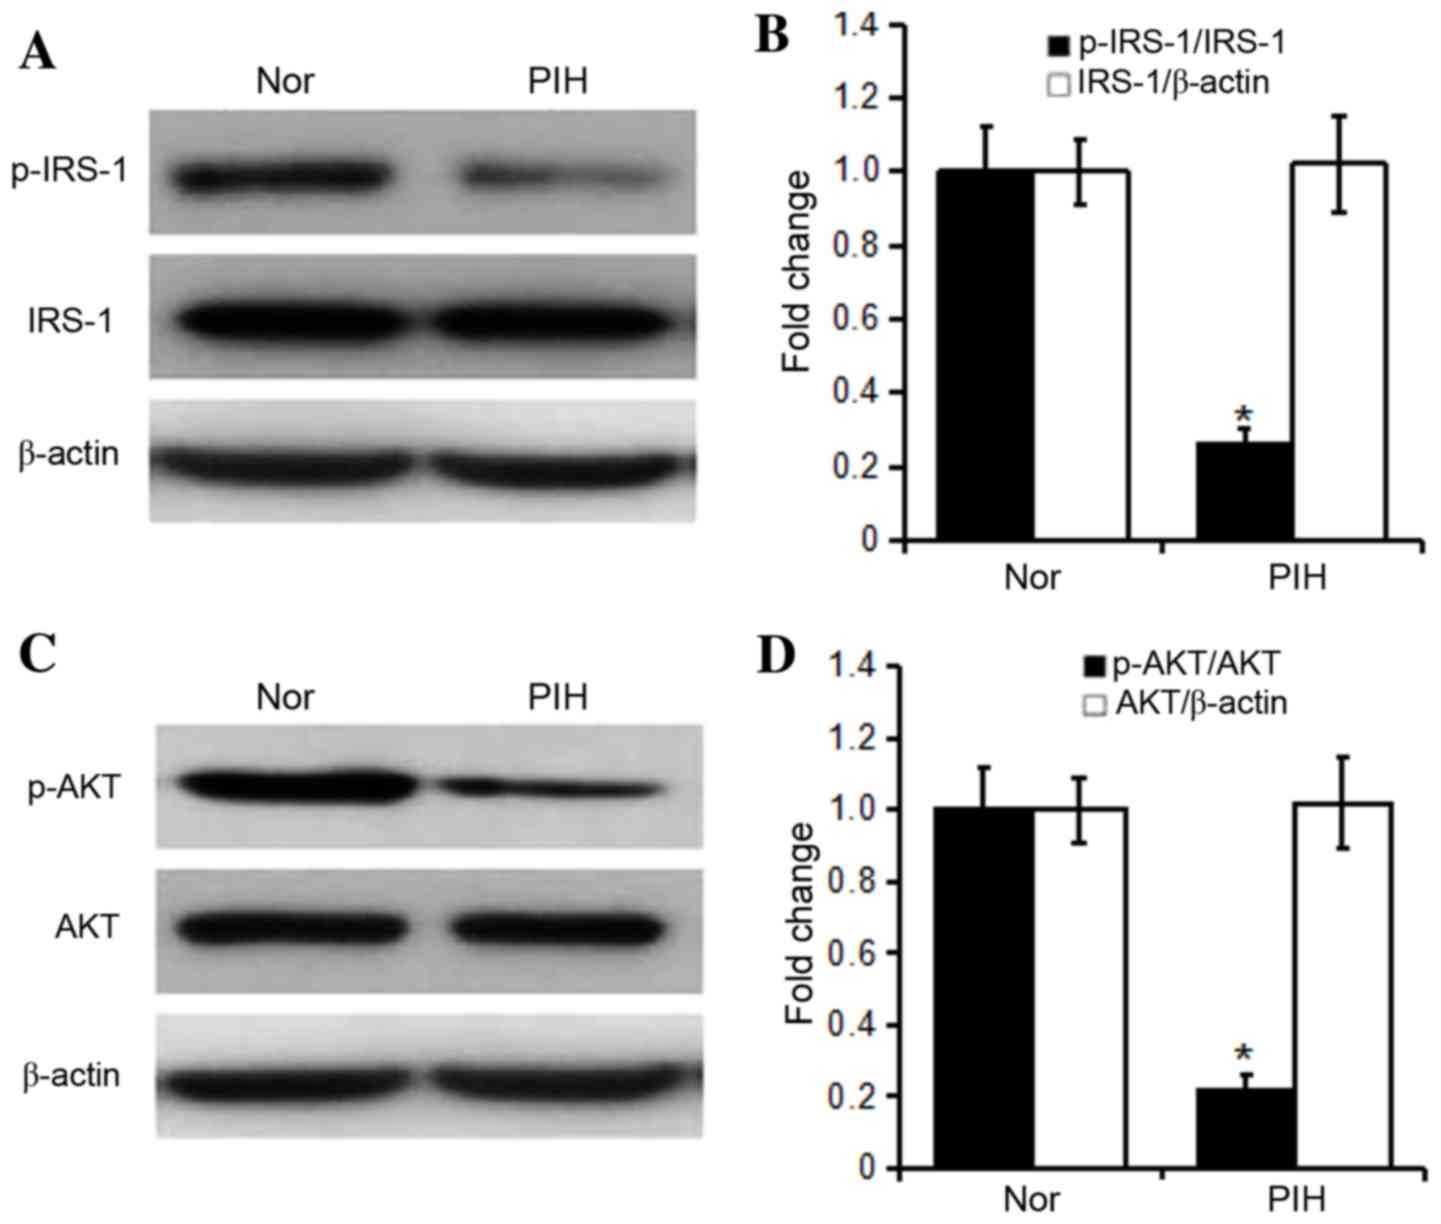
Differences in protein expression of
IRS-1, p-IRS-1, AKT and p-AKT in the plasma between healthy control
and PIH groups
As shown in Fig. 1,
the levels of total IRS-1 and AKT were not significantly different
between healthy control and PIH groups (P>0.05), but the levels
of p-IRS-1 and p-AKT and the p-IRS-1/IRS-1 and p-AKT/AKT ratios in
the PIH group were significantly reduced compared with those in the
healthy control group (P<0.05).
Discussion
For fetal development and post-natal breastfeeding,
the secretion of cytokines (such as leptin, adiponectin, visceral
fatty acids and resistin) by adipose tissue increases under the
influence of progesterone and placental lactogen, but the ability
to synthesize them decreases, so that normal pregnant women present
with hyperlipidemia (12–15). In the present study, serum TC, TG and
LDL increased in normal pregnant women, but HDL and apoA-1
decreased, so that each index was maintained at a normal level
(16–18). However, the levels of TG, LDL and
apoB were higher in pregnant women with gestational hypertension
compared with the normal group, but HDL and apoA-1 levels were
diminished in pregnant women with gestational hypertension. The
results also demonstrated that urine protein, BUN and Scr levels
were higher in patients with gestational hypertension compared with
the normal group. All these findings suggested that gestational
hypertension led to abnormal lipid metabolism (19,20).
Studies have confirmed that insulin regulates lipid
metabolism and carbohydrate uptake (21,22).
Insulin resistance reduces the sensitivity of adipocytes, myocytes
and hepatocytes to insulin, promotes glucose uptake, weakens the
antilipolytic capability, further resulting in compensatory
hyperinsulinemia and the release of fatty acids into the blood to
then cause hyperglycemia combined with hyperinsulinism and lipid
metabolism disorder (23). The body
is insulin resistant through signal transduction by the insulin
receptor and autophosphorylation. At least eight tyrosine residues
on IRS-1 can be phosphorylated by insulin receptor tyrosine kinase.
p-IRS-1 can bind to and activate downstream effectors, participates
in the signal transduction of various hormones and cytokines, has
an important role in cell growth, differentiation and metabolism,
and simultaneously maintains a metastable state of insulin and
blood sugar levels (24–26). The increase in p-IRS-1 contributes to
the transduction of insulin signaling, weakens insulin resistance
and reduces blood sugar. The phosphoinositide-3 kinase (PI3K)-AKT
signaling pathway has a crucial effect on mediating
insulin-stimulated glucose transport. The decreased p-AKT level can
enhance glucose transport capacity, weaken insulin resistance and
diminish free blood sugar levels. In addition, PI3K-AKT is involved
in free fatty acid synthesis (27).
Simultaneously, free fatty acid suppresses insulin binding to its
receptor and aggravates insulin resistance (28). The results of the present study
showed that the BMI, TG, TC, FBG and FINS were greater in the PIH
group than those in the normal control group. Compared with the
normal control group, HOMA-IR was increased and HOMA-ISI was
decreased in the PIH group. Phosphorylation levels of IRS-1 and AKT
were significantly lower in the PIH group compared with those in
the normal control group. Moreover, p-IRS-1 and p-AKT were
negatively correlated with HOMA-IR, while being positively
associated with HOMA-ISI. The above results indicated that PIH
possibly occurs due to the following reasons: Downregulation of
IRS-1 phosphorylation leads to reduced activation of signaling
pathways downstream of insulin, which causes blood sugar levels to
increase. The reduction in AKT phosphorylation levels induces a
decline in glucose transporter function, which results in increased
blood sugar levels and lipid metabolism disorder. Moreover, the
decreased phosphorylation levels of IRS-1 and AKT elevate HOMA-IR
and decrease HOMA-ISI, further suggesting that insulin resistance
is one of the major reasons for PIH occurrence.
In conclusion, the present study indicated that
insulin resistance may be a key factor causing PIH and may provide
novel therapeutic approaches for PIH.
References
|
1
|
Salge AK, Xavier RM, Ramalho WS, Rocha EL,
Coelho AS, Guimarães JV, Siqueira KM, Abdalla DR, Michelin MA and
Murta EF: Placental and umbilical cord macroscopic changes
associated with fetal and maternal events in the hypertensive
disorders of pregnancy. Clin Exp Obstet Gynecol. 40:198–202.
2013.PubMed/NCBI
|
|
2
|
Flores KF, Robledo CA, Hwang BS, Leishear
K, Grantz Laughon K and Mendola P: Does maternal asthma contribute
to racial/ethnic disparities in obstetrical and neonatal
complications? Ann Epidemiol. 25:392–397. 2015. View Article : Google Scholar : PubMed/NCBI
|
|
3
|
Yang JJ, Lee SA, Choi JY, Song M, Han S,
Yoon HS, Lee Y, Oh J, Lee JK and Kang D: Subsequent risk of
metabolic syndrome in women with a history of preeclampsia: Data
from the health examinees study. J Epidemiol. 25:281–288. 2015.
View Article : Google Scholar : PubMed/NCBI
|
|
4
|
Walker CK, Krakowiak P, Baker A, Hansen
RL, Ozonoff S and Hertz-Picciotto I: Preeclampsia, placental
insufficiency, and autism spectrum disorder or developmental delay.
JAMA Pediatr. 169:154–162. 2015. View Article : Google Scholar : PubMed/NCBI
|
|
5
|
Katulski K, Czyzyk A, Podfigurna-Stopa A,
Genazzani AR and Meczekalski B: Pregnancy complications in
polycystic ovary syndrome patients. Gynecol Endocrinol. 31:87–91.
2015. View Article : Google Scholar : PubMed/NCBI
|
|
6
|
Rahmanian M, Salari Z, Mirmohammadkhani M
and Ghorbani R: Is the sex hormone binding globulin related to
preeclampsia independent of insulin resistance? J Pak Med Assoc.
64:640–643. 2014.PubMed/NCBI
|
|
7
|
Tuuri AL, Jauhiainen MS, Tikkanen MJ and
Kaaja RJ: Systolic blood pressure and fatty acid-binding protein 4
predict pregnancy-induced hypertension in overweight nulliparous
women. Placenta. 35:797–801. 2014. View Article : Google Scholar : PubMed/NCBI
|
|
8
|
Abhari FR, Andarieh Ghanbari M, Farokhfar
A and Ahmady S: Estimating rate of insulin resistance in patients
with preeclampsia using HOMA-IR index and comparison with
nonpreeclampsia pregnant women. Biomed Res Int. 2014:1408512014.
View Article : Google Scholar : PubMed/NCBI
|
|
9
|
Zhang H, Zhao D, Shen J, Zhou X, Chen W
and Jiang S: Evaluation of oral glucose tolerance test, β-cell
function and adverse obstetric outcomes. Biomed Rep. 1:807–811.
2013.PubMed/NCBI
|
|
10
|
Report of the national high blood pressure
education program working group on high blood pressure in
pregnancy. Am J Obstet Gynecol. 183:S1–S22. 2000. View Article : Google Scholar
|
|
11
|
Cunningham FG, Gant NF, Leveno KJ,
Gilstrap LC, Hauth JC, Wenstrom KD, Werner CL and Cox SM: Williams
Obstetrics. 21st. McGraw-Hill; New York, NY: 2001
|
|
12
|
Sahasrabuddhe A, Pitale S, Raje D and
Sagdeo MM: Cord blood levels of insulin and glucose in full-term
pregnancies. J Assoc Physicians India. 61:378–382. 2013.PubMed/NCBI
|
|
13
|
Mastrogiannis DS, Spiliopoulos M, Mulla W
and Homko CJ: Insulin resistance: The possible link between
gestational diabetes mellitus and hypertensive disorders of
pregnancy. Curr Diab Rep. 9:296–302. 2009. View Article : Google Scholar : PubMed/NCBI
|
|
14
|
Garcés MF, Peralta JJ, Ruiz-Linares CE,
Lozano AR, Poveda NE, Torres-Sierra AL, Eslava-Schmalbach JH,
Alzate JP, Sánchez AY, Sanchez E, et al: Irisin levels during
pregnancy and changes associated with the development of
preeclampsia. J Clin Endocrinol Metab. 99:2113–2119. 2014.
View Article : Google Scholar : PubMed/NCBI
|
|
15
|
Huda SS, Forrest R, Paterson N, Jordan F,
Sattar N and Freeman DJ: In preeclampsia, maternal third trimester
subcutaneous adipocyte lipolysis is more resistant to suppression
by insulin than in healthy pregnancy. Hypertension. 63:1094–1101.
2014. View Article : Google Scholar : PubMed/NCBI
|
|
16
|
Tran M, Gallo LA, Hanvey AN, Jefferies AJ,
Westcott KT, Cullen-McEwen LA, Gardner DK, Moritz KM and Wlodek ME:
Embryo transfer cannot delineate between the maternal pregnancy
environment and germ line effects in the transgenerational
transmission of disease in rats. Am J Physiol Regul Integr Comp
Physiol. 306:R607–R618. 2014. View Article : Google Scholar : PubMed/NCBI
|
|
17
|
Valdés E, Sepúlveda-Martínez A, Manukián B
and Parra-Cordero M: Assessment of pregestational insulin
resistance as a risk factor of preeclampsia. Gynecol Obstet Invest.
77:111–116. 2014. View Article : Google Scholar : PubMed/NCBI
|
|
18
|
Lampinen KH, Rönnback M, Groop PH,
Nicholls MG, Yandle TG and Kaaja RJ: Increased plasma
norepinephrine levels in previously pre-eclamptic women. J Hum
Hypertens. 28:269–273. 2014. View Article : Google Scholar : PubMed/NCBI
|
|
19
|
Scioscia M, Nigro M and Montagnani M: The
putative metabolic role of d-chiro inositol phosphoglycan in human
pregnancy and preeclampsia. J Reprod Immunol. 101–102:140–147.
2014. View Article : Google Scholar
|
|
20
|
Tuuri AL, Jauhiainen MS, Ehnholm CP,
Tikkanen MJ, Nicholls MG and Kaaja RJ: Elevated serum
angiopoietin-like protein 6 in women with subsequent
pregnancy-induced hypertension: A preliminary study. Hypertens
Pregnancy. 32:203–213. 2013. View Article : Google Scholar : PubMed/NCBI
|
|
21
|
Harper LM, Renth A, Cade WT, Colvin R,
Macones GA and Cahill AG: Impact of obesity on maternal and
neonatal outcomes in insulin-resistant pregnancy. Am J Perinatol.
31:383–388. 2014.PubMed/NCBI
|
|
22
|
Romero J and Spinedi E: Two-hour
insulinemia after oral glucose overload and women at risk of
pregnancy-induced hypertensive disorders. Hypertens Pregnancy.
32:355–366. 2013. View Article : Google Scholar : PubMed/NCBI
|
|
23
|
Oxenkrug G: Insulin resistance and
dysregulation of tryptophan-kynurenine and kynurenine-nicotinamide
adenine dinucleotide metabolic pathways. Mol Neurobiol. 48:294–301.
2013. View Article : Google Scholar : PubMed/NCBI
|
|
24
|
Duehlmeier R, Noldt S and Ganter M:
Pancreatic insulin release and peripheral insulin sensitivity in
German black headed mutton and Finish Landrace ewes: Evaluation of
the role of insulin resistance in the susceptibility to ovine
pregnancy toxemia. Domest Anim Endocrinol. 44:213–221. 2013.
View Article : Google Scholar : PubMed/NCBI
|
|
25
|
Duehlmeier R, Fluegge I, Schwert B and
Ganter M: Insulin sensitivity during late gestation in ewes
affected by pregnancy toxemia and in ewes with high and low
susceptibility to this disorder. J Vet Intern Med. 27:359–366.
2013. View Article : Google Scholar : PubMed/NCBI
|
|
26
|
Kayemba-Kay's S, Peters C, Geary MP, Hill
NR, Mathews DR and Hindmarsh PC: Maternal hyperinsulinism and
glycaemic status in the first trimester of pregnancy are associated
with the development of pregnancy-induced hypertension and
gestational diabetes. Eur J Endocrinol. 168:413–418. 2013.
View Article : Google Scholar : PubMed/NCBI
|
|
27
|
Smith GN, Pudwell J, Walker M and Wen SW:
Risk estimation of metabolic syndrome at one and three years after
a pregnancy complicated by preeclampsia. J Obstet Gynaecol Can.
34:836–841. 2012. View Article : Google Scholar : PubMed/NCBI
|
|
28
|
Spaan JJ, Sep SJ, van Balen VL,
Spaanderman ME and Peeters LL: Metabolic syndrome as a risk factor
for hypertension after preeclampsia. Obstet Gynecol. 120:311–317.
2012. View Article : Google Scholar : PubMed/NCBI
|