Introduction
Tumor necrosis factor (TNF)-α inhibitors (TNFi) have
proven efficacy in the treatment of active rheumatoid arthritis
(RA) and other chronic inflammatory diseases (1–5).
Different forms of TNFi have been marketed, such as the monoclonal
antibodies (mAbs) to TNF, infliximab and adalimumab or the soluble
receptor etanercept. Infliximab is a chimeric murine anti-TNF mAb
with an Fc domain from human IgG1 and adalimumab is a completely
humanized anti-TNF mAb of the IgG1 isotype (1,3,6). Etanercept is a soluble TNF receptor
fusion protein consisting of a dimer of the extracellular domain of
the human p75 TNF receptor (CD120b) combined with human Fc and
hinge regions from IgG1 (1,5). Each of these three TNFi can bind to
soluble and membrane-bound forms of TNF and by virtue of their IgG1
Fc domains, the mAbs mediate cell killing either by the activation
of complement or by apoptosis, whereas the soluble receptor acts to
neutralize TNF. Importantly, the preponderance of evidence suggests
that etanercept and adalimumab are weakly immunogenic, whereas the
reports for infliximab are variable with frequencies from zero to
over half of patients developing anti-chimeric antibodies depending
on the dose of therapy (1,3,5,6).
After several months of treatment with TNFi, reduced
levels of autoantibodies associated with RA, such as rheumatoid
factor (RF) and anti-citrullinated peptides or proteins (anti-CCP)
antibodies, are detected in the serum (7–9). The
reduced levels of RA-associated autoantibodies correlate with
improved clinical measures. Although the mechanisms are not
completely understood, TNFi are likely to downregulate inflammatory
cytokines and localized apoptosis in the rheumatoid synovium, which
could limit the availability of autoantigen for the generation of
RF and anti-CCP antibodies (10).
A side effect of TNFi is the induction of new
autoantibodies such as anti-nuclear antibodies (ANAs) and
anti-double stranded DNA (anti-dsDNA) antibodies (3,11–14).
These antibodies are thought to be induced by an upregulation of
B-cell responses in the absence of TNF and the antigen specificity
driven by increased apoptosis in the periphery, which might also be
related to an inability to clear dead cells. The downregulation of
C-reactive protein might contribute to the lack of clearance of
cell debris and might further promote autoreactivity in the
periphery (15). The development of
ANAs is common in patients after treatment with infliximab, with
reports of one-third to >90% of patients converting to ANA
positivity compared with approximately half of patients treated
with etanercept converting to ANA positivity (3,13). While
less data exists on adalimumab, the data available are similarly
variable in reported percentages (12). Anti-dsDNA generation is present in
most TNFi-treated patients at half the rate of ANA induction.
Widely variable reported rates could in part be a reflection of the
differences in methods used for autoantibody assays by clinical
laboratories. Notably, the development of ANA or anti-dsDNA
autoantibodies is only rarely associated with the development of
other lupus-associated antibodies or clinical evidence of
lupus-like syndrome in RA patients (3).
Gene expression profiles of whole blood or
peripheral blood mononuclear cell (PBMC) subsets obtained from RA
patients before and after treatment with TNFi have been reported by
several investigators (16–22). The focus of these studies has been on
the identification of a gene expression profile that correlates
with a clinical response to TNFi therapy. The aim of the present
study was to examine the gene expression profile of patients with
RA converting to an ANA-positive phenotype after TNFi treatment.
Thus, the present pilot study was carried out in order to determine
whether shifts in transcriptional profiles after only 3 months of
TNFi treatment that correlated with ANA-positive conversion could
be detected. The focus was on differences in effector pathways,
such as cell adhesion and cytokines, which might be predicted to be
altered after TNFi treatment.
Materials and methods
Patients
The study protocol was approved by the Institutional
Review Board of the University of Texas Southwestern Medical Center
(Dallas, TX, USA). Written informed consent was obtained from
patients with RA whose physician had made the clinical decision to
begin a TNFi drug for the first time. All RA patients fulfilled the
American College of Rheumatology 1987 classification criteria for
RA (23). The patient's age, gender,
duration of RA and disease activity score (DAS-28) were recorded
(24). Peripheral blood was
collected at each visit in heparinized tubes for the isolation of
PBMCs and serum was collected before and after TNFi therapy with
etanercept (n=6), infliximab (n=4) and adalimumab (n=1).
Autoantibody levels were determined in routine assays carried out
by the hospital. ANAs were determined by ImmunoFluorescence
Antibody (IFA) assay and levels reported as titers using an ANA
test system with IFA slides containing epithelial cells transfected
with specific target DNA sequences. All reagents and controls were
purchased from Immuno Concepts (immunoconcepts.com), including Fluorescent Hep-2000
ANA Slides (2040-Ro), SSA/Ro positive control (2035-Ro), titratable
control serum (2026), negative control serum (2031) and fluorescent
antibody reagent (3009). Patient serum was screened for antibodies
to nuclear antigens and results were visualized by fluorescent
microscopy. RF was assayed by nephelometry (turbidimetry) and
reported as IU/ml using a particle-enhanced immunoassay with
latex-bound heat inactivated IgG, which was bound by RF antibodies
in patient serum to form antigen-antibody complexes. The resulting
agglutination reaction was read on a Siemens Advia 1200 System
(Siemens Healthcare Diagnostics, Inc., Tarrytown, NY, USA) using
methods previously reported in detail (25,26).
Values <15 IU/ml were considered to be normal (negative) for RF.
Anti-CCP antibody levels were determined by a routine ELISA (QUANTA
Lite CCP3 IgG/IgA kit; 704550; Inova Diagnostics; inovadx.com) for IgG and IgA and reported as U/ml.
Briefly, anti-CCP antibodies in patient serum were bound to wells
of a microtiter plate coated with synthetic CCP, washed to remove
unbound serum components and subsequently treated with anti-human
IgG/IgA antibody labeled with horse radish peroxidase. The anti-CCP
was detected by the addition of a substrate, such as 3,3′,5,5′
tetramethylbenzidine, and the color was read using an ELISA plate
reader. Values <5 U/ml were considered to be negative. Details
regarding the contribution of this assay to the diagnosis of RA
have been detailed elsewhere (27–29).
PBMC RNA preparation, chip
hybridization and analysis
Peripheral blood samples were collected in
heparinized tubes in order to obtain PBMCs and processed using a
rapid density-gradient centrifugation over Ficoll-Hypaque as
previously described (30). PBMCs
were immediately centrifuged and total cellular RNA was prepared
from PBMCs in TRIzol (Invitrogen; Thermo Fisher Scientific, Inc.,
Waltham, MA, USA) and the samples were frozen at −80°C until
further processing by the microarray core of University of Texas
Southwestern Medical Center (30).
The RNA extraction, microarray analysis and quality control steps
were performed following validated protocols of the Immunology DNA
Microarray Core (microarray.swmed.edu). Purified RNA was extracted over
RNeasy Qiagen columns (Qiagen, Inc., Valencia, CA, USA) (30). RNA samples that were limited in
amount or did not pass the quality control check on the bioanalyzer
were excluded from further analysis. cRNA was hybridized onto
Illumina chips (Illumina, Inc., San Diego, CA, USA) using the
standard protocols according to the manufacturer's
instructions.
Data was processed with BeadStudio 1.5.0.34 software
(Illumina, Inc.) and differentially expressed genes were identified
using GeneSpring 7.3.1 Analysis Platform software (Agilent
Technologies, Inc., Redwood City, CA, USA) (30). Data from each array was normalized
and routine filtering was carried out to exclude absent and low
signals. In addition, the cross-gene error model was applied to
filter for reliable genes by control strength. Out of 48,000 probe
sets, 32,074 passed filtering criteria for the Human WG-6 BeadChips
and 26,993 of 48,701 probe sets passed filtering criteria for the
Human V2 BeadChips.
To maintain consistency in nomenclature for various
analyses, transcripts are annotated using gene symbols to identify
transcripts. Data on specific genes, transcripts and proteins were
gathered from a variety of sources as referenced, and from public
databases, including DAVID Functional Annotation Bioinformatics
Microarray Analysis (david.ncifcrf.gov), ArrayExpress (ebi.ac.uk/arrayexpress), Human GeneCards (genecards.org) and OMIM (omim.org/). Unless
otherwise indicated, a 1.5-fold change (FC) between pre- and
post-cutoff was set to identify differentially regulated
transcripts in the analyses described (30).
Statistical analysis
Data was subjected to statistical analysis including
one-way analysis of variance (ANOVA), Welch's t -test or
Mann Whitney t-test as indicated in combination with
multiple testing corrections such as the Benjamini and Hochberg
(BH) false discovery rate (P<0.05) or the Bonferroni family-wise
error rate (P<0.05) to control for genes that might appear in
the analysis by chance as indicated in the results. Data are
presented as the normalized mean signal intensity (MSI) or as the
relative percentage of normalized data for the comparison of gene
expression (GE) levels after therapy to those before therapy
(post-therapy MSI/pre-therapy MSI × 100; before therapy GE=100%)
were presented graphically using GraphPad Prism version 6 Software
(GraphPad Software, Inc., San Diego, CA, USA).
Results
Alterations in RA leukocyte
transcriptomes after TNFi therapy
The patients with RA comprised 8 females and 3 males
with a mean disease duration of 9 years. Serum was assessed for RF,
anti-CCP antibodies and ANAs using standard clinical assays. As
shown in Table I, of the 11 RA
patients assessed, all were positive for RF, 9 were positive for
anti-CCP antibodies and all were ANA-negative at the initiation of
the study. After at least 3 months of TNFi treatment, 6 patients
converted to ANA positivity. Initial analysis of transcripts from
samples taken from patients with RA converting to ANA-positive
after 3 months on TNFi therapy identified 112 transcripts that were
differentially regulated with a change of >1.5 fold in
expression after TNFi treatment compared with before. Of these, 42
transcripts were upregulated and 70 were downregulated following
the initiation of therapy. Of the 112 transcripts, 64 were
statistically significant by ANOVA. Of the 64, 52 transcripts
passed the Benjamini and Hochberg multiple testing correction and
17 differentially regulated transcripts were significant when the
stringent Bonferroni correction was applied, including several
expressed sequence tags that were not studied further.
 | Table I.Characteristics of RA patients
treated with anti-TNF inhibitors. |
Table I.
Characteristics of RA patients
treated with anti-TNF inhibitors.
| Patient no. | Age (years) | Gender | Years of RA | RF (IU/ml) | Anti-CCP
(U/ml) | Anti-TNF |
|---|
| ANA negative |
|
|
|
|
|
|
|
101 | 57 | F | 13 | 171 | >100 |
Etanercept |
|
102 | 36 | F | 6 | 27 | 16 |
Etanercept |
|
104 | 30 | F | 3 | 444 | ND |
Etanercept |
|
105 | 58 | M | 7 | 357 | ND |
Infliximab |
|
106 | 64 | M | 15 | 56 | 143 |
Etanercept |
|
Average | 49 | 3:2 | 8.8 | 211 | 86.3 |
|
| ANA positive |
|
|
|
|
|
|
|
103 | 50 | F | 2 | 2260 |
100 | Adalimumab |
|
107 | 59 | F | 29 | 296 | 58 |
Etanercept |
|
108 | 79 | M | 2 | 244 | 93 |
Infliximab |
|
109 | 70 | F | 10 | 150 | >100 |
Etanercept |
|
110 | 54 | F | 1 | 46 | >100 |
Infliximab |
|
111 | 51 | F | 11 | 802 | >100 |
Infliximab |
|
Average | 60.5 | 5:1 | 9.2 | 633 | 91.8 |
|
The proteins encoded by the most differentially
expressed transcripts were not well-known immunoregulatory
molecules, but were molecules involved in cell adhesion, cell
stress and the metabolome. For example, two patients (nos. 107 and
108) displayed increased expression levels of five transcripts
before treatment as compared with the expression levels in the
remainder of the samples (Fig. 1).
These included transcripts for vezatin (VEZT) and ephrin
receptor A3 (EPHA3) that encode proteins involved in cell
adhesion; protein tyrosine phosphatase, non-receptor type 7
(PTPN7) that encodes for a phosphatase regulating macrophage
mitogen-activated protein kinases (MAPK) and TNF production;
max-like dimerization protein X (MLX) that encodes for a
stress sensor as part of the MYC/MAX/MLX network; and acyl-CoA
thioesterase 8 (ACOT8) that encodes for an enzyme that
regulates lipid metabolism. Expression of these transcripts was
downregulated after TNFi therapy for all ANA-positive patients and
markedly downregulated in two ANA-positive patients as illustrated
in Fig. 1. Other phosphatases, for
example many of the dual specificity phosphatase (DUSP) family
members including DUSP3 (Fig.
1), were expressed at lower levels than PTPN7 and did
not demonstrate the marked up- or downregulation observed for
PTPN7 in the ANA-positive patient samples. These transcripts
were detected at lower levels in the remaining RA patient samples,
suggesting that the two RA patients might represent a unique
subgroup of ANA-positive converters or might have had much more
active disease at the time of collection of the pre-treatment
samples. However, following the initiation of TNFi therapy a marked
reduction in expression was observed in contrast to other expressed
genes. The remaining differentially regulated transcripts exhibited
a dynamic pattern and included DnaJ (Hsp40) homolog, subfamily C,
member 7 (DNAJC7), β-parvin (PARVB),
palmitoyl-protein thioesterase 1 (PPT1), ras-related protein
rab-5C (RAB5C) and retinol binding protein 3, interstitial
(RBP3) in all of the ANA-positive samples after TNFi therapy
(Fig. 2). The ANA-negative RA
patient samples expressed low levels of these transcripts with no
statistically significant differences in gene expression between
before vs. after TNFi therapy groups, although there was a
consistent trend toward downregulation of transcripts as shown in
Fig. 2.
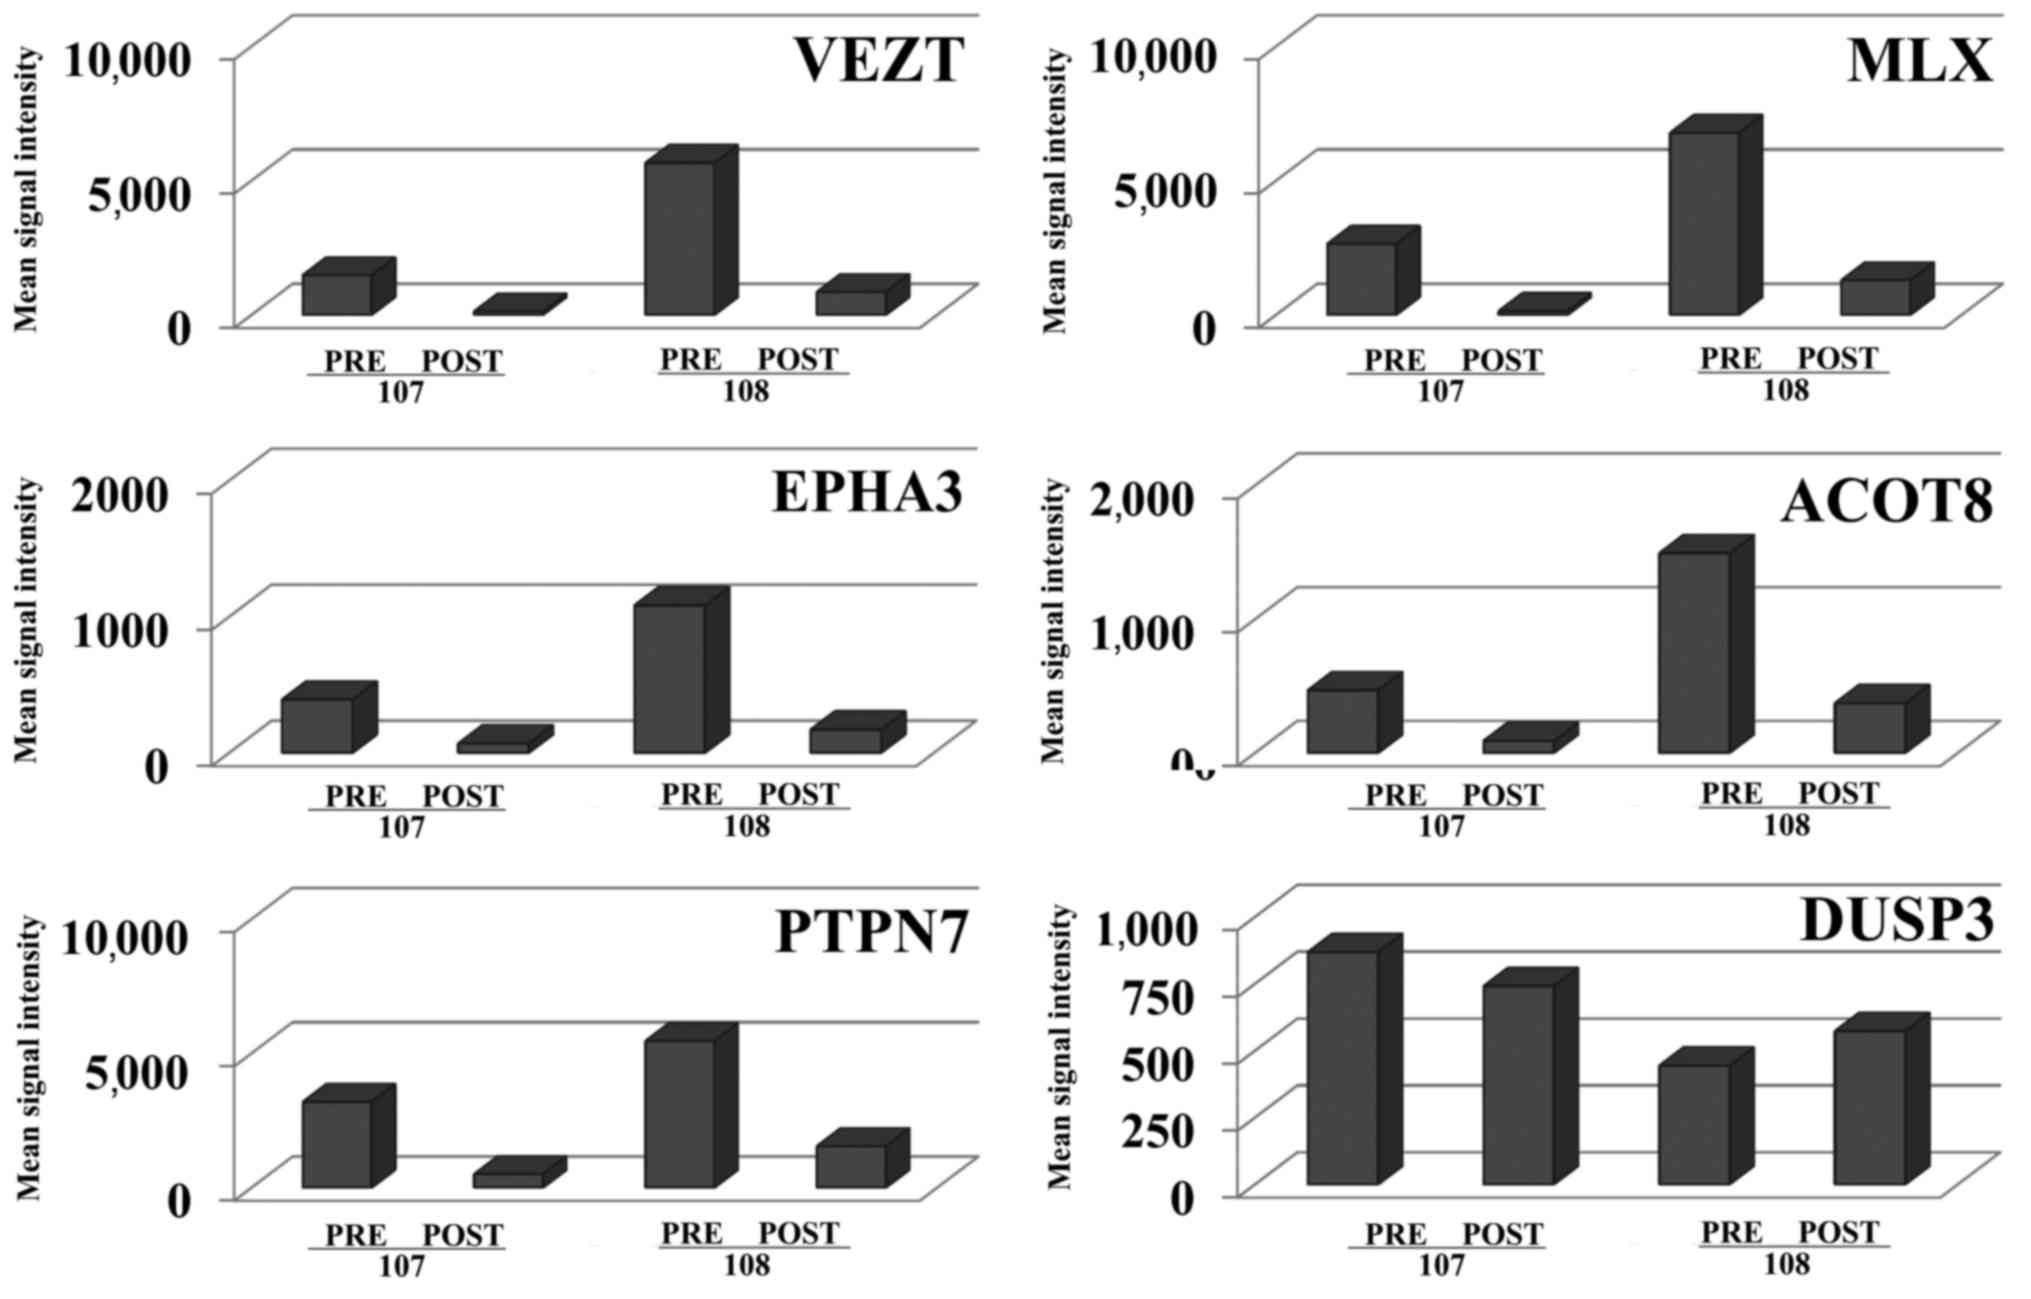 | Figure 1.Transcripts demonstrating highly
differential expression were linked to cell adhesion, cell stress
and the metabolome. Transcripts that were expressed at increased
levels in ANA-positive RA patients and were strongly downregulated
in samples taken after tumor necrosis factor inhibitor therapy in
two RA patients (nos. 107 and 108) are shown. Differential
expression of transcripts for all ANA-positive converters included
ACOT8 (4.27-FC), DNAJC7 (2.9 FC), EPHA3 (6.28 FC), MLX (6.57 FC),
PARVB (4.46), PPT1 (3.2 FC), PTPN7 (4.23 FC), RAB5C (4.45), RBP3
(3.23 FC) and VEZT (7.28 FC). Pre, prior to therapy; Post, after
therapy; ANA, anti-nuclear antibody; FC, fold change; ACOT,
acyl-CoA thioesterase 8; DNAJC7, DnaJ (Hsp40) homolog, subfamily C,
member 7; EPHA3, ephrin receptor A3; MLX, max-like dimerization
protein X; PARVB, β-parvin; PPT1, palmitoyl-protein thioesterase 1;
PTPN7, protein tyrosine phosphatase, non-receptor type 7; RAB5C,
ras-related protein rab-5C; RBP3, retinol binding protein 3,
interstitial; VEZT, vezatin. |
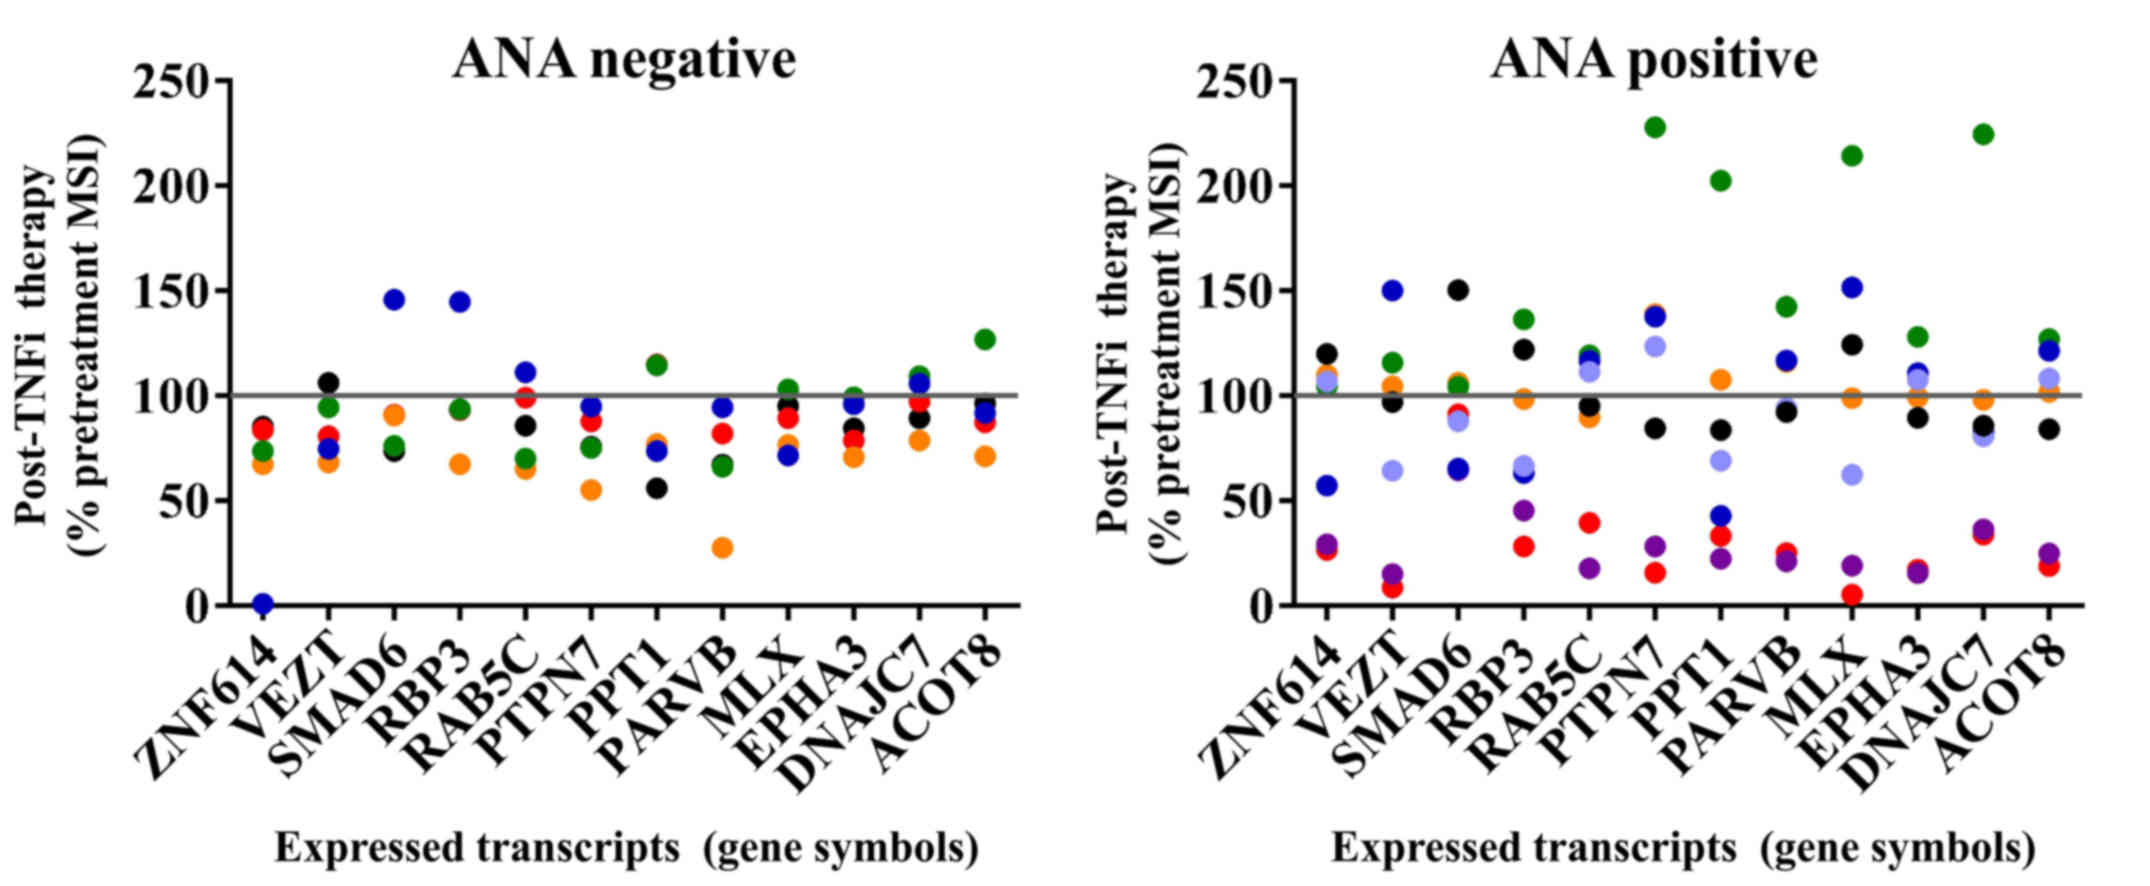 | Figure 2.Dynamic gene expression profiles in
ANA-positive RA samples were observed after TNFi therapy. Post
treatment gene expression levels are expressed as the percentage
MSI of pre-treatment levels in individual patient samples. The
ANA-negative RA patient samples expressed low levels of these
transcripts with no statistically significant differences in gene
expression, although this group trended toward downregulation after
therapy. A line at the 100 percent mark indicates the pre-treatment
levels for each sample. Key to color points: ANA negative group:
Patient 101 is black, 102 is red, 104 is orange, 105 is green and
106 is blue. ANA positive group: Patient 103 is black, 107 is red,
108 is mauve, 109 is orange, 110 is green and two post-treatment
visits are shown for patient 111, visit 1 blue and visit 2
periwinkle. ANA, anti-nuclear antibody; RA, rheumatoid arthritis;
TNFi, tumor necrosis factor inhibitor; MSI, mean signal intensity;
ZNF614, zinc finger protein 614; VEZT, vezatin; RBP3, retinol
binding protein 3, interstitial; RAB5C, ras-related protein rab-5C;
PTPN7, protein tyrosine phosphatase, non-receptor type 7; PPT1,
palmitoyl-protein thioesterase 1; PARVB, β-parvin; MLX, max-like
dimerization protein X; EPHA3, ephrin receptor A3; DNAJC7, DnaJ
(Hsp40) homolog, subfamily C, member 7; ACOT8, acyl-CoA
thioesterase 8. |
No correlation exists between ANA
subgroups and transcriptional profiles associated with responders
to TNFi therapy
Subsequently, an ‘eight gene signature’ was analyzed
that has previously been shown to predict clinical responders to
infliximab for patients with RA in a study by Julia et al
(21). In the present study, 5 of
the 8 predictive transcripts were detected, including interleukin 2
receptor β (IL2RB), granulysin (GNLY), solute carrier
family 2 (facilitated glucose transporter), member 3
(SLC2A3; also known as GLUT3), cathelicidin
antimicrobial peptide (CAMP) and toll-like receptor 5
(TLR5) in both ANA-positive and ANA-negative subsets of RA
patient samples as shown in Fig. 3.
There were no significant differences between the before and after
treatment groups. Levels of the other three predictive ‘responder
transcripts’, max dimerization protein 4 (MXD4), SH2 domain
containing 1B (SH2D1B) or major histocompatibility complex,
class II, DR beta 3 (HLA-DRB3) were below the threshold
settings for the analyses. Significant levels of HLA-DRB3
transcripts were detected in one ANA-negative RA patient sample,
and for this patient HLA-DRB3 transcript levels decreased
following TNFi therapy (2381 pre-therapy vs. 1848 post-therapy
MSI). Overall, these transcripts were similar to the majority of
expressed transcripts in that lower expression levels were detected
by the probe sets in most patients initially and there was a trend
toward downregulation of transcripts in the ANA-negative samples
whilst the ANA-positive samples demonstrated a varied or dynamic
pattern of transcript levels between the before and after therapy
samples.
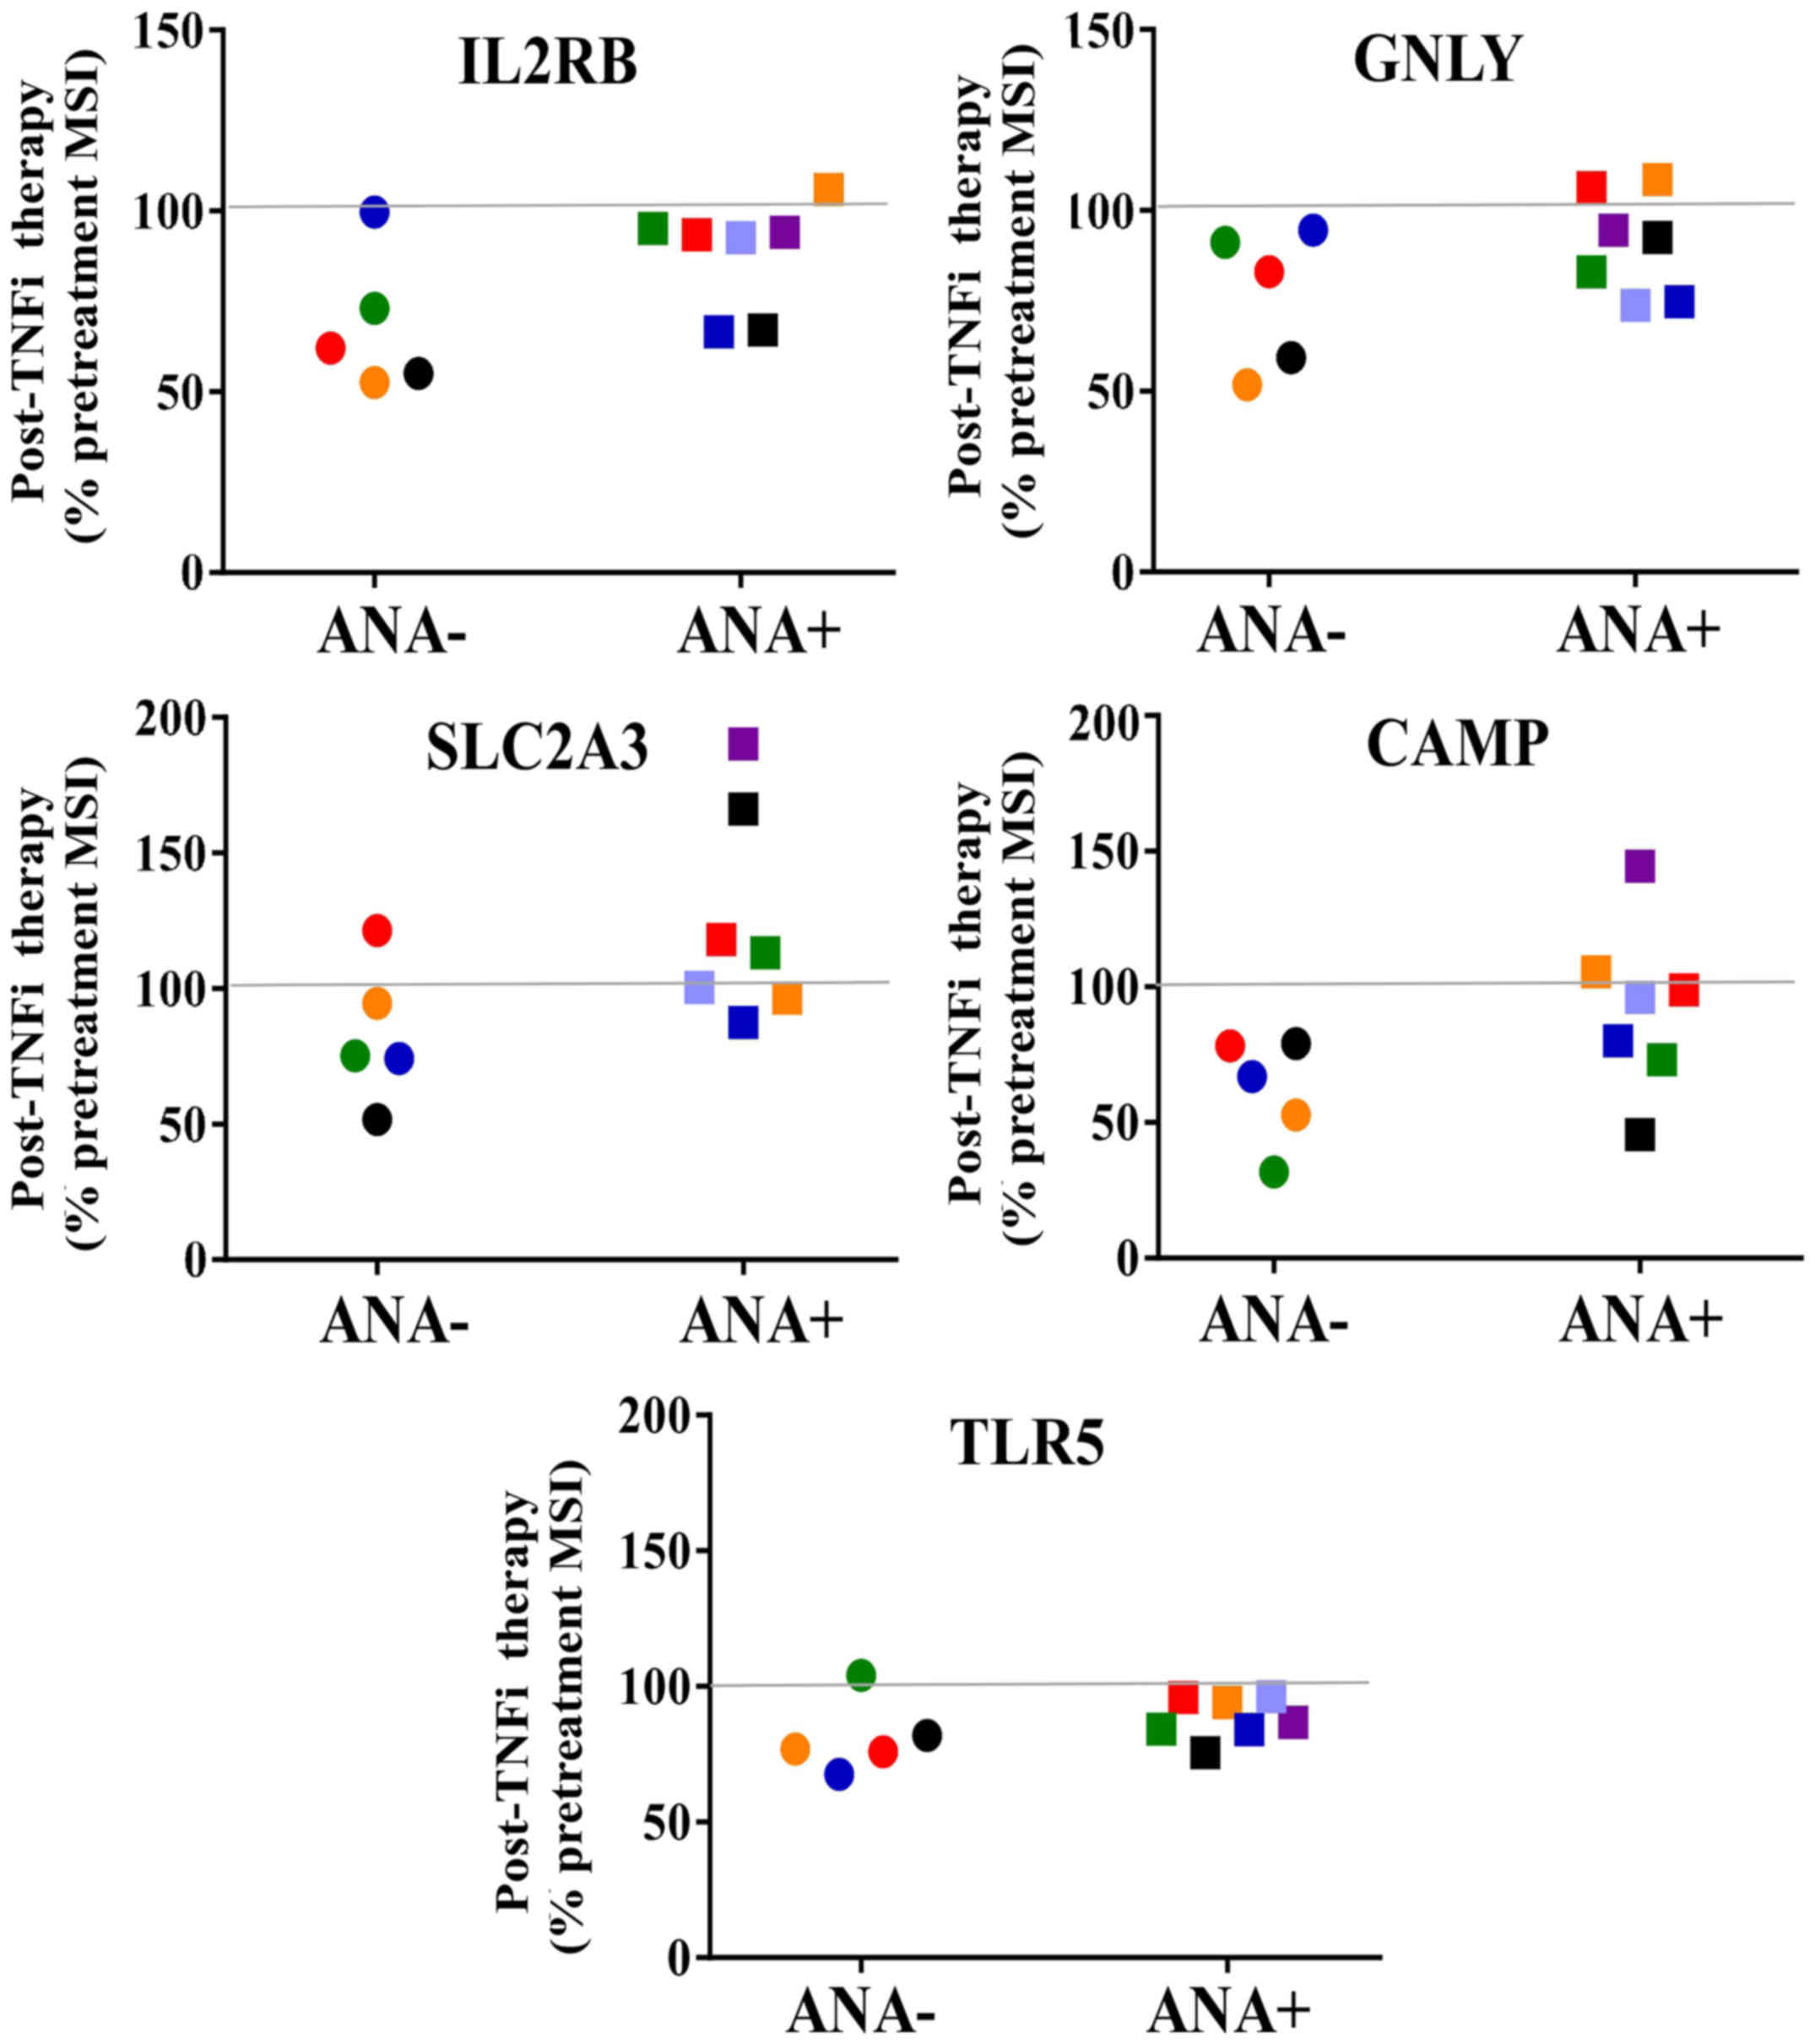 | Figure 3.Five transcripts from the ‘eight gene
signature’ predictive of responders to TNFi therapy. Post-treatment
results for ANA- and ANA+ rheumatoid arthritis patient groups are
shown for 5 predictive transcripts present in the samples. For
comparison of ANA- and ANA+, all pre-treatment MSI values were set
at 100% for each individual sample. The ANA- group expressed lower
levels of transcripts, which were not significantly different. The
line at the 100% mark denotes the pre-treatment levels for all
samples. ANA-, anti-nuclear antibody negative; ANA+, anti-nuclear
antibody positive; TNFi, tumor necrosis factor inhibitor; MSI, mean
signal intensity; IL2RB, interleukin 2 receptor, β; GNLY,
granulysin; SLC2A3, solute carrier family 2 (facilitated glucose
transporter), member 3; CAMP, cathelicidin antimicrobial peptide;
TLR5, toll-like receptor 5. |
ANA subgroups express unique
transcriptional profiles
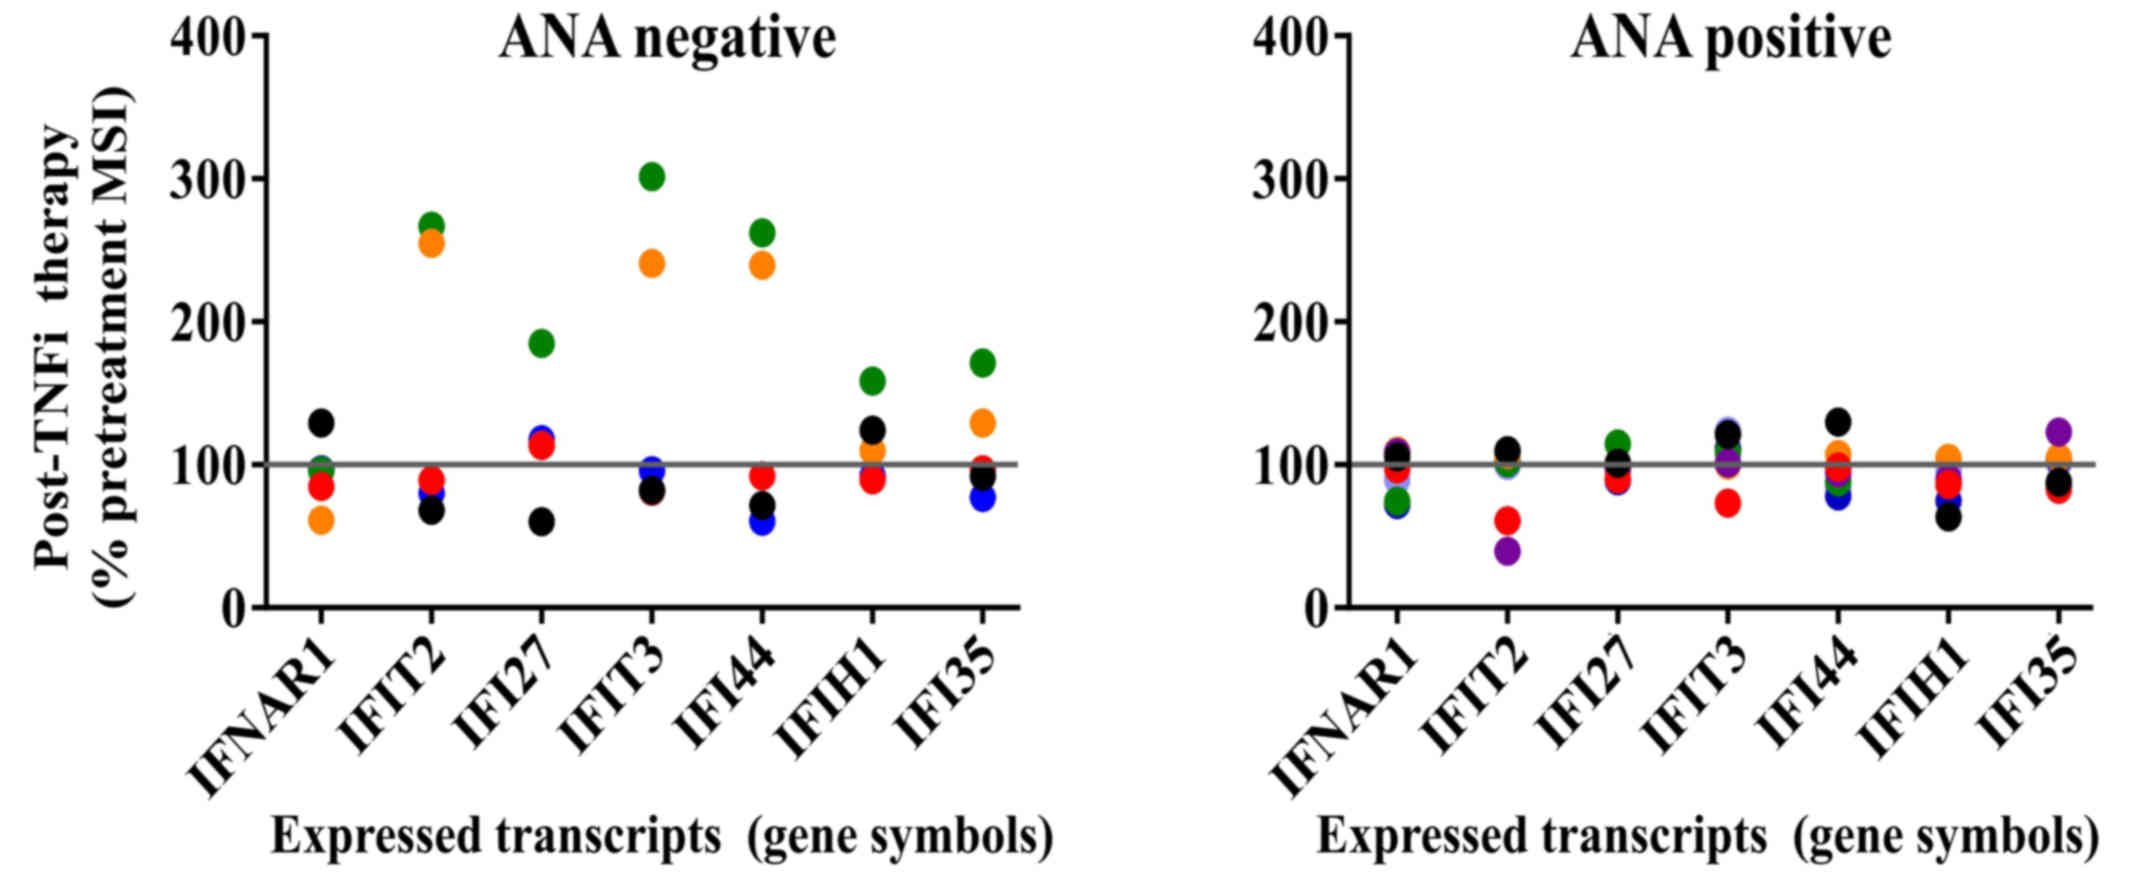
Likewise, differences in patterns were observed for
the ANA-positive samples compared with the ANA-negative samples for
interferon (IFN)-inducible (IFI) transcripts and transcripts
associated with immune cell subsets after TNFi therapy (Figs. 4 and 5). Fig. 4
shows that a subset of patients in the ANA-negative group expressed
increased levels of IFN-regulated transcripts after TNFi therapy
and that the remainder in this group expressed variable levels,
consistent with activation of IFN-inducible pathways. By contrast,
little change was detected in IFI transcripts in ANA-positive
patients. The IFI transcripts demonstrated a pattern that deviated
from the observed transcriptional profiles observed in comparisons
of statistically significant transcripts between ANA groups.
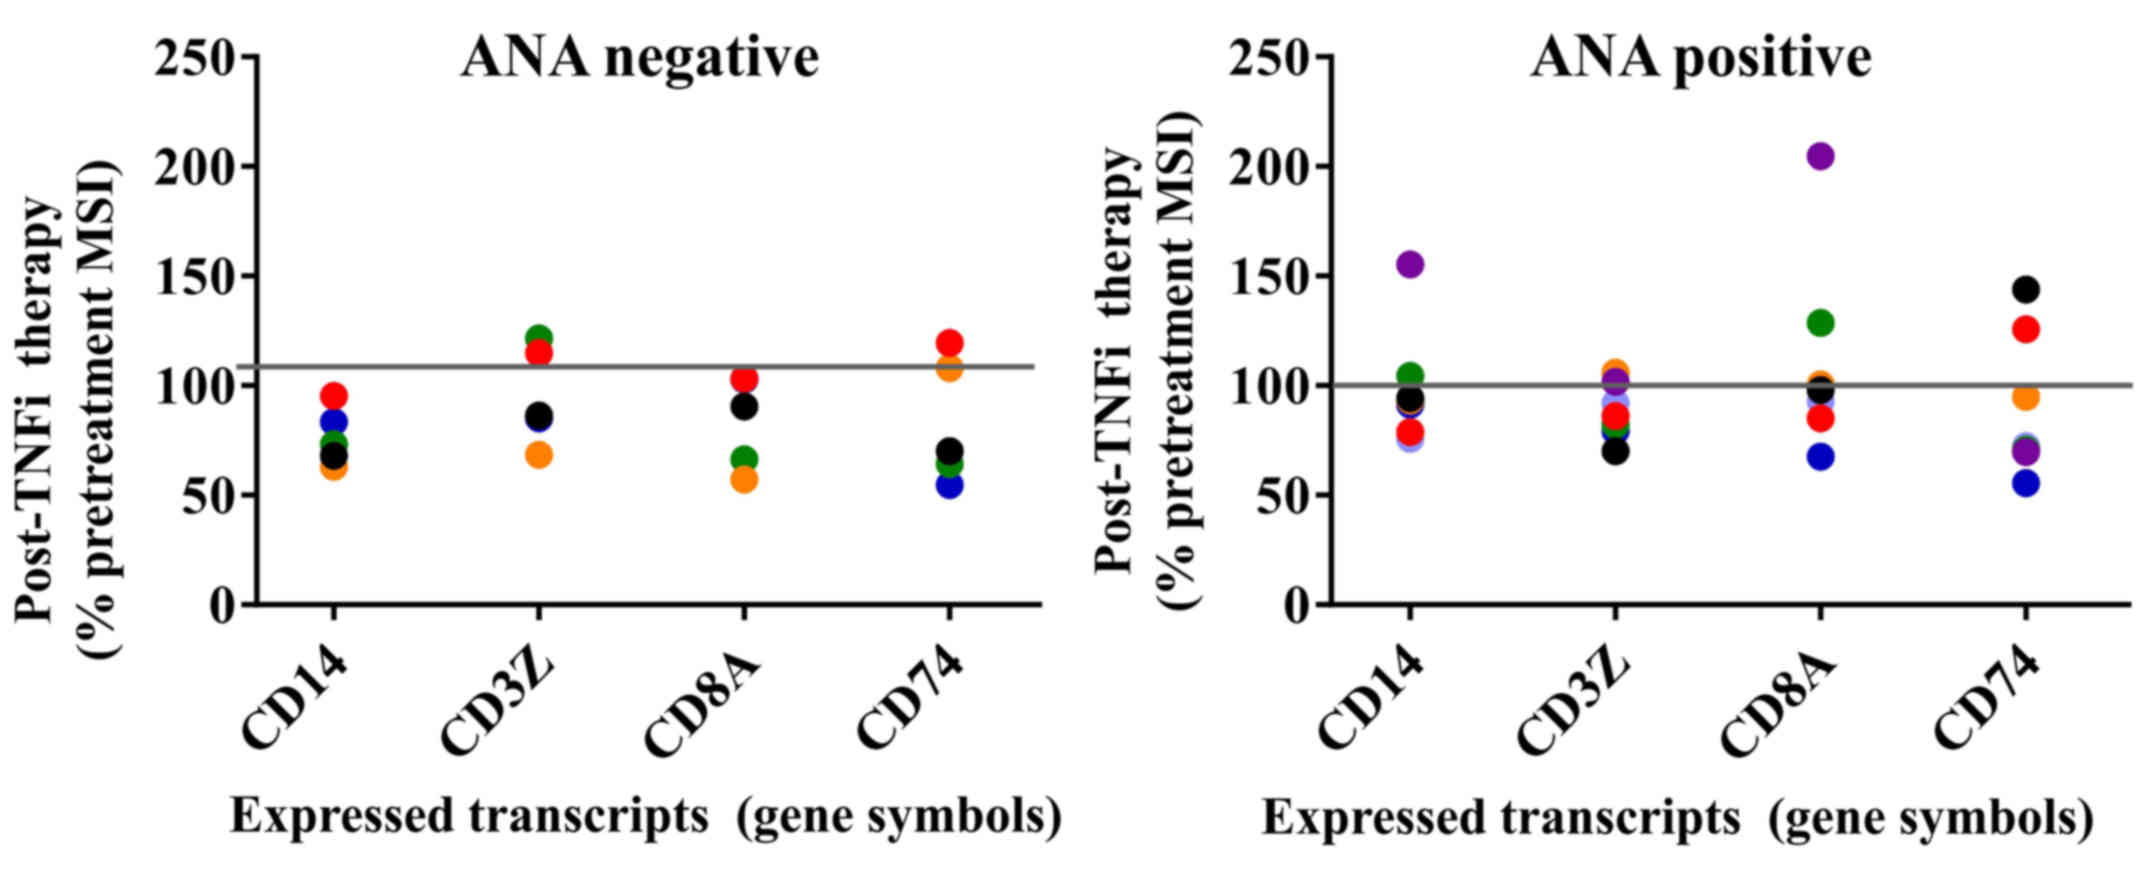 | Figure 5.Transcripts for PBMC subset markers
and invariant chain expression before and after TNFi therapy.
Post-treatment results for ANA negative and ANA positive rheumatoid
arthritis patient groups are shown for PBMC cell surface subset
markers CD14, CD3Z, CD8A and CD74 transcripts. All pre-treatment
MSI values were set at 100% for each individual sample. The ANA
negative group demonstrated overall greater consistency in
post-treatment transcript levels. The line at the 100% mark
indicates the pre-treatment levels for all samples. PBMC,
peripheral blood mononuclear cell; TNFi, tumor necrosis factor
inhibitor; ANA, anti-nuclear antibody; MSI, mean signal intensity.
CD14, cluster of differentiation 14; CD3Z, CD247 or T cell receptor
ζ chain; CD8A, CD8 alpha chain; CD74, cluster of differentiation
74. |
Major leukocyte subset markers were also examined,
such as the myeloid cell marker CD14, the T-cell marker
CD3Z (i.e., CD247 or T cell receptor ζ chain) and cytolytic
lymphocyte marker CD8A (CD8 α chain). CD74, the HLA
Class II invariant chain was also included for comparison. The
majority of samples trended toward downregulation after TNFi
therapy in the two ANA groups; however, once again the ANA-positive
group displayed greater variation with both up- and downregulated
gene expression. Transcripts for toll-like receptors (TLRs)
including TLR1, TLR2, TLR3, TLR4, TLR5, TLR7 and TLR8 were not
significantly altered in either ANA group, although the mean signal
intensity of all TLRs with the exception of TLR1 was near the
threshold of detection for the assay (data not shown). Similar
results were noted for the Fc receptors FCER1, FCGR2A,
FCGR2B and FCGR3A.
Discussion
We observed unique differential expression of
transcriptional profiles in PBMCs from patients with RA after TNFi
therapy and compared our findings to previous reports of TNFi gene
signatures. Although our study was conducted with isolated PBMCs,
activation markers of leukocyte subsets were not readily
discernable in our dataset. However, we were able to distinguish
differential gene expression that correlated with increased
metabolism, cell stress and unique adhesion molecules in groups and
in individual patients. Thus, we were able to distinguish
differential transcriptional profiles that were consistent with
ongoing alterations in the immune response after TNFi
treatment.
We have previously shown that myeloid cells express
the highest levels of IFI transcripts in PBMC subsets from patients
with lupus, which is now known as the ‘interferon signature’
(30). In the current study,
CD14 transcripts were downregulated in most samples in both
ANA groups, consistent with myeloid cell activation. Yet the
ANA-positive group exhibited decreased expression of IFI
transcripts and these PBMCs displayed higher metabolomic activity
as demonstrated by the highest differentially expressed transcript
levels. It has been previously demonstrated that TNF and IFNs
cross-regulate each other (31).
Thus, increased circulating TNF levels is one possible explanation
for the lack of increased IFI-inducible transcript expression after
TNFi therapy in the ANA-positive group. Alternatively, it could be
associated with the minor circulating populations of inflammatory
(CD16bright) monocytes and dendritic cells that are
expanded in autoimmune diseases (30,31).
These cells might be depleted, sequestered in tissues or have
undergone differentiation and thus not be responsive to increased
signaling by IFNs. We attempted to examine transcript levels for
markers that are associated with inflammatory monocytes and
dendritic cells such as CD16, CD169 (also known as Siglec-1) or
chemokine receptors such as CXCR3; however, only low levels of
transcripts could be detected. Thus, this observation will require
further studies of PBMCs from TNFi-treated patients assessed by a
combination of flow cytometry and gene expression assays to confirm
this mechanism.
A pattern of transcripts that were profoundly
downregulated after TNFi therapy was observed in two patients who
turned ANA-positive (Fig. 1). One
transcript, vezatin (VEZT), encodes for a ubiquitous
transmembrane protein that is a member of the cadherin family.
Vezatin has been shown to be an adherens anchor as part of the
cadherin and catenin complex (32,33). The
role of this protein in leukocyte function has yet to be
established; however, a study suggested that it can be cleaved from
apoptotic cells by caspase 8 along with the IL21 receptor (34). We carried out imaging and flow
cytometry experiments to confirm the expression of vezatin in PBMCs
and found that it was expressed at similar levels in a small study
of PBMCs from healthy controls and patients with RA (data not
shown). Future studies of RA patients with active disease and
documented therapies will be required to replicate the findings
from our transcriptional analysis at the protein level.
Several other transcripts such as MLX, EPHA3,
ACOT8 and PTPN7 exhibited similar expression profiles to
VEZT. These transcripts belong to a diverse group of
proteins. EPHA3 originates from ‘erythropoietin-producing
hepatocellular’ receptor and it belongs to a family of receptor
tyrosine kinases that are activated by membrane proteins called
ephrins. Elevated expression of the cell surface EPHA3 receptor can
be induced by TNF, and expression of EPHA3 receptors is increased
on leukocytes, endothelial cells and epithelial cells early in the
inflammatory response, disrupting normal adhesion and altering
cytoskeletal organization, thereby promoting trafficking into
inflammatory sites (35,36). Other adhesion-related transcripts in
the most highly differentially expressed gene list included
EGFL5, which encodes for the epidermal growth factor-like
family member 5 that appears to interact with integrins to regulate
endothelial cell function (37).
Also, a well-known cell adhesion gene, PARVB, encodes
β-parvin (also known as affixin) that interacts with
integrin-linked kinase and is involved in initial cell interactions
with the extracellular matrix, cell migration and in cell survival
(38,39).
Another differentially expressed transcript,
RAB5C encodes for the small GTPase Rab5C, which is involved
with Rab7 in the proper docking and fusion of intracellular
vesicles such as early to late endosome conversion, to generate
appropriate endocytic compartments (40). Notably, IFNɤ upregulates
transcription and protein expression of Rab5 family members in
macrophages and these proteins have been implicated in
intracellular membrane functions, including the killing of
pathogens and Rac-dependent cell motility (41,42).
The differentially expressed transcript of
ACOT8, also known as peroxisomal acyl-CoA thioesterase-1
(PTE-1) or PTE-2, encodes for the type II
acyl-Coenzyme A thioesterase 8 (PTE-2 protein) that has a broad
tissue distribution in mouse and man, resides in peroxisomes and is
important for fatty acid metabolism. PTE-2 is highly conserved from
yeast to man and it has been observed that fibrates and fasting
regulate ACOT8 gene expression via peroxisome
proliferator-activated receptor (PPAR)α (43–46).
Acyl-CoA thioesterases catalyze the hydrolysis of acyl-CoAs, thus
releasing CoASH and free fatty acids. PTE-2 activity is regulated
by and dependent on coenzyme A levels (43). It has been proposed that PTE-2 may
have a key role in peroxisomal lipid metabolism releasing fatty
acids of specific lengths in the β-oxidation pathway from
predominantly medium length acyl-CoAs for export (46). Overexpression of PTE-2 is associated
with increased PPARγ expression and results in lipid accumulation,
which is considered to contribute to an adipogenic phenotype
(47). PPT1 is another of the
most highly expressed genes that is involved in lipid metabolism.
PPT1 encodes palmitoyl protein thioesterase 1 (PPT1
protein), a small glycoprotein with enzyme activity that removes
thioester-linked fatty acyl groups (i.e. palmitate) from cysteines
and contributes to the catabolism of lipidated protein in lysosomes
(48,49).
The PTPN7 protein is a phosphatase that has been
shown to regulate TNF production by downregulating MAPKs including
ERK1, ERK2 and p38 MAPK in macrophages (50). In this previous study, stimulation
with lipopolysaccharide (LPS) reduced PTPN7 which corresponded with
increased TNF production. The role of PTPN7 in the regulation of
MAPKs was confirmed by use of small interfering RNA and
overexpression of exogenous PTPN7. By contrast, we examined the
transcripts for a number of other phosphatases; many were DUSPs,
which are not susceptible to direct LPS-induced effects (51) and their expression was consistent
with DUSP3 transcripts as shown in Fig. 1 and across all ANA-positive samples.
These studies suggest that elevated PTPN7 gene expression
levels might reflect a compensatory mechanism to regulate TNF
secretion.
Another highly differentially expressed transcript
was for the MLX protein. MLX has been shown to primarily localize
to the cytoplasm and respond to glucose and similar stimuli,
serving as a metabolic sensor in the MYC/MAX/MLX network. MLX forms
heterodimers with other transcription factor partners, which then
translocate to the nucleus and suppress E-box containing promoters
regulating cell growth, differentiation, nutrient uptake and stress
responses (52,53). Interestingly, MLX has been implicated
as a potential candidate susceptibility gene for Takayasu's
arteritis (54). Notably, other
members of this family, such as MXI1, were also
downregulated in the ANA-positive group. By contrast, MYCN
demonstrated overall less variability in signal intensity before
and after TNFi treatment (mean MSI before therapy 24,851 vs. 24,440
after therapy for all ANA-positive samples). Another member of this
network, MXD4 has been reported to be differentially
regulated in the ‘eight gene signature study’ of predictive gene
expression in TNFi responders (21).
The highly differentially expressed transcript
DNAJC7 is a gene regulating cell growth arrest and
apoptosis. DNAJC7 encodes for a heat shock protein 40 family
member known as DNAJC7 or TPR2. DNAJC7 is a binding partner and
prolongs the life of p53 (55,56).
DNAJC7 functions by displacing MDM2 from p53/MDM2 complexes and
binding p53 (56,57). The p53 protein activates a number of
genes involved in cell cycle arrest, senescence, apoptosis and
other functions (58).
Finally, another highly differentially expressed
transcript SMAD6 encodes the Smad6 protein, which along with
Smad7 comprise the inhibitory Smad family, provides negative
feedback regulation in the signaling pathways of transforming
growth factor-β and the growth factors known as bone morphogenetic
proteins (BMPs) (59–62). Smad6 is a transcriptional repressor
and has been shown to inhibit both cytoplasmic and nuclear BMP
activity (63,64).
Possible functions for the remaining most
differentially expressed genes RBP3 and zinc finger protein
614 (ZNF614) remain unknown. RBP3 encodes for the
retinol binding protein 3 which is highly expressed on
photoreceptor outer segments and is critical for the exchange of
11-cis retinol and all-trans retinol between
photoreceptors and retinal pigment epithelium (65). Currently, there is little information
available regarding the expression or function of RBP3 in
peripheral PBMCs, although autoantibodies to RBP3 have been
described (65). ZNF614
encodes for a protein which possibly functions as a transcriptional
regulator. More research on the function of ZNF614 will be
necessary to determine a potential role in immune regulation.
After 3 months of therapy a canonical ‘8 gene
responder signature’ that was previously reported did not segregate
groups in our RA samples (21).
While the previous validation studies assessed samples at
approximately the same time (after 14 weeks), differences including
the profiling of whole blood and RA patients on concomitant
methotrexate treatment with TNFi compared with methotrexate
monotherapy alone may have affected the results (16). Thus, sampling our patients at later
timepoints might have provided additional validation of the
‘clinical responder transcriptional profile’ observed in the
previous study.
We compared the gene expression profiles from our
dataset with ‘RA gene expression signatures’ from previous reports.
Gene expression that was predictive of RA as reported by Edwards
et al was analyzed for our dataset (66). No clear difference was observed in
the expression of the transcripts reported by Edwards et al
in individual RA patients when results before and after TNFi
therapy were compared (data not shown). This is not unexpected
given the differences in methods and platforms for these studies.
In the future, standardized approaches for sample preparation and
analysis will improve overall reproducibility between studies.
These observations suggest that TNFi treatment
potentially downregulates transcripts for molecules involved in
cell metabolism, cell adhesion and the cell stress response in a
subset of patients with RA who develop ANA positivity after TNFi
therapy. The most differentially expressed transcripts from
patients remaining ANA-negative were mostly downregulated after
therapy and similar results were observed in the analysis of a
canonical TNF response predictor gene signature. Gene expression
profiles from patients with RA converting to ANA positivity during
therapy were more complex and demonstrated a dynamic gene
expression pattern with both up- and downregulated transcripts for
the same transcript obtained from different individuals. Although
all of the RA patients had clinically active disease at the
initiation of therapy, we propose that the dynamic pattern observed
post-treatment might be indicative of increased activation in the
ANA-positive group, as has previously been suggested for B cells
(67). Thus, these results warrant
further studies to evaluate whether TNFi-treated ANA-positive RA
patients demonstrate other indicators of increased peripheral
immune activation and cell death compared with the ANA-negative
group. These results suggest that transcriptional profiling is a
more precise method of measuring the impact of TNF blockade on the
cross-regulation between TNF and type I IFNs that can contribute to
lupus-like symptoms.
Whereas samples from patients remaining ANA-negative
demonstrated less overall differential regulation in assessed gene
expression, the samples from patients with RA who converted to
ANA-positivity during therapy were more complex, with two RA
patients demonstrating striking increases in gene expression that
reflected activation of cell adhesion, cell stress and lipid
metabolism pathways, and these transcript levels were markedly
reduced after treatment with TNFi therapy. Further studies will be
required in order to attribute this unique gene expression profile
to the effects on systemic inflammation; however, it is well-known
that TNF upregulates parallel pathways of cell adhesion and
metabolomics in immune responses. Therefore, these studies suggest
novel markers and mechanisms that might contribute to RA and to the
effects of TNFi therapy.
Acknowledgements
The authors would like to thank the Immunology DNA
Microarray Core of the University of Texas Southwestern Medical
Center, including Dr Ward Wakeland and Dr Quan Zhen Li for
assistance with the microarrays and related analysis software. This
study was funded by NIH Grant R03-AI066036 (Dr Reimold) and Dr
Davis was funded by NIH grant P50AR055503 and a grant from the
Alliance for Lupus Research (grant no. 257549) and
MedImmune/Amplimmune (grant no. OTD-105547).
References
|
1
|
Scott DL and Kingsley GH: Tumor necrosis
factor inhibitors for rheumatoid arthritis. N Engl J Med.
355:704–712. 2006. View Article : Google Scholar : PubMed/NCBI
|
|
2
|
Sciré CA, Caporali R, Sarzi-Puttini P,
Frediani B, Di Franco M, Tincani A, Sinigaglia L, Sfriso P, Tirri
R, Bellis E, et al: Drug survival of the first course of anti-TNF
agents in patients with rheumatoid arthritis and seronegative
spondyloarthritis: Analysis from the MonitorNet database. Clin Exp
Rheumatol. 31:857–863. 2013.PubMed/NCBI
|
|
3
|
Lipsky PE, van der Heijde DM, St Clair EW,
Furst DE, Breedveld FC, Kalden JR, Smolen JS, Weisman M, Emery P,
Feldmann M, et al: Infliximab and methotrexate in the treatment of
rheumatoid arthritis. Anti-tumor necrosis factor trial in
rheumatoid arthritis with concomitant therapy study group. N Engl J
Med. 343:1594–1602. 2000. View Article : Google Scholar : PubMed/NCBI
|
|
4
|
Genovese MC, Bathon JM, Fleischmann RM,
Moreland LW, Martin RW, Whitmore JB, Tsuji WH and Leff JA: Longterm
safety, efficacy, and radiographic outcome with etanercept
treatment in patients with early rheumatoid arthritis. J Rheumatol.
32:1232–1242. 2005.PubMed/NCBI
|
|
5
|
Klareskog L, van der Heijde D, de Jager
JP, Gough A, Kalden J, Malaise M, Martín Mola E, Pavelka K, Sany J,
Settas L, et al: Therapeutic effect of the combination of
etanercept and methotrexate compared with each treatment alone in
patients with rheumatoid arthritis: Double-blind randomised
controlled trial. Lancet. 363:675–681. 2004. View Article : Google Scholar : PubMed/NCBI
|
|
6
|
van de Putte LB, Atkins C, Malaise M, Sany
J, Russell AS, van Riel PL, Settas L, Bijlsma JW, Todesco S,
Dougados M, et al: Efficacy and safety of adalimumab as monotherapy
in patients with rheumatoid arthritis for whom previous disease
modifying antirheumatic drug treatment has failed. Ann Rheum Dis.
63:508–516. 2004. View Article : Google Scholar : PubMed/NCBI
|
|
7
|
Atzeni F, Sarzi-Puttini P, Dell'Acqua D,
de Portu S, Cecchini G, Cruini C, Carrabba M and Meroni PL:
Adalimumab clinical efficacy is associated with rheumatoid factor
and anti-cyclic citrullinated peptide antibody titer reduction: A
one-year prospective study. Arthritis Res Ther. 8:R32006.
View Article : Google Scholar : PubMed/NCBI
|
|
8
|
Alessandri C, Bombardieri M, Papa N,
Cinquini M, Magrini L, Tincani A and Valesini G: Decrease of
anti-cyclic citrullinated peptide antibodies and rheumatoid factor
following anti-TNFalpha therapy (infliximab) in rheumatoid
arthritis is associated with clinical improvement. Ann Rheum Dis.
63:1218–1221. 2004. View Article : Google Scholar : PubMed/NCBI
|
|
9
|
Chen HA, Lin KC, Chen CH, Liao HT, Wang
HP, Chang HN, Tsai CY and Chou CT: The effect of etanercept on
anti-cyclic citrullinated peptide antibodies and rheumatoid factor
in patients with rheumatoid arthritis. Ann Rheum Dis. 65:35–39.
2006. View Article : Google Scholar : PubMed/NCBI
|
|
10
|
Pittoni V, Bombardieri M, Spinelli FR,
Scrivo R, Alessandri C, Conti F, Spadaro A and Valesini G:
Anti-tumour necrosis factor (TNF) alpha treatment of rheumatoid
arthritis (infliximab) selectively down regulates the production of
interleukin (IL) 18 but not of IL12 and IL13. Ann Rheum Dis.
61:723–725. 2002. View Article : Google Scholar : PubMed/NCBI
|
|
11
|
Shakoor N, Michalska M, Harris CA and
Block JA: Drug-induced systemic lupus erythematosus associated with
etanercept therapy. Lancet. 359:579–580. 2002. View Article : Google Scholar : PubMed/NCBI
|
|
12
|
Furst DE, Schiff MH, Fleischmann RM,
Strand V, Birbara CA, Compagnone D, Fischkoff SA and Chartash EK:
Adalimumab, a fully human anti tumor necrosis factor-alpha
monoclonal antibody and concomitant standard antirheumatic therapy
for the treatment of rheumatoid arthritis: Results of STAR (Safety
Trial of Adalimumab in Rheumatoid Arthritis). J Rheumatol.
30:2563–2571. 2003.PubMed/NCBI
|
|
13
|
Caramaschi P, Biasi D, Colombatti M,
Pieropan S, Martinelli N, Carletto A, Volpe A, Pacor LM and Bambara
LM: Anti-TNFalpha therapy in rheumatoid arthritis and autoimmunity.
Rheumatol Int. 26:209–214. 2006. View Article : Google Scholar : PubMed/NCBI
|
|
14
|
De Rycke L, Baeten D, Kruithof E, Van den
Bosch F, Veys EM and De Keyser F: Infliximab, but not etanercept,
induces IgM anti-double-stranded DNA autoantibodies as main
antinuclear reactivity: Biologic and clinical implications in
autoimmune arthritis. Arthritis Rheum. 52:2192–2201. 2005.
View Article : Google Scholar : PubMed/NCBI
|
|
15
|
De Rycke L, Baeten D, Kruithof E, Van den
Bosch F, Veys EM and De Keyser F: The effect of TNFalpha blockade
on the antinuclear antibody profile in patients with chronic
arthritis: Biological and clinical implications. Lupus. 14:931–937.
2005. View Article : Google Scholar : PubMed/NCBI
|
|
16
|
Toonen EJ, Gilissen C, Franke B, Kievit W,
Eijsbouts AM, den Broeder AA, van Reijmersdal SV, Veltman JA,
Scheffer H, Radstake TR, et al: Validation study of existing gene
expression signatures for anti-TNF treatment in patients with
rheumatoid arthritis. PLoS One. 7:e331992012. View Article : Google Scholar : PubMed/NCBI
|
|
17
|
Kim TH, Choi SJ, Lee YH, Song GG and Ji
JD: Gene expression profile predicting the response to anti-TNF
treatment in patients with rheumatoid arthritis; analysis of GEO
datasets. Joint Bone Spine. 81:325–330. 2014. View Article : Google Scholar : PubMed/NCBI
|
|
18
|
Oswald M, Curran ME, Lamberth SL, Townsend
RM, Hamilton JD, Chernoff DN, Carulli J, Townsend MJ, Weinblatt ME,
Kern M, et al: Modular analysis of peripheral blood gene expression
in rheumatoid arthritis captures reproducible gene expression
changes in tumor necrosis factor responders. Arthritis Rheumatol.
67:344–351. 2015. View Article : Google Scholar : PubMed/NCBI
|
|
19
|
Rosenberg A, Fan H, Chiu YG, Bolce R,
Tabechian D, Barrett R, Moorehead S, Baribaud F, Liu H, Peffer N,
et al: Divergent gene activation in peripheral blood and tissues of
patients with rheumatoid arthritis, psoriatic arthritis and
psoriasis following infliximab therapy. PLoS One. 9:e1106572014.
View Article : Google Scholar : PubMed/NCBI
|
|
20
|
Wright HL, Thomas HB, Moots RJ and Edwards
SW: Interferon gene expression signature in rheumatoid arthritis
neutrophils correlates with a good response to TNFi therapy.
Rheumatology (Oxford). 54:188–193. 2015. View Article : Google Scholar : PubMed/NCBI
|
|
21
|
Julia A, Erra A, Palacio C, Tomas C, Sans
X, Barceló P and Marsal S: An eight-gene blood expression profile
predicts the response to infliximab in rheumatoid arthritis. PLoS
One. 4:e75562009. View Article : Google Scholar : PubMed/NCBI
|
|
22
|
Oliveira RD, Fontana V, Junta CM, Marques
MM, Macedo C, Rassi DM, Passos GA, Donadi EA and Louzada-Junior P:
Differential gene expression profiles may differentiate responder
and nonresponder patients with rheumatoid arthritis for
methotrexate (MTX) monotherapy and MTX plus tumor necrosis factor
inhibitor combined therapy. J Rheumatol. 39:1524–1532. 2012.
View Article : Google Scholar : PubMed/NCBI
|
|
23
|
Arnett FC, Edworthy SM, Bloch DA, McShane
DJ, Fries JF, Cooper NS, Healey LA, Kaplan SR, Liang MH and Luthra
HS: The American rheumatism association 1987 revised criteria for
the classification of rheumatoid arthritis. Arthritis Rheum.
31:315–324. 1988. View Article : Google Scholar : PubMed/NCBI
|
|
24
|
Prevoo ML, van't Hof MA, Kuper HH, van
Leeuwen MA, van de Putte LB and van Riel PL: Modified disease
activity scores that include twenty-eight-joint counts. Development
and validation in a prospective longitudinal study of patients with
rheumatoid arthritis. Arthritis Rheum. 38:44–48. 1995. View Article : Google Scholar : PubMed/NCBI
|
|
25
|
Winchester RJ: Characterization of IgG
complexes in patients with rheumatoid arthritis. Ann N Y Acad Sci.
256:73–81. 1975. View Article : Google Scholar : PubMed/NCBI
|
|
26
|
Roberts-Thomson PJ, McEvoy R, Langhans T
and Bradley J: Routine quantification of rheumatoid factor by rate
nephelometry. Ann Rheum Dis. 44:379–383. 1985. View Article : Google Scholar : PubMed/NCBI
|
|
27
|
Banal F, Dougados M, Combescure C and
Gossec L: Sensitivity and specificity of the American College of
Rheumatology 1987 criteria for the diagnosis of rheumatoid
arthritis according to disease duration: A systematic literature
review and meta-analysis. Ann Rheum Dis. 68:1184–1191. 2009.
View Article : Google Scholar : PubMed/NCBI
|
|
28
|
Schellekens GA, Visser H, de Jong BA, van
den Hoogen FH, Hazes JM, Breedveld FC and van Venrooij WJ: The
diagnostic properties of rheumatoid arthritis antibodies
recognizing a cyclic citrullinated peptide. Arthritis Rheum.
43:155–163. 2000. View Article : Google Scholar : PubMed/NCBI
|
|
29
|
Visser H, le Cessie S, Vos K, Breedveld FC
and Hazes JM: How to diagnose rheumatoid arthritis early: A
prediction model for persistent (erosive) arthritis. Arthritis
Rheum. 46:357–365. 2002. View Article : Google Scholar : PubMed/NCBI
|
|
30
|
Becker AM, Dao KH, Han BK, Kornu R,
Lakhanpal S, Mobley AB, Li QZ, Lian Y, Wu T, Reimold AM, et al: SLE
peripheral blood B cell, T cell and myeloid cell transcriptomes
display unique profiles and each subset contributes to the
interferon signature. PLoS One. 8:e670032013. View Article : Google Scholar : PubMed/NCBI
|
|
31
|
Blanco P, Palucka AK, Pascual V and
Banchereau J: Dendritic cells and cytokines in human inflammatory
and autoimmune diseases. Cytokine Growth Factor Rev. 19:41–52.
2008. View Article : Google Scholar : PubMed/NCBI
|
|
32
|
Bahloul A, Simmler MC, Michel V, Leibovici
M, Perfettini I, Roux I, Weil D, Nouaille S, Zuo J, Zadro C, et al:
Vezatin, an integral membrane protein of adherens junctions, is
required for the sound resilience of cochlear hair cells. EMBO Mol
Med. 1:125–138. 2009. View Article : Google Scholar : PubMed/NCBI
|
|
33
|
Hyenne V, Harf JC, Latz M, Maro B, Wolfrum
U and Simmler MC: Vezatin, a ubiquitous protein of adherens
cell-cell junctions, is exclusively expressed in germ cells in
mouse testis. Reproduction. 133:563–574. 2007. View Article : Google Scholar : PubMed/NCBI
|
|
34
|
Akagi T, Shimizu K, Takahama S, Iwasaki T,
Sakamaki K, Endo Y and Sawasaki T: Caspase-8 cleavage of the
interleukin-21 (IL-21) receptor is a negative feedback regulator of
IL-21 signaling. FEBS Lett. 585:1835–1840. 2011. View Article : Google Scholar : PubMed/NCBI
|
|
35
|
Ivanov AI and Romanovsky AA: Putative dual
role of ephrin-Eph receptor interactions in inflammation. IUBMB
Life. 58:389–394. 2006. View Article : Google Scholar : PubMed/NCBI
|
|
36
|
Ivanov AI, Steiner AA, Scheck AC and
Romanovsky AA: Expression of Eph receptors and their ligands,
ephrins, during lipopolysaccharide fever in rats. Physiol Genomics.
21:152–160. 2005. View Article : Google Scholar : PubMed/NCBI
|
|
37
|
Chim SM, Tickner J, Chow ST, Kuek V, Guo
B, Zhang G, Rosen V, Erber W and Xu J: Angiogenic factors in bone
local environment. Cytokine Growth Factor Rev. 24:297–310. 2013.
View Article : Google Scholar : PubMed/NCBI
|
|
38
|
Verschuren JJ, Trompet S, Sampietro ML,
Heijmans BT, Koch W, Kastrati A, Houwing-Duistermaat JJ, Slagboom
PE, Quax PH and Jukema JW: Pathway analysis using genome-wide
association study data for coronary restenosis-a potential role for
the PARVB gene. PLoS One. 8:e706762013. View Article : Google Scholar : PubMed/NCBI
|
|
39
|
Eslami A, Miyaguchi K, Mogushi K, Watanabe
H, Okada N, Shibuya H, Mizushima H, Miura M and Tanaka H: PARVB
overexpression increases cell migration capability and defines high
risk for endophytic growth and metastasis in tongue squamous cell
carcinoma. Br J Cancer. 112:338–344. 2015. View Article : Google Scholar : PubMed/NCBI
|
|
40
|
Flinn RJ, Yan Y, Goswami S, Parker PJ and
Backer JM: The late endosome is essential for mTORC1 signaling. Mol
Biol Cell. 21:833–841. 2010. View Article : Google Scholar : PubMed/NCBI
|
|
41
|
Chen PI, Schauer K, Kong C, Harding AR,
Goud B and Stahl PD: Rab5 isoforms orchestrate a ‘division of
labor’ in the endocytic network; Rab5C modulates Rac-mediated cell
motility. PLoS One. 9:e903842014. View Article : Google Scholar : PubMed/NCBI
|
|
42
|
Alvarez-Dominguez C and Stahl PD:
Interferon-gamma selectively induces Rab5a synthesis and processing
in mononuclear cells. J Biol Chem. 273:33901–33904. 1998.
View Article : Google Scholar : PubMed/NCBI
|
|
43
|
Westin MA, Alexson SE and Hunt MC:
Molecular cloning and characterization of two mouse peroxisome
proliferator-activated receptor alpha (PPARalpha)-regulated
peroxisomal acyl-CoA thioesterases. J Biol Chem. 279:21841–21848.
2004. View Article : Google Scholar : PubMed/NCBI
|
|
44
|
Watanabe H, Shiratori T, Shoji H, Miyatake
S, Okazaki Y, Ikuta K, Sato T and Saito T: A novel acyl-CoA
thioesterase enhances its enzymatic activity by direct binding with
HIV Nef. Biochem Biophys Res Commun. 238:234–239. 1997. View Article : Google Scholar : PubMed/NCBI
|
|
45
|
Liu LX, Margottin F, Le Gall S, Schwartz
O, Selig L, Benarous R and Benichou S: Binding of HIV-1 Nef to a
novel thioesterase enzyme correlates with Nef-mediated CD4
down-regulation. J Biol Chem. 272:13779–13785. 1997. View Article : Google Scholar : PubMed/NCBI
|
|
46
|
Hunt MC, Solaas K, Kase BF and Alexson SE:
Characterization of an acyl-coA thioesterase that functions as a
major regulator of peroxisomal lipid metabolism. J Biol Chem.
277:1128–1138. 2002. View Article : Google Scholar : PubMed/NCBI
|
|
47
|
Ishizuka M, Toyama Y, Watanabe H, Fujiki
Y, Takeuchi A, Yamasaki S, Yuasa S, Miyazaki M, Nakajima N, Taki S
and Saito T: Overexpression of human acyl-CoA thioesterase
upregulates peroxisome biogenesis. Exp Cell Res. 297:127–141. 2004.
View Article : Google Scholar : PubMed/NCBI
|
|
48
|
Kollmann K, Uusi-Rauva K, Scifo E, Tyynelä
J, Jalanko A and Braulke T: Cell biology and function of neuronal
ceroid lipofuscinosis-related proteins. Biochim Biophys Acta.
1832:1866–1881. 2013. View Article : Google Scholar : PubMed/NCBI
|
|
49
|
Wang R, Borazjani A, Matthews AT, Mangum
LC, Edelmann MJ and Ross MK: Identification of palmitoyl protein
thioesterase 1 in human THP1 monocytes and macrophages and
characterization of unique biochemical activities for this enzyme.
Biochemistry. 52:7559–7574. 2013. View Article : Google Scholar : PubMed/NCBI
|
|
50
|
Seo H, Lee IS, Park JE, Park SG, Lee DH,
Park BC and Cho S: Role of protein tyrosine phosphatase
non-receptor type 7 in the regulation of TNF-α production in RAW
264.7 macrophages. PLoS One. 8:e787762013. View Article : Google Scholar : PubMed/NCBI
|
|
51
|
Lang R, Hammer M and Mages J: DUSP meet
immunology: Dual specificity MAPK phosphatases in control of the
inflammatory response. J Immunol. 177:7497–7504. 2006. View Article : Google Scholar : PubMed/NCBI
|
|
52
|
Diolaiti D, McFerrin L, Carroll PA and
Eisenman RN: Functional interactions among members of the MAX and
MLX transcriptional network during oncogenesis. Biochim Biophys
Acta. 1849:484–500. 2015. View Article : Google Scholar : PubMed/NCBI
|
|
53
|
Mitchell SM and Frayling TM: The role of
transcription factors in maturity-onset diabetes of the young. Mol
Genet Metab. 77:35–43. 2002. View Article : Google Scholar : PubMed/NCBI
|
|
54
|
Terao C, Yoshifuji H and Mimori T: Recent
advances in Takayasu arteritis. Int J Rheu Dis. 17:238–247. 2014.
View Article : Google Scholar
|
|
55
|
Timsit YE and Negishi M: Coordinated
regulation of nuclear receptor CAR by CCRP/DNAJC7, HSP70 and the
ubiquitin-proteasome system. PLoS One. 9:e960922014. View Article : Google Scholar : PubMed/NCBI
|
|
56
|
Kubo N, Wu D, Yoshihara Y, Sang M,
Nakagawara A and Ozaki T: Co-chaperon DnaJC7/TPR2 enhances p53
stability and activity through blocking the complex formation
between p53 and MDM2. Biochem Biophys Res Commun. 430:1034–1039.
2013. View Article : Google Scholar : PubMed/NCBI
|
|
57
|
Ohno M, Kanayama T, Moore R, Ray M and
Negishi M: The Roles of Co-Chaperone CCRP/DNAJC7 in Cyp2b10 gene
activation and steatosis development in mouse livers. PLoS One.
9:e1156632014. View Article : Google Scholar : PubMed/NCBI
|
|
58
|
Menendez D, Shatz M and Resnick MA:
Interactions between the tumor suppressor p53 and immune responses.
Curr Opin Oncol. 25:85–92. 2013. View Article : Google Scholar : PubMed/NCBI
|
|
59
|
Kim YC, Kim KK and Shevach EM: Simvastatin
induces Foxp3+ T regulatory cells by modulation of transforming
growth factor-beta signal transduction. Immunology. 130:484–493.
2010. View Article : Google Scholar : PubMed/NCBI
|
|
60
|
Yan X and Chen YG: Smad7: Not only a
regulator, but also a cross-talk mediator of TGF-beta signalling.
Biochem J. 434:1–10. 2011. View Article : Google Scholar : PubMed/NCBI
|
|
61
|
Yan X, Liu Z and Chen Y: Regulation of
TGF-beta signaling by Smad7. Acta Biochim Biophys Sin (Shanghai).
41:263–272. 2009. View Article : Google Scholar : PubMed/NCBI
|
|
62
|
Chen D, Zhao M and Mundy GR: Bone
morphogenetic proteins. Growth Factors. 22:233–241. 2004.
View Article : Google Scholar : PubMed/NCBI
|
|
63
|
Bai S, Shi X, Yang X and Cao X: Smad6 as a
transcriptional corepressor. J Biol Chem. 275:8267–8270. 2000.
View Article : Google Scholar : PubMed/NCBI
|
|
64
|
Ichijo T, Voutetakis A, Cotrim AP,
Bhattachryya N, Fujii M, Chrousos GP and Kino T: The Smad6-histone
deacetylase 3 complex silences the transcriptional activity of the
glucocorticoid receptor: Potential clinical implications. J Biol
Chem. 280:42067–42077. 2005. View Article : Google Scholar : PubMed/NCBI
|
|
65
|
Zhu L, Shen W, Zhu M, Coorey NJ, Nguyen
AP, Barthelmes D and Gillies MC: Anti-retinal antibodies in
patients with macular telangiectasia type 2. Invest Ophthalmol Vis
Sci. 54:5675–5683. 2013. View Article : Google Scholar : PubMed/NCBI
|
|
66
|
Edwards CJ, Feldman JL, Beech J, Shields
KM, Stover JA, Trepicchio WL, Larsen G, Foxwell BM, Brennan FM,
Feldmann M and Pittman DD: Molecular profile of peripheral blood
mononuclear cells from patients with rheumatoid arthritis. Mol Med.
13:40–58. 2007. View Article : Google Scholar : PubMed/NCBI
|
|
67
|
Dozmorov I, Dominguez N, Sestak AL,
Robertson JM, Harley JB, James JA and Guthridge JM: Evidence of
dynamically dysregulated gene expression pathways in
hyperresponsive B cells from African American lupus patients. PLoS
One. 8:e713972013. View Article : Google Scholar : PubMed/NCBI
|