Introduction
As a mental disorder, major depression disorder
(MDD) is characterized by a significant and persistent depressed
mood (1), accompanied by multiple
cognitive and behavioral changes (2,3). These
behavioral changes are the result of cerebral dysfunction, which is
based on molecular biological abnormalities in brain tissues. The
prefrontal cortex is closely linked with many functions such as
planning, cognition, memory, execution and executive control.
Prefrontal dysfunction is often regarded as the pathological basis
of depression onset and also as a sign of a depressive state
(4). Investigating functional
changes in the prefrontal lobe using imaging techniques, and
analyzing correlations between the functional changes and clinical
symptoms helps to elucidate the features of cerebral molecular
biological abnormalities in depressive patients, and accurately
locate the cerebral functional regions responsible for behavioral
disorders. Consequently, this provides reliable markers for the
clinical diagnosis and treatment of depression.
The 3D-arterial spin labeling (ASL) technique for
magnetic resonance imaging and 18F-fluorodeoxyglucose
(FDG) positron emission tomography/computed tomography (PET/CT) can
reflect functions of cerebral blood perfusion and glucose
metabolism, respectively (5).
Theoretically, the two functions should be consistent. Previous
mono-mode imaging studies using ASL or 18F-FDG PET have
reported changes in cerebral blood perfusion and glucose metabolism
in the prefrontal lobes of depressed patients (6,7). A study
conducted by Lui et al (7)
indicated that, in non-refractory depressed patients, cerebral
blood perfusion changes were mainly located in the bilateral
frontal-cortical pathways. Lee et al (6) reported that glucose metabolism was
reduced in the bilateral frontal cortices. Mayberg et al
(8) reported that a reduction of
cerebral 18F-FDG standardized uptake values (SUVs) in
the frontal cortex, particularly in the medial and dorsal frontal
cortex, was a common manifestation in multiple types of depression.
However, studies simultaneously assessing the functions of cerebral
blood perfusion and glucose metabolism in depression patients using
dual-mode imaging techniques have not yet been conducted.
Clinical depressive symptoms are usually evaluated
using the Hamilton Depression Rating Scale (HAMD), which divides
the depressive symptoms into seven factors (9): Anxiety, loss of weight, cognitive
impairment, diurnal variation, retardation, insomnia and depressed
mood. Functional changes of the frontal cortex in patients with MDD
may have correlations with HAMD scores for each of the seven
factors. Vasic et al (10)
reported a positive correlation between depressive symptoms and
cerebral blood flow (CBF) in the right middle frontal cortex.
Graff-Guerrero et al (11)
also indicated that the symptom factor scores of MDD were all
positively or negatively correlated with the frontal cortical blood
flow values. In a study that focused on the correlation between
cerebral glucose metabolism and HAMD scores, positive correlations
were observed in the inferior frontal and inferior orbital frontal
gyrus, and negative correlations were observed in the dorsolateral
prefrontal cortex (12). These
results indicate that CBF and glucose metabolism in the frontal
cortex of MDD patients may be correlated with depressive symptoms.
In the current study, correlation between CBF values and SUVs in
the prefrontal lobes, and the Hamilton scores of seven symptoms in
MDD patients were analyzed in order to explore the clinical
significance of these functional changes and accurately locate
cerebral functional regions for depression.
Thus, 17 patients with MDD and 16 age- and
gender-matched healthy controls underwent dual-mode imaging scans
of brain 3D-ASL and 18F-FDG PET/CT. The functions of the
prefrontal lobes in the patients with MDD were then assessed and
evaluated.
Patients and methods
Patient recruitment
A total of 23 patients with MDD were recruited from
the psychological clinic of Zhengzhou University People's Hospital
(Zhengzhou, China), from November 2012 to December 2013. A total of
18 age- and gender-matched healthy controls were recruited via
advertisements. The clinical characteristics of the patient and
control groups that were analyzed (after several exclusions) are
detailed in Table I.
 | Table I.Clinical and demographic
characteristics of the patients with MDD and healthy controls. |
Table I.
Clinical and demographic
characteristics of the patients with MDD and healthy controls.
| Characteristic | MDD (n=17) | Healthy control
(n=16) | P-value |
|---|
| Age (years) | 33.00±7.59 | 34.59±8.96 |
0.57a |
| Education
(years) | 17.21±2.42 | 16.95±1.84 |
0.53a |
| Male/female
(n/n) | 6/11 | 5/11 |
0.59b |
| HAMD | 19.50±2.57 | 4.65±1.58 | <0.05a |
| HAMA | 12.49±4.12 | 2.51±1.24 | <0.05a |
Patients were diagnosed by two experienced
psychiatrists according to the criteria in the Diagnostic and
Statistical Manual of Mental Disorders (4th edition) (13). Patients' depression and anxiety
severity were assessed using HAMD and the Hamilton Anxiety Rating
Scale (HAMA) (14), respectively.
Depressive symptoms were classified into seven factors: Anxiety,
weight, cognitive impairment, diurnal variation, retardation, sleep
disturbance and hopelessness. All patients were diagnosed with MDD
for the first time and had not received any antidepressant
treatment prior to undergoing imaging examinations. All
participants were selected using the following criteria: i)
Right-handed; ii) 18–50 years old; iii) no history of neurological
illness or other serious physical disease; and iv) no history of
alcohol or drug dependence.
This study was approved by the Ethics Committee of
Zhengzhou University People's Hospital. All subjects provided
written informed consent.
Image acquisition
Brain 18F-FDG PET/CT and 3D-ASL scans
were carried out over a period of 3 days for the 23 patients and 18
healthy controls.
3D-ASL scans were acquired with a Discovery MR750
scanner (GE Healthcare Bio-Sciences, Pittsburgh, PA, USA). A
3D-fast spoiled gradient echo [repetition time (TR), 8.2 msec; echo
time (TE), 3.2 msec; inversion time (TI), 450 msec; slice
thickness, 1 mm; 156 slices; image matrix, 256×256; field-of-view
(FOV), 24×24 cm] and a 3D-ASL sequence (TR, 4,950 msec; TI, 450
msec; TE, 10.5 msec; slice thickness, 4 mm; 36 slices; image
matrix, 1024×8; FOV, 24×24 cm) were employed.
18F-FDG PET/CT images were obtained using
a Discovery VCT PET-CT set (GE Healthcare Bio-Sciences).
18F-FDG was compounded using a MINItrace medical
cyclotron (GE Healthcare Bio-Sciences) and FDG automatic synthesis
device. Prior to the examination, all patients were required to
fast for ≥6 h and the fasting blood glucose level of the patients
was required to be <6.1 mmol/l. 18F-FDG was injected
intravenously at a dose of 5.55 MBq/kg. After the injection,
subjects remained in a resting state in a quiet environment for a
50-min uptake period. The cerebral PET acquisition time was 10 min.
PET/CT scanning parameters were as follows: Voltage, 120 kV;
current, 60 mA; and thickness, 5 mm. An acquisition counter using
an iterative method was used to reconstruct transverse, sagittal
and coronal images.
3D-ASL data analysis
Statistical parametric mapping (SPM8 software;
Wellcome Trust Centre for Neuroimaging, London, UK) was used to
complete image preprocessing. First, CBF images were calculated
from 3D-ASL images using the GE Advantage Workstation 4.5 (AW4.5;
GE Healthcare Bio-Sciences). The CBF images were then converted
into the Analyze7 format by SPM8. The converted images were
spatially normalized to the space coordinates of the Talairach
cerebral atlas. The normalized images were smoothed with an
isotropic Gaussian kernel of 2×2×2 mm3 (full width at
half maximum, FWHM). A target image with a voxel size of 2×2×2
mm3 and an image matrix of 128×128 was then
prepared.
PET data analysis
Cerebral PET images were converted into the Analyze7
format using SPM8. The images were then spatially normalized to the
space coordinates of the Talairach cerebral atlas. The normalized
images were smoothed with an isotropic Gaussian kernel of 2×2×2
mm3 (FWHM). A target image with a voxel size of 2×2×2
mm3 and an image matrix of 128×128 was then prepared.
Statistical analysis
To compare CBF between MDD patients and controls, a
second-level random-effects two-sample t-test was performed on
individual CBF maps in a voxel-by-voxel manner. The resulting
statistical map was set at a combined threshold of corrected
P<0.005 and a minimum cluster size of 10 voxels. Each cerebral
region in which the CBF changed in MDD patients, compared with the
control group, was used as a region of interest (ROI). The
sketching of ROIs and the extraction of average CBF were performed
using the AW4.5 workstation.
To compare SUV between MDD patients and controls, a
second-level random-effects two-sample t-test of voxel-based
statistical analyses was performed on the cerebral
18F-FDG PET images. Corrected P<0.005 and a minimum
cluster size of 10 voxels was used. Each cerebral region in which
the SUV changed in MDD patients, compared with the control group,
was used as an ROI. The sketching of ROIs and the calculation of
average SUV were performed using the AW4.5 workstation.
Pearson correlation analysis was used to compare
regional CBF values and SUV in abnormal activation cerebral regions
of prefrontal lobes in MDD patients. It was also used to compare
CBD and SUV in abnormal activation cerebral regions with HAMD
scores. Analyses were conducted using SPSS 17.0 software (SPSS,
Inc., Chicago, IL, USA). P<0.05 was considered to indicate a
statistically significant difference.
Results
Patient eligibility
Following exclusion of 6 of the 23 MDD patients and
2 of the 18 healthy subjects due to excessive movement during
3D-ASL scanning, 17 patients and 16 healthy controls were included
in the qualitative analyses (Table
I). No significant differences were identified between the
groups in terms of age, years of education or male/female ratio.
However, HAMD and HAMA scores were significantly higher in the MDD
group compared with the control group (both P<0.05). The HAMD
scores of the MDD patients and healthy controls are presented in
greater detail in Table II.
| Table II.HAMD scores of patients with MDD and
healthy controls. |
Table II.
HAMD scores of patients with MDD and
healthy controls.
| HAMD item | MDD | Control |
|---|
| HAMD aggregate | 18.50±2.57 | 4.65±1.58 |
|
Anxiety/somatization |
2.78±0.15 | 0.65±0.02 |
| Weight |
0.72±0.03 | 0.31±0.03 |
| Cognitive
disturbance |
3.41±0.37 | 0.78±0.05 |
| Diurnal
variation |
2.88±0.26 | 0.62±0.03 |
| Retardation |
3.63±0.45 | 0.81±0.06 |
| Sleep
disturbance |
1.40±0.18 | 0.56±0.02 |
| Hopelessness |
3.68±0.54 | 0.92±0.04 |
Brain 3D-ASL and 18F-FDG
PET results
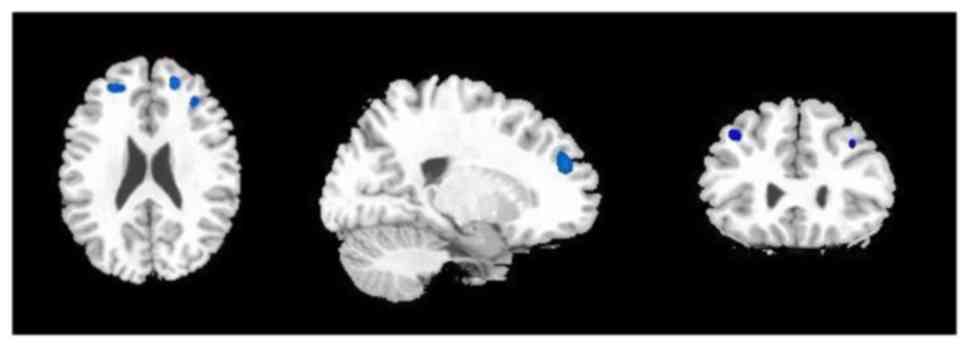
Decreased CBF was demonstrated in the bilateral
middle and the right superior frontal gyrus in patients with MDD
compared with controls (Fig. 1 and
Table III). No other regions with
decreased or increased CBF were observed.
| Table III.Correlation (r) between SUVs and CBF
values in the activated cerebral regions in the frontal lobes of
patients with major depressive disorder. |
Table III.
Correlation (r) between SUVs and CBF
values in the activated cerebral regions in the frontal lobes of
patients with major depressive disorder.
| Cerebral area | SUV | CBF (ml/min/100
g) | r |
|---|
| Left superior
frontal gyrus | 4.15±0.23 |
|
|
| Left middle frontal
gyrus | 4.72±0.56 | 43.15±4.21 | 0.63a |
| Left inferior
frontal gyrus | 4.29±0.41 |
|
|
| Right superior
frontal gyrus | 4.39±0.35 | 46.71±3.57 | 0.12 |
| Right middle
frontal gyrus | 4.92±0.63 | 49.35±4.15 | 0.04 |
| Right inferior
frontal gyrus | 4.85±0.55 |
|
|
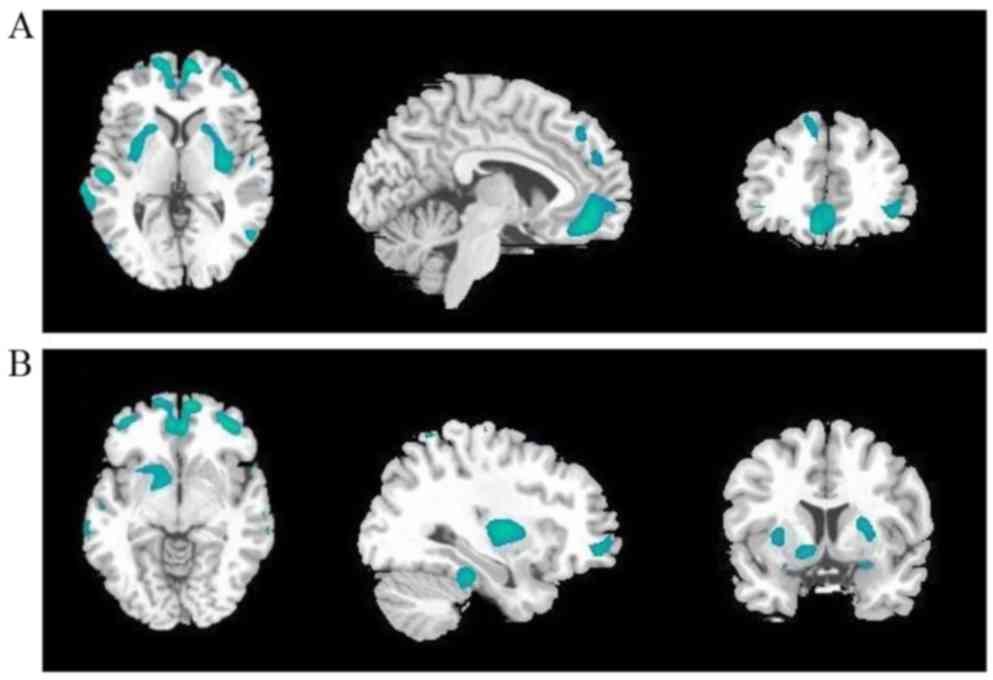
Decreased SUVs of 18F-PDG were observed
in the bilateral superior, middle and inferior frontal gyrus,
bilateral superior and middle temporal gyrus, bilateral anterior
cingulate cortex, bilateral putamen and caudate, and the left
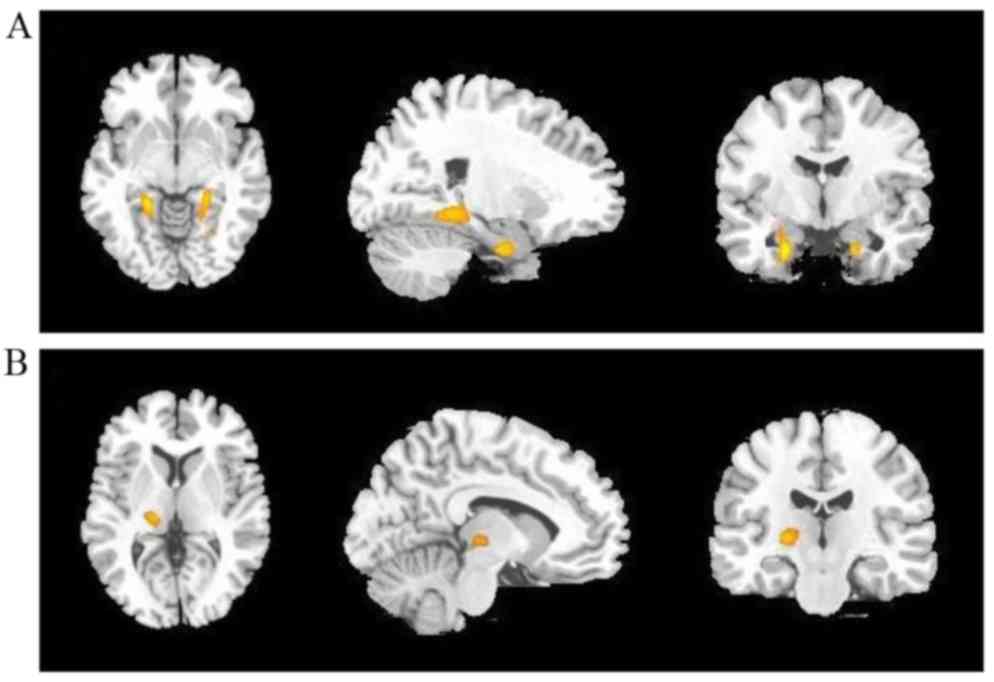
pallidum in patients with MDD compared with controls (Fig. 2 and Table III). Moreover, increased SUVs were
observed in the bilateral hippocampus and left thalamus (Fig. 3 and Table III).
In the prefrontal cerebral regions, CBF values and
SUV were positively correlated in the left middle frontal gyrus
(Table III).
Analysis of the correlation of CBF and
SUVs in prefrontal cerebral regions with HAMD scores
CBF values in the right middle frontal gyrus were
positively correlated with cognitive impairment. CBF values in the
left middle frontal gyrus were negatively correlated with anxiety.
CBF values in the left and right middle frontal gyrus were
positively correlated with HAMD aggregate score (Table IV).
| Table IV.Correlation (r) between HAMD scores
and cerebral blood flow values in the abnormally activated cerebral
regions of patients with major depressive disorder. |
Table IV.
Correlation (r) between HAMD scores
and cerebral blood flow values in the abnormally activated cerebral
regions of patients with major depressive disorder.
| HAMD item | Left middle frontal
gyrus | Right superior
frontal gyrus | Right middle
frontal gyrus |
|---|
| HAMD aggregate | 0.61a | 0.16 | 0.54a |
| Anxiety | −0.69a | 0.28 | 0.13 |
| Weight | 0.26 | 0.17 | 0.42 |
| Cognitive
impairment | 0.13 | −0.15 | 0.59a |
| Diurnal
variation | −0.32 | −0.06 | 0.26 |
| Retardation | 0.31 | 0.28 | 0.27 |
| Sleep
disturbance | 0.42 | 0.19 | 0.34 |
| Hopelessness | 0.19 | 0.46 | 0.33 |
SUVs in the left and right middle frontal gyrus were
positively correlated with cognitive impairment. SUVs in the right
inferior frontal gyrus were negatively correlated with anxiety, and
SUVs in the left middle and right inferior frontal gyrus were
negatively correlated with retardation. Furthermore, the values in
both the left and right middle frontal gyrus were positively
correlated with HAMD aggregate score (Table V).
| Table V.Correlation (r) between HAMD scores
and standardized uptake values in the abnormally activated cerebral
regions of patients with major depressive disorder. |
Table V.
Correlation (r) between HAMD scores
and standardized uptake values in the abnormally activated cerebral
regions of patients with major depressive disorder.
| HAMD item | Left superior
frontal gyrus | Left middle frontal
gyrus | Left inferior
frontal gyrus | Right superior
frontal gyrus | Right middle
frontal gyrus | Right inferior
frontal gyrus |
|---|
| HAMD aggregate | 0.09 | 0.58a | 0.13 | 0.16 | 0.62a | 0.23 |
| Anxiety | 0.42 | 0.31 | 0.37 | 0.41 | 0.44 | −0.71a |
| Weight | 0.16 | −0.07 | 0.34 | 0.41 | 0.29 | 0.33 |
| Cognitive
impairment | −0.12 | 0.55a | 0.07 | 0.25 | 0.52a | 0.36 |
| Diurnal
variation | 0.05 | 0.23 | 0.12 | 0.35 | 0.14 | 0.29 |
| Retardation | 0.37 | −0.67a | 0.03 | 0.16 | 0.23 | −0.64a |
| Sleep
disturbance | −0.21 | 0.28 | −0.24 | 0.14 | 0.25 | 0.16 |
| Hopelessness | 0.14 | −0.19 | 0.26 | 0.33 | 0.18 | 0.26 |
Discussion
In the current study, patients with MDD had
decreased cerebral blood perfusion and glucose metabolism in the
prefrontal lobes compared with healthy controls. Although these
findings are similar to those from previous mono-mode studies using
ASL or FDG PET (15,16), it is notable that the abnormal
cerebral regions demonstrated in the two previous imaging studies
did not fully correspond with those in this dual-mode trial. The
cerebral hypometabolism in the FDG PET images involved a much wider
brain area compared with the cerebral hypoperfusion images. Besides
the bilateral superior, middle and inferior frontal gyrus,
decreased SUVs were also observed in other cerebral regions, such
as the bilateral middle and superior temporal gyrus, the bilateral
lenticular nuclei and caudate nuclei, the left globus pallidus and
the bilateral anterior cingulate gyri. Moreover, the bilateral
hippocampi and the left thalamus presented hypermetabolism.
Abnormalities in limbic-cortex-striatum-pallidus-thalamus (LCSPT)
serve an important role in emotion regulation and conduction
(17). Research has demonstrated
that there are qualitative changes of LCSPT in patients with
depression (18). The prefrontal
cortex, anterior cingulate gyrus, basal ganglia, thalamus,
hippocampus are important components of LCSPT (19). In the present study, abnormalities
were identified in these cerebral regions, which were consistent
with the currently recognized hypothesis of LCSPT neural circuitry.
However, cerebral hypoperfusion in the brain 3D-ASL maps was only
observed in the bilateral middle frontal and the right superior
gyrus in these patients. The difference in the cerebral changes
between the two methods may be associated with molecular biological
changes of the brain in depression disorder (20) and also may result from the different
imaging mechanisms used in the two techniques (21,22). The
current findings from dual-mode imaging not only imply that FDG PET
is more sensitive than 3D-ASL in identifying functional
abnormalities, but also suggest that the prefrontal lobe may be the
principal brain region involved in depression. This lends support
to the theory that prefrontal dysfunction is the pathological basis
of depression onset and a sign of depressive status (4). SUVs or CBF values may be used as valid
markers to quantitatively evaluate severity and monitor the effects
of treatment in MDD.
Prefrontal dysfunction can directly interfere with
the functional connectivity of default networks in depression
(23), which results in relevant
clinical symptoms (24). Therefore,
functional abnormalities of the prefrontal lobe can be associated
with multiple symptoms in patients with depression. In the current
study, patients' clinical symptoms were divided into seven factors
and quantitatively evaluated according to the HAMD. Correlation
analysis between SUV and CBF values in each prefrontal gyrus and
each symptom factor score were performed, in order to verify the
function of each cerebral region and identify the cerebral region
responsible for depression onset. Correlations were observed
between the SUV and CBF values and multiple HAMD factor scores,
including cognitive impairment, retardation, anxiety and aggregate
scores. Correlations were primarily observed in the left middle,
right middle and right inferior frontal gyrus. This implies that
functional abnormality in the prefrontal lobe is closely associated
with behavioral changes, and the bilateral middle and right
inferior frontal gyrus may be the cerebral region responsible for
depression onset in patients with MDD.
Changes in CBF values and SUV were most evident in
the left middle frontal gyrus among all of the abnormal prefrontal
regions. Not only were SUV and CBF values positively correlated
with each other in this region, they were also closely correlated
with multiple symptom factors. Such predominance of functional
impairment in the left prefrontal lobe over the right side has also
been reported in previous studies (25–27).
Hamilton et al (25) reported
that the local cerebral functional consistency in bilateral middle
frontal gyri was negatively correlated with all seven HAMD factors.
Nishi et al (26) reported
that the local CBF in the left superior and right middle frontal
gyrus in depressed patients at the resting state was positively
correlated with cognitive impairment factor scores. These findings
suggest that, among these prefrontal regions, the left middle
frontal gyrus may be a key responsible functional region in
patients with MDD. Although the current results from dual-mode
imaging provide compelling evidence in support of this, a
convincing theoretical explanation has not yet been reached on
asymmetric prefrontal damage. It is proposed that the left
prefrontal lobe may have more active functional connectivity in the
default network of depression. This phenomenon of left-tendency is
worthy of further attention in future research. Further studies on
neural functional connectivity networks of the prefrontal lobe are
required to elucidate this issue.
Besides the prefrontal lobes, there were other
abnormal cerebral regions observed in PET images, such as decreased
SUVs in the bilateral temporal lobes, bilateral basal ganglia and
bilateral anterior cingulate gyri, and increased SUVs in the
bilateral hippocampi and left thalamus. These findings are
consistent with previous results (28). Kennedy et al (29) reported reduced glucose metabolism in
the caudate nucleus and putamen in patients with depression.
Kimbrell et al (30) detected
decreased SUVs in anterior cingulated gyri. However, some
contradicting results have also been reported. De Asis et al
(31) reported increased FDG uptake
in the anterior cingulate cortex. These contradictory results may
result from differences in the types and stages of depression, and
in treatment and imaging equipment. They may also reflect the
complexity of the etiology and pathomechanisms of depressive
disorder. Nevertheless, it may be noted that these abnormal
cerebral regions are principal components of the neural circuit of
depression, and can contribute to depression onset by disturbing
the function of neural networks.
There were some limitations in the current study.
First, the ages of the patients with MDD varied widely (18–50
years) and cerebral function, particularly FDG metabolism, may be
affected by age. However, the age-matched healthy controls may have
eliminated this effect. Second, the current study focused on
assessing the function of the prefrontal lobe, so data obtained
from other abnormally activated cerebral regions were not
statistically analyzed or considered in-depth. Third, it was not
possible to conduct a study contrasting pre- and post-therapy
results for these patients, because only a small number of patients
underwent dual-mode examinations after treatment. In the future, it
would be valuable to conduct studies that overcome these
limitations.
To the best of our knowledge, the current study was
the first to use dual-mode 3D-ASL and FDG PET/CT to assess the
function of the prefrontal lobe in MDD patients. The results from
this trial suggest that 18F-FDG PET/CT is more sensitive
than 3D-ASL in identifying functional abnormalities in MDD
patients. Decreased CBF and SUV in the prefrontal lobe were
indicated to be closely correlated with depressive symptoms in MDD
patients. The left middle frontal gyrus may be a key responsible
functional region in MDD.
Acknowledgements
The authors would like to thank Weifeng Zhang,
Huiqiang Li, Min Guan and Li Zhang for their assistance in patient
scanning and data analysis.
References
|
1
|
Knutson B, Bhanji JP, Cooney RE, Atlas LY
and Gotlib IH: Neural responses to monetary incentives in major
depression. Biol Psychiatry. 63:686–692. 2008. View Article : Google Scholar : PubMed/NCBI
|
|
2
|
Adrien J: Neurobiological bases for the
relation between sleep and depression. Sleep Med Rev. 6:341–351.
2002. View Article : Google Scholar : PubMed/NCBI
|
|
3
|
Macey PM, Woo MA, Kumar R, Cross RL and
Harper RM: Relationship between obstructive sleep apnea severity
and sleep, depression and anxiety symptoms in newly-diagnosed
patients. PLoS One. 5:e102112010. View Article : Google Scholar : PubMed/NCBI
|
|
4
|
Kameyama M, Fukuda M, Yamagishi Y, Sato T,
Uehara T, Ito M, Suto T and Mikuni M: Frontal lobe function in
bipolar disorder: A multichannel near-infrared spectroscopy study.
Neuroimage. 29:172–184. 2006. View Article : Google Scholar : PubMed/NCBI
|
|
5
|
Galazzo I Boscolo, Mattoli MV, Pizzini FB,
De Vita E, Barnes A, Duncan JS, Jäger HR, Golay X, Bomanji JB,
Koepp M, et al: Cerebral metabolism and perfusion in MR-negative
individuals with refractory focal epilepsy assessed by simultaneous
acquisition of (18)F-FDG PET and arterial spin labeling. Neuroimage
Clin. 11:648–657. 2016. View Article : Google Scholar : PubMed/NCBI
|
|
6
|
Lee HS, Choo IH, Lee DY, Kim JW, Seo EH,
Kim SG, Park SY, Shin JH, Kim KW and Woo JI: Frontal dysfunction
underlies depression in mild cognitive impairment: A FDG-PET study.
Psychiatry Investig. 7:208–214. 2010. View Article : Google Scholar : PubMed/NCBI
|
|
7
|
Lui S, Parkes LM, Huang X, Zou K, Chan RC,
Yang H, Zou L, Li D, Tang H, Zhang T, et al: Depressive disorders:
Focally altered cerebral perfusion measured with arterial
spin-labeling MR imaging. Radiology. 251:476–484. 2009. View Article : Google Scholar : PubMed/NCBI
|
|
8
|
Mayberg HS, Brannan SK, Tekell JL, Silva
JA, Mahurin RK, McGinnis S and Jerabek PA: Regional metabolic
effects of fluoxetine in major depression: Serial changes and
relationship to clinical response. Biol Psychiatry. 48:830–843.
2000. View Article : Google Scholar : PubMed/NCBI
|
|
9
|
Hamilton M: A rating scale for depression.
J Neurol Neurosurg Psychiatry. 23:56–62. 1960. View Article : Google Scholar : PubMed/NCBI
|
|
10
|
Vasic N, Wolf ND, Grön G, Sosic-Vasic Z,
Connemann BJ, Sambataro F, von Strombeck A, Lang D, Otte S, Dudek M
and Wolf RC: Baseline brain perfusion and brain structure in
patients with major depression: A multimodal magnetic resonance
imaging study. J Psychiatry Neurosci. 40:412–421. 2015. View Article : Google Scholar : PubMed/NCBI
|
|
11
|
Graff-Guerrero A, González-Olvera J,
Mendoza-Espinosa Y, Vaugier V and Garcı́a-Reyna JC: Correlation
between cerebral blood flow and items of the Hamilton rating scale
for depression in antidepressant-naive patients. J Affect Disord.
80:55–63. 2004. View Article : Google Scholar : PubMed/NCBI
|
|
12
|
Wu JC, Gillin JC, Buchsbaum MS, Schachat
C, Darnall LA, Keator DB, Fallon JH and Bunney WE: Sleep
deprivation PET correlations of Hamilton symptom improvement
ratings with changes in relative glucose metabolism in patients
with depression. J Affect Disord. 107:181–186. 2008. View Article : Google Scholar : PubMed/NCBI
|
|
13
|
American Psychiatric Association, .
Diagnostic and statistical manual of mental disorders. 4th.
Washington, DC: 2000
|
|
14
|
Maier W, Buller R, Philipp M and Heuser I:
The Hamilton anxiety scale: Reliability, validity and sensitivity
to change in anxiety and depressive disorders. J Affect Disord.
14:61–68. 1988. View Article : Google Scholar : PubMed/NCBI
|
|
15
|
Orosz A, Jann K, Federspiel A, Horn H,
Höfle O, Dierks T, Wiest R, Strik W, Müller T and Walther S:
Reduced cerebral blood flow within the default-mode network and
within total gray matter in major depression. Brain Connect.
2:303–310. 2012. View Article : Google Scholar : PubMed/NCBI
|
|
16
|
Wei K, Xue HL, Guan YH, Zuo CT, Ge JJ,
Zhang HY, Liu BJ, Cao YX, Dong JC and Du YJ: Analysis of glucose
metabolism of (18)F-FDG in major depression patients using PET
imaging: Correlation of salivary cortisol and α-amylase. Neurosci
Lett. 629:52–57. 2016. View Article : Google Scholar : PubMed/NCBI
|
|
17
|
Clark L, Chamberlain SR and Sahakian BJ:
Neurocognitive mechanisms in depression: Implications for
treatment. Annu Rev Neurosci. 32:57–74. 2009. View Article : Google Scholar : PubMed/NCBI
|
|
18
|
Seminowicz D, Mayberg H, McIntosh A,
Goldapple K, Kennedy S, Segal Z and Rafi-Tari S: Limbic-frontal
circuitry in major depression: A path modeling metanalysis.
Neuroimage. 22:409–418. 2004. View Article : Google Scholar : PubMed/NCBI
|
|
19
|
Nauta WJ: Neural associations of the
frontal cortex. Acta Neurobiol Exp (Wars). 32:125–140.
1972.PubMed/NCBI
|
|
20
|
van Hoeij F, Keijsers R, Loffeld B, Dun G,
Stadhouders P and Weusten B: Incidental colonic focal FDG uptake on
PET/CT: Can the maximum standardized uptake value (SUVmax) guide us
in the timing of colonoscopy? Eur J Nucl Med Mol Imaging. 42:66–71.
2015. View Article : Google Scholar : PubMed/NCBI
|
|
21
|
Vidorreta M, Wang Z, Rodríguez I, Pastor
MA, Detre JA and Fernández-Seara MA: Comparison of 2D and 3D
single-shot ASL perfusion fMRI sequences. Neuroimage. 66:662–671.
2013. View Article : Google Scholar : PubMed/NCBI
|
|
22
|
Towgood KJ, Pitkanen M, Kulasegaram R,
Fradera A, Soni S, Sibtain N, Reed LJ, Bradbeer C, Barker GJ, Dunn
JT, et al: Regional cerebral blood flow and FDG uptake in
asymptomatic HIV-1 men. Hum Brain Mapp. 34:2484–2493. 2013.
View Article : Google Scholar : PubMed/NCBI
|
|
23
|
Greicius MD, Flores BH, Menon V, Glover
GH, Solvason HB, Kenna H, Reiss AL and Schatzberg AF: Resting-state
functional connectivity in major depression: Abnormally increased
contributions from subgenual cingulate cortex and thalamus. Biol
Psychiatry. 62:429–437. 2007. View Article : Google Scholar : PubMed/NCBI
|
|
24
|
Lui S, Deng W, Huang X, Jiang L, Ma X,
Chen H, Zhang T, Li X, Li D, Zou L, et al: Association of cerebral
deficits with clinical symptoms in antipsychotic-naive
first-episode schizophrenia: An optimized voxel-based morphometry
and resting state functional connectivity study. Am J Psychiatry.
166:196–205. 2009. View Article : Google Scholar : PubMed/NCBI
|
|
25
|
Hamilton JP, Etkin A, Furman DJ, Lemus MG,
Johnson RF and Gotlib IH: Functional neuroimaging of major
depressive disorder: A meta-analysis and new integration of base
line activation and neural response data. Am J Psychiatry.
169:693–703. 2012. View Article : Google Scholar : PubMed/NCBI
|
|
26
|
Nishi H, Sawamoto N, Namiki C, Yoshida H,
Dinh HD, Ishizu K, Hashikawa K and Fukuyama H: Correlation between
cognitive deficits and glucose hypometabolism in mild cognitive
impairment. J Neuroimaging. 20:29–36. 2010. View Article : Google Scholar : PubMed/NCBI
|
|
27
|
Bench CJ, Friston KJ, Brown RG, Scott LC,
Frackowiak RS and Dolan RJ: The anatomy of melancholia-focal
abnormalities of cerebral blood flow in major depression. Psychol
Med. 22:607–615. 1992. View Article : Google Scholar : PubMed/NCBI
|
|
28
|
Brody AL, Saxena S, Silverman DH,
Alborzian S, Fairbanks LA, Phelps ME, Huang SC, Wu HM, Maidment K
and Baxter LR Jr: Brain metabolic changes in major depressive
disorder from pre-to post-treatment with paroxetine. Psychiatry
Res. 91:127–139. 1999. View Article : Google Scholar : PubMed/NCBI
|
|
29
|
Kennedy SH, Evans KR, Krüger S, Mayberg
HS, Meyer JH, McCann S, Arifuzzman AI, Houle S and Vaccarino FJ:
Changes in regional brain glucose metabolism measured with positron
emission tomography after paroxetine treatment of major depression.
Am J Psychiatry. 158:899–905. 2001. View Article : Google Scholar : PubMed/NCBI
|
|
30
|
Kimbrell TA, Ketter TA, George MS, Little
JT, Benson BE, Willis MW, Herscovitch P and Post RM: Regional
cerebral glucose utilization in patients with a range of severities
of unipolar depression. Biol Psychiatry. 51:237–252. 2002.
View Article : Google Scholar : PubMed/NCBI
|
|
31
|
de Asis JM, Silbersweig DA, Pan H, Young
RC and Stern E: Neuroimaging studies of fronto-limbic dysfunction
in geriatric depression. Clin Neurosci Res. 2:324–330. 2003.
View Article : Google Scholar
|