Introduction
Melatonin (MLT) is a neuroendocrine hormone produced
by the pineal gland under physiological conditions and is regulated
by the suprachiasmatic nucleus, according to the circadian rhythm
(1). MLT can regulate circadian
rhythms, the sleep and wakefulness circadian phase and improve
sleep (2). According to recent
studies, MLT also plays an important role in anti-oxidative stress,
as well as in anti-inflammatory and anti-apoptotic processes
(3). The MLT receptor is widely
distributed in retinal ganglion cells, and it may be involved in
the formation of light reaction pathways and all forms of
retinopathy (4).
The present study aimed to analyze the regulatory
mechanism of MLT on mouse retinal ganglion cell photoreaction.
Materials and methods
Animals
A total of 48 healthy, 3-week-old ICR mice (male or
female), weighing 7.2±1.3 g, were purchased from Charles River
(Boston, MA, USA). The mice were maintained at conventional
breeding temperature (23±2°C) and relative humidity (55±5%). The
animals were then randomly divided into 4 groups. Group A had an
illumination/dark cycle of 0 h/24 h, group B had 6 h/18 h, group C
had 12 h/12 h and group D had 18 h/6 h. The dark condition was
breeding room brightness <0.0004 cd/m2. The mice
underwent these treatments for up to 6 weeks. Four mice were
sacrificed by cervical dislocation at week 1, 3 and 6,
respectively, and retinal ganglion cells were harvested.
Enzyme-linked immunosorbent assay (ELISA) was used to measure
nocturnal plasma MLT levels at midnight, and immunohistochemical
staining was used to detect expression of the retinal MLT receptor
and the expression levels of inducible nitric oxide synthase (iNOS)
and c-fos protein.
The study was approved by the Ethics Committee of
Qilu Hospital of Shandong University (Shandong, China).
Test method
Mice were anaesthetized by peritoneal injection of
10% chloral hydrate at midnight, the chest was quickly opened to
expose the heart, and the left ventricle was punctured to collect 5
ml of blood in EDTA anticoagulant tubes. Blood was maintained at
room temperature, and centrifuged for 15 min at 2,500 × g, the
supernatant was aspirated and stored at −80°C until testing.
Reagents and instruments
The MLT kit was purchased from Abcam (Cambridge,
UK). Mouse monoclonal MLT receptor antibody (dilution, 1:200;
catalog no. ab167108), mouse polyclonal iNOS antibody (dilution,
1:200; catalog no. ab21775) and mouse monoclonal c-fos antibody
(dilution, 1:200; catalog no. ab208942) were purchased from Abcam
(Cambridge, UK). SP immunohistochemistry kit was purchased from
ZSGB-BIO Co., Ltd. (Beijing, China), and the diaminobenzidine (DAB)
chromogenic reagent kit was obtained from Wuhan Boster Biological
Technology Co., Ltd. (Wuhan, China).
Benchtop was purchased from Sunray Borui
Experimental Equipment Co., Ltd. (Beijing, China), ELISA kit was
purchased from Thermo Fisher Scientific, Inc. (Waltham, MA, USA),
tissue slicing machine was purchased from Leica (Wetzlar, Germany),
digital micropipette was purchased from Finnpipette (Vantaa,
Finland), micro-ophthalmic surgical instruments were purchased from
Suzhou Medical Supplies Factory Co., Ltd. (Suzhou, China), Nikon
optical microscope was purchased from Nikon (Tokyo, Japan), and the
Image-Pro Plus professional image analysis system (6th edition) was
purchased from Media Cybernetics (Rockville, MD, USA).
ELISA
The kit was stored at room temperature (20–28°C),
the standards and samples for testing were added to the wells with
each well containing 100 µl. Subsequently, 50 µl of enzyme-linked
affinity reagent was added to each well and mixed, the microtiter
plate was covered and allowed to incubate for 60 min at 37°C, and
the wells were washed 5 times with cleaning solutions. Substrate I
and II (50 µl each) were successively added to each well and mixed
fully at room temperature for 15 min in the dark. Stop solution (50
µl) was then added and mixed to fully stop the reaction. The ELISA
plate reader (Bio-Rad, Hercules, CA, USA) was used to read optical
density (OD) values at 450 nm, within 30 min and calculations for
the test sample values were made by referring to the standard
curve.
Tissue harvesting and processing
The eyeballs were quickly enucleated and surrounding
soft tissue was removed, a small amount of freshly prepared fixing
solution was injected at the edge of the corneoscleral to the
vitreous chamber with a 1 ml syringe, the eyeball was soaked in the
mixed stationary liquid for 24 h until the tissue hardened, the
cornea was cut off along the cornea ring, under a microscope
(Olympus, Tokyo, Japan), and the remaining eyeball was soaked in
the mixed stationary liquid to fully fix for 24 h. It was then
washed in flowing water for 24 h, and underwent conventional
gradient alcohol dehydration, and xylene paraffin embedding. The
wax blocks were cut into 5 sections, with each slice cut at 4 µm
thickness for immunohistochemical staining. Tissue sections were
placed on glass slides treated with polylysine and placed in a
thermostat set to 60°C for 3 h.
Immunohistochemistry
Slides were dewaxed by conventional methods, washed
twice with distilled water for 5 min, incubated in
phosphate-buffered saline (PBS) for 5 min, incubated for 10 min at
room temperature with freshly prepared 3%
H2O2, and soaked in PBS three times for 5
min. Slides then underwent microwave antigen retrieval. After
cooling, they were washed with distilled water and blocked in
normal goat serum at room temperature for 30 min. The serum was
discarded and primary antibody (1:300) was added (PBS was used as a
negative control in place of primary antibody) and placed at 4°C
for 20 h. The slides were allowed to rewarm for 1 h at room
temperature, and soaked in PBS four times for 5 min.
Biotin-labelled secondary antibody was added and allowed to
incubate at 37°C for 10 min, after which the slides underwent PBS
cleaning three times for 5 min. Horseradish peroxidase-labeled
streptavidin solution (S-A/HRP) was added and incubated at 37°C for
10 min, followed by PBS cleaning three times for 5 min. DAB was
added for color development and distilled water was used 10 min
later to terminate the reaction. The slides were then
counterstained with hematoxylin for 3 min, washed with running
water for 5 min, treated with hydrochloric acid alcohol
differentiation, washed for 5 min, and treated with gradient
alcohol dehydration, xylene, and neutral balata. Sections on the
slides were observed under a microscope (Olympus), and we chose
regions that had integrate cells and were well stained to collect
data for computer input. Image-Pro Plus 6.0 was used to choose the
immune yellow area in the image as AOI, to record the IOD value
calculated by the software, and then to calculate the average
optical density.
Statistical analysis
The data were analyzed by SPSS 19.0 statistical
software (Chicago, IL, USA). Quantitative data were expressed as
mean ± standard deviation. Comparison between groups was made using
one-way ANOVA test followed by post hoc test (Least Significant
Difference). Enumeration data are expressed as case number or
percentage, and comparisons between groups were performed using the
χ2 test. P<0.05 was considered to indicate a
statistically significant difference.
Results
Comparison of the plasma levels of
MLT
A comparison of the light reactions of the 4 groups
at week 1, 3 and 6 revealed no statistical differences (P>0.05).
At the same time-points, group C had the highest MLT levels,
followed by group B and group D, while group A had the lowest, and
the differences were statistically significant (P<0.05)
(Table I).
 | Table I.Comparison of the plasma levels of
melatonin (pg/ml). |
Table I.
Comparison of the plasma levels of
melatonin (pg/ml).
|
| Illumination |
|
|
|---|
|
|
|
|
|
|---|
| Groups | 1 week | 3 weeks | 6 weeks | F-value | P-value |
|---|
| A | 68.7±12.3 | 63.5±14.2 | 64.6±15.5 | 0.627 | 0.538 |
| B | 125.9±36.7 | 136.2±37.8 | 127.9±34.5 | 0.349 | 0.126 |
| C | 166.8±42.5 | 172.4±40.3 | 169.6±42.7 | 0.528 | 0.727 |
| D | 133.4±32.1 | 145.5±32.6 | 137.7±33.5 | 0.109 | 0.935 |
| F-value | 8.624 | 8.769 | 8.928 |
|
|
| P-value | <0.001 | <0.001 | <0.001 |
|
|
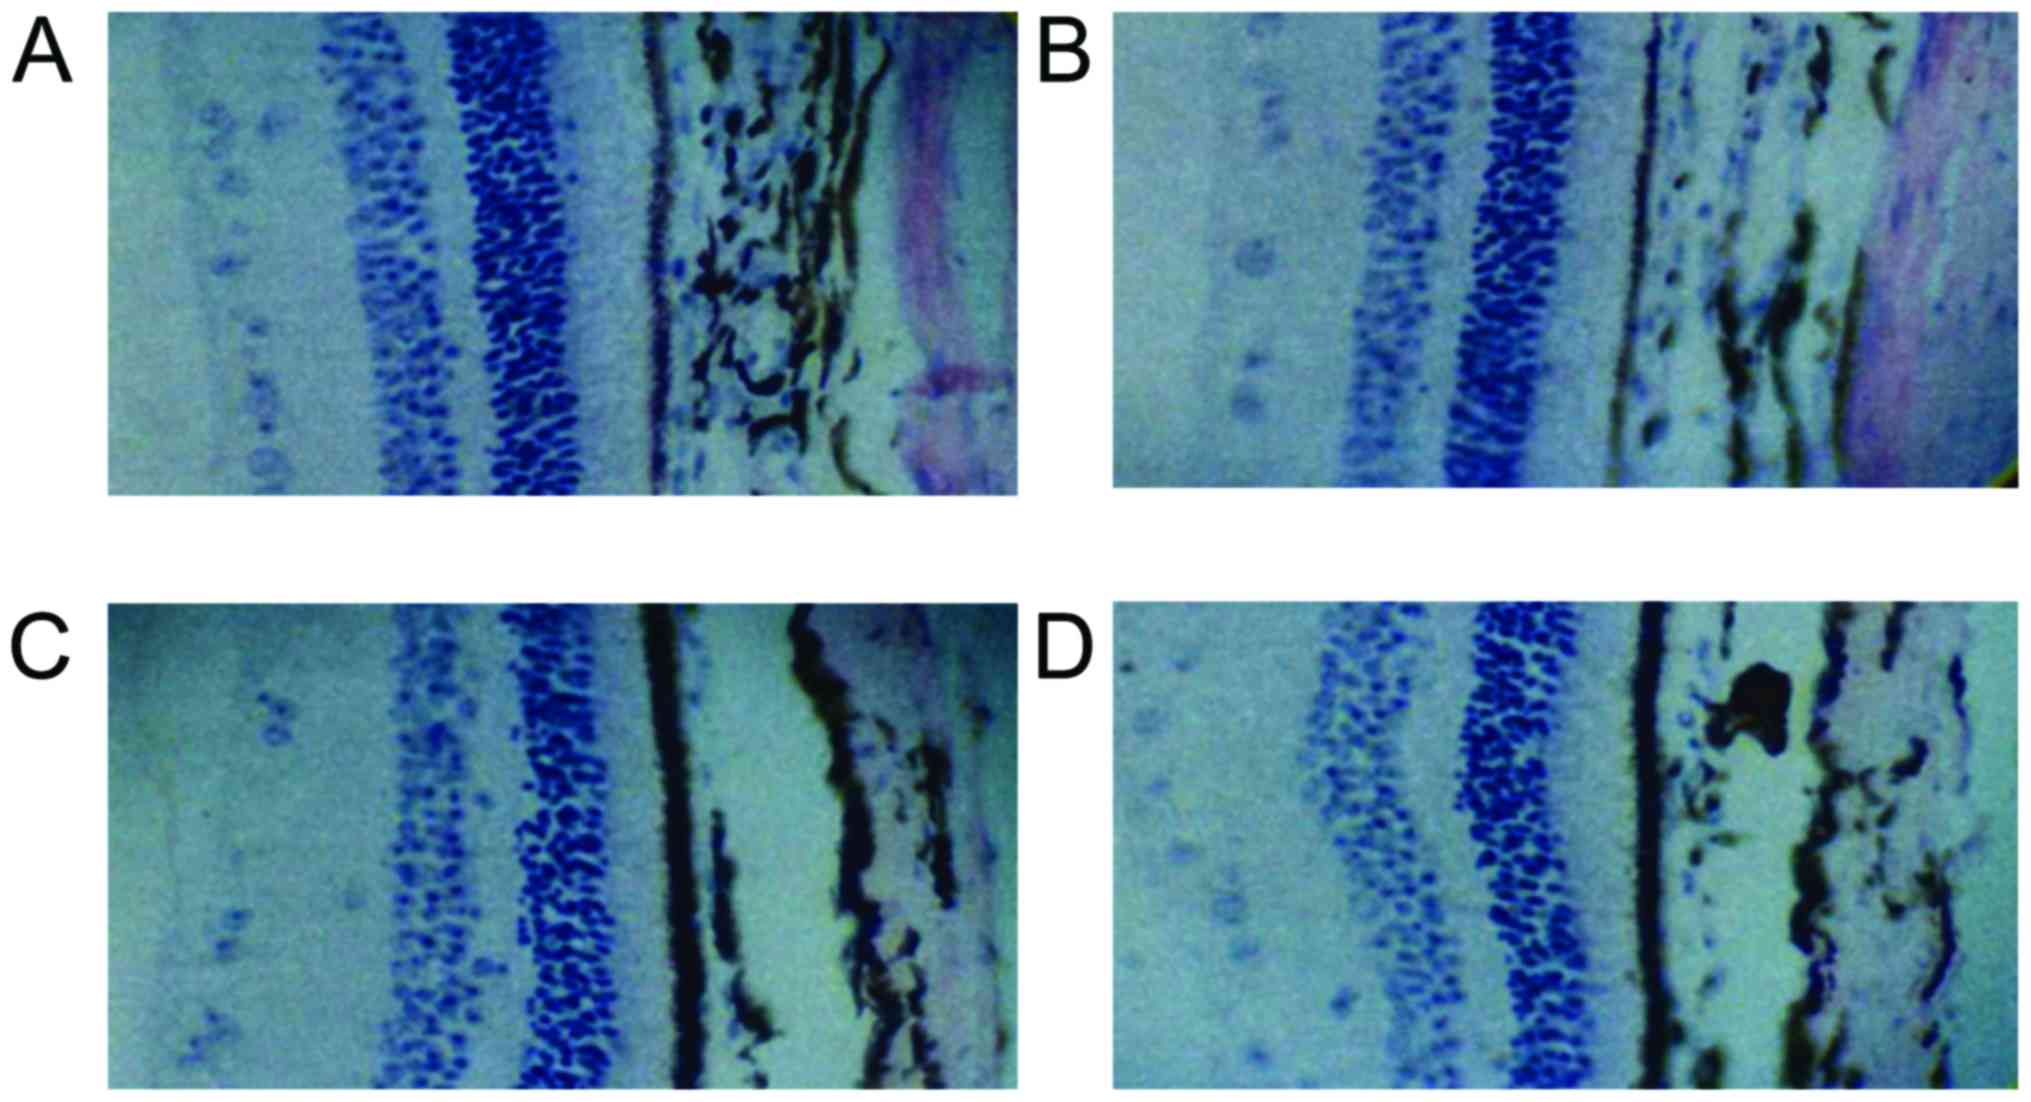
Comparison of MLT receptor expression
levels
MLT receptor was stained pale brown, mainly located
in the retinal pigment on the outer cortex and the kernel layer.
The expression was detected inside the nucleus and cytoplasm. At
each time-point, the MLT receptor expression levels of group C was
the highest, followed by groups B, D and A, and the differences
were statistically significant (P<0.05). Except for group A, the
MLT receptor expression levels of the other three groups increased
with illumination time, and the differences were statistically
significant (P<0.05) (Table II
and Fig. 1).
| Table II.Relative expression levels of the
melatonin receptor. |
Table II.
Relative expression levels of the
melatonin receptor.
|
| Illumination |
|
|
|---|
|
|
|
|
|
|---|
| Groups | 1 week | 3 weeks | 6 weeks | F-value | P-value |
|---|
| A | 0.09±0.02 | 0.10±0.02 | 0.09±0.02 | 0.264 | 0.336 |
| B | 0.27±0.04 | 0.32±0.06 | 0.35±0.07 | 6.328 | 0.019 |
| C | 0.43±0.03 | 0.48±0.06 | 0.54±0.05 | 6.635 | 0.017 |
| D | 0.28±0.05 | 0.31±0.05 | 0.36±0.08 | 6.269 | 0.021 |
| F-value | 9.302 | 9.426 | 9.687 |
|
|
| P-value | <0.001 | <0.001 | <0.001 |
|
|
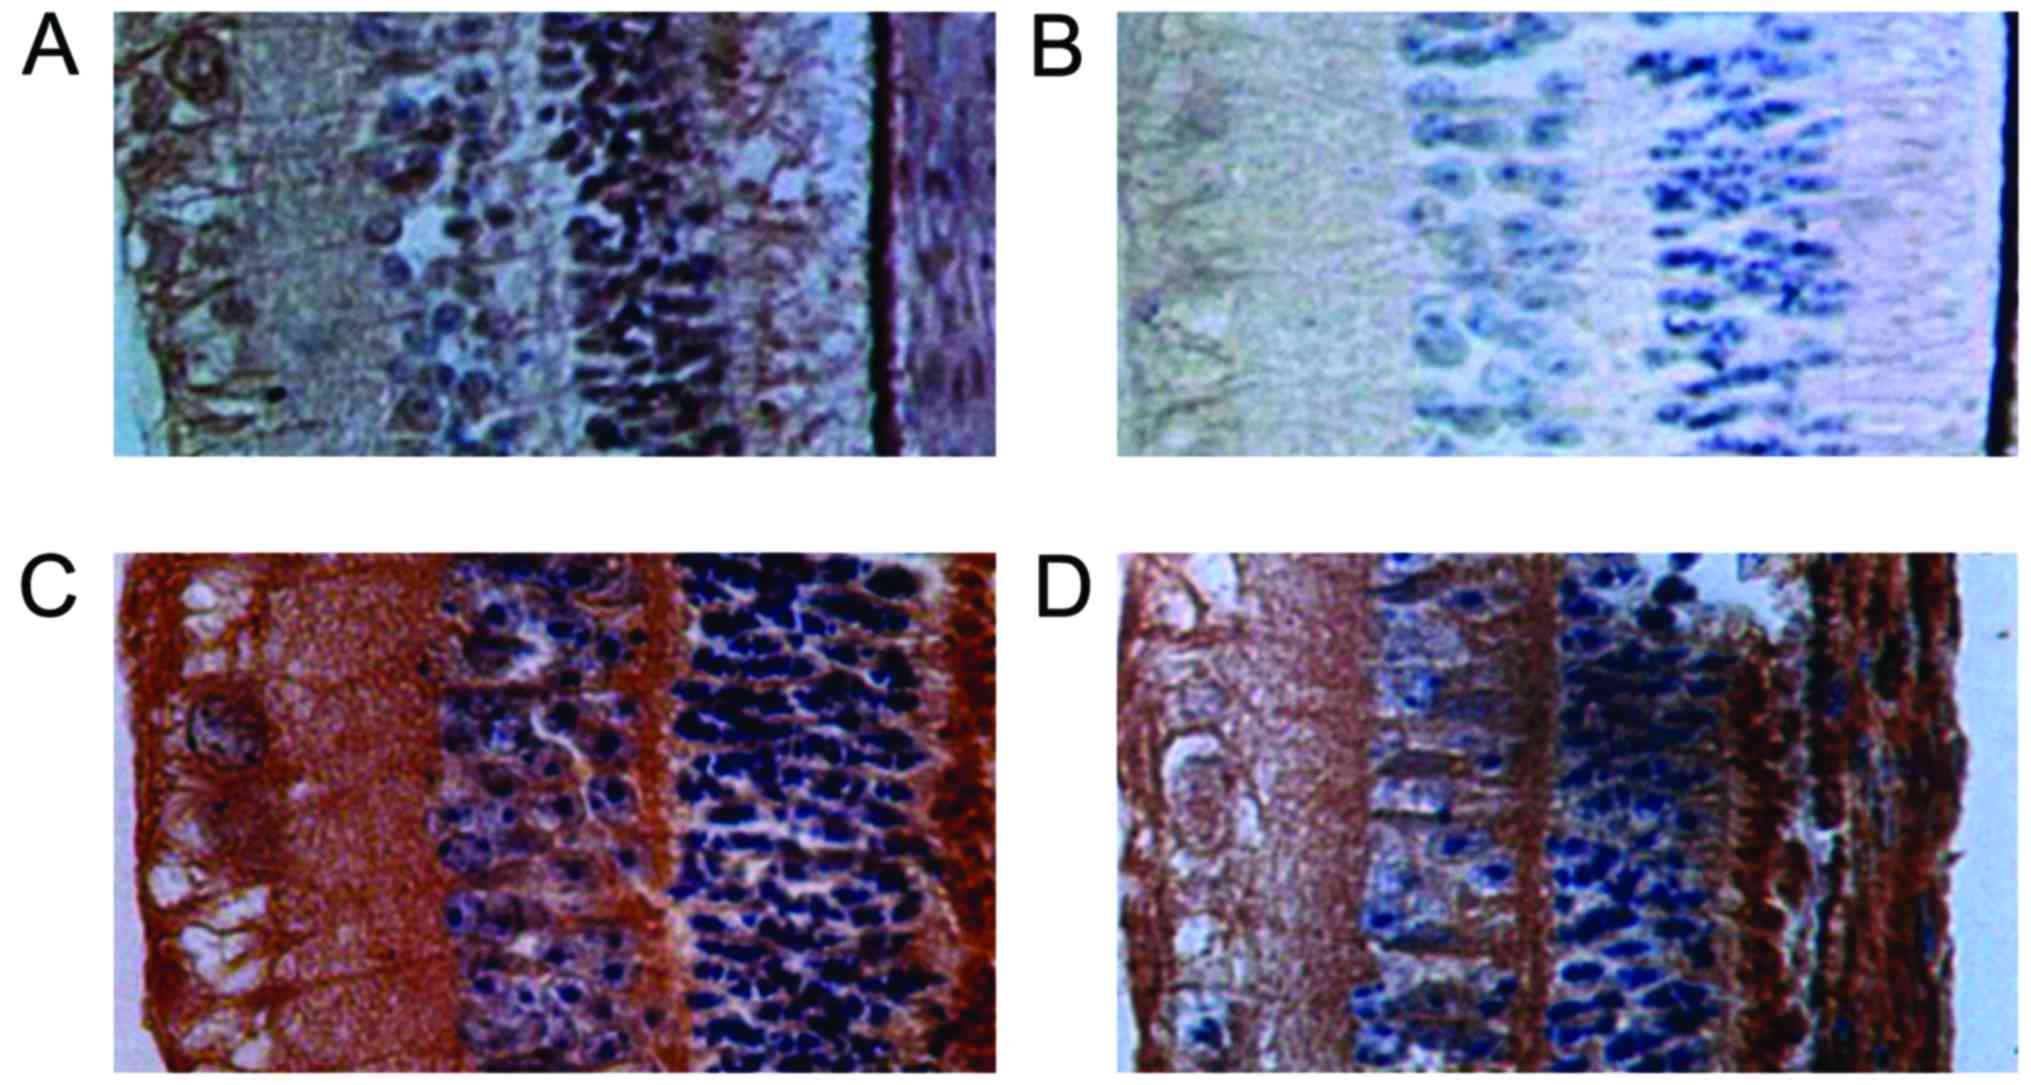
Comparison of iNOS levels
iNOS is mainly located in the retinal ganglion cell
layer, inner nuclear layer, photoreceptor cell layer and choroid
mesenchymal tissue. For each time-point, the iNOS level of group C
was the lowest, followed by groups B and D, while group A was the
highest, and the differences were statistically significant
(P<0.05) (Table III and
Fig. 2).
| Table III.Comparison of iNOS levels. |
Table III.
Comparison of iNOS levels.
|
| Illumination |
|
|
|---|
|
|
|
|
|
|---|
| Groups | 1 week | 3 weeks | 6 weeks | F-value | P-value |
|---|
| A | 0.44±0.09 | 0.45±0.08 | 0.43±0.07 | 0.946 | 0.724 |
| B | 0.36±0.07 | 0.35±0.08 | 0.34±0.06 | 0.638 | 0.552 |
| C | 0.29±0.06 | 0.27±0.07 | 0.28±0.04 | 0.725 | 0.639 |
| D | 0.38±0.06 | 0.37±0.07 | 0.35±0.05 | 0.526 | 0.402 |
| F-value | 7.669 | 7.924 | 7.853 |
|
|
| P-value | <0.001 | <0.001 | <0.001 |
|
|
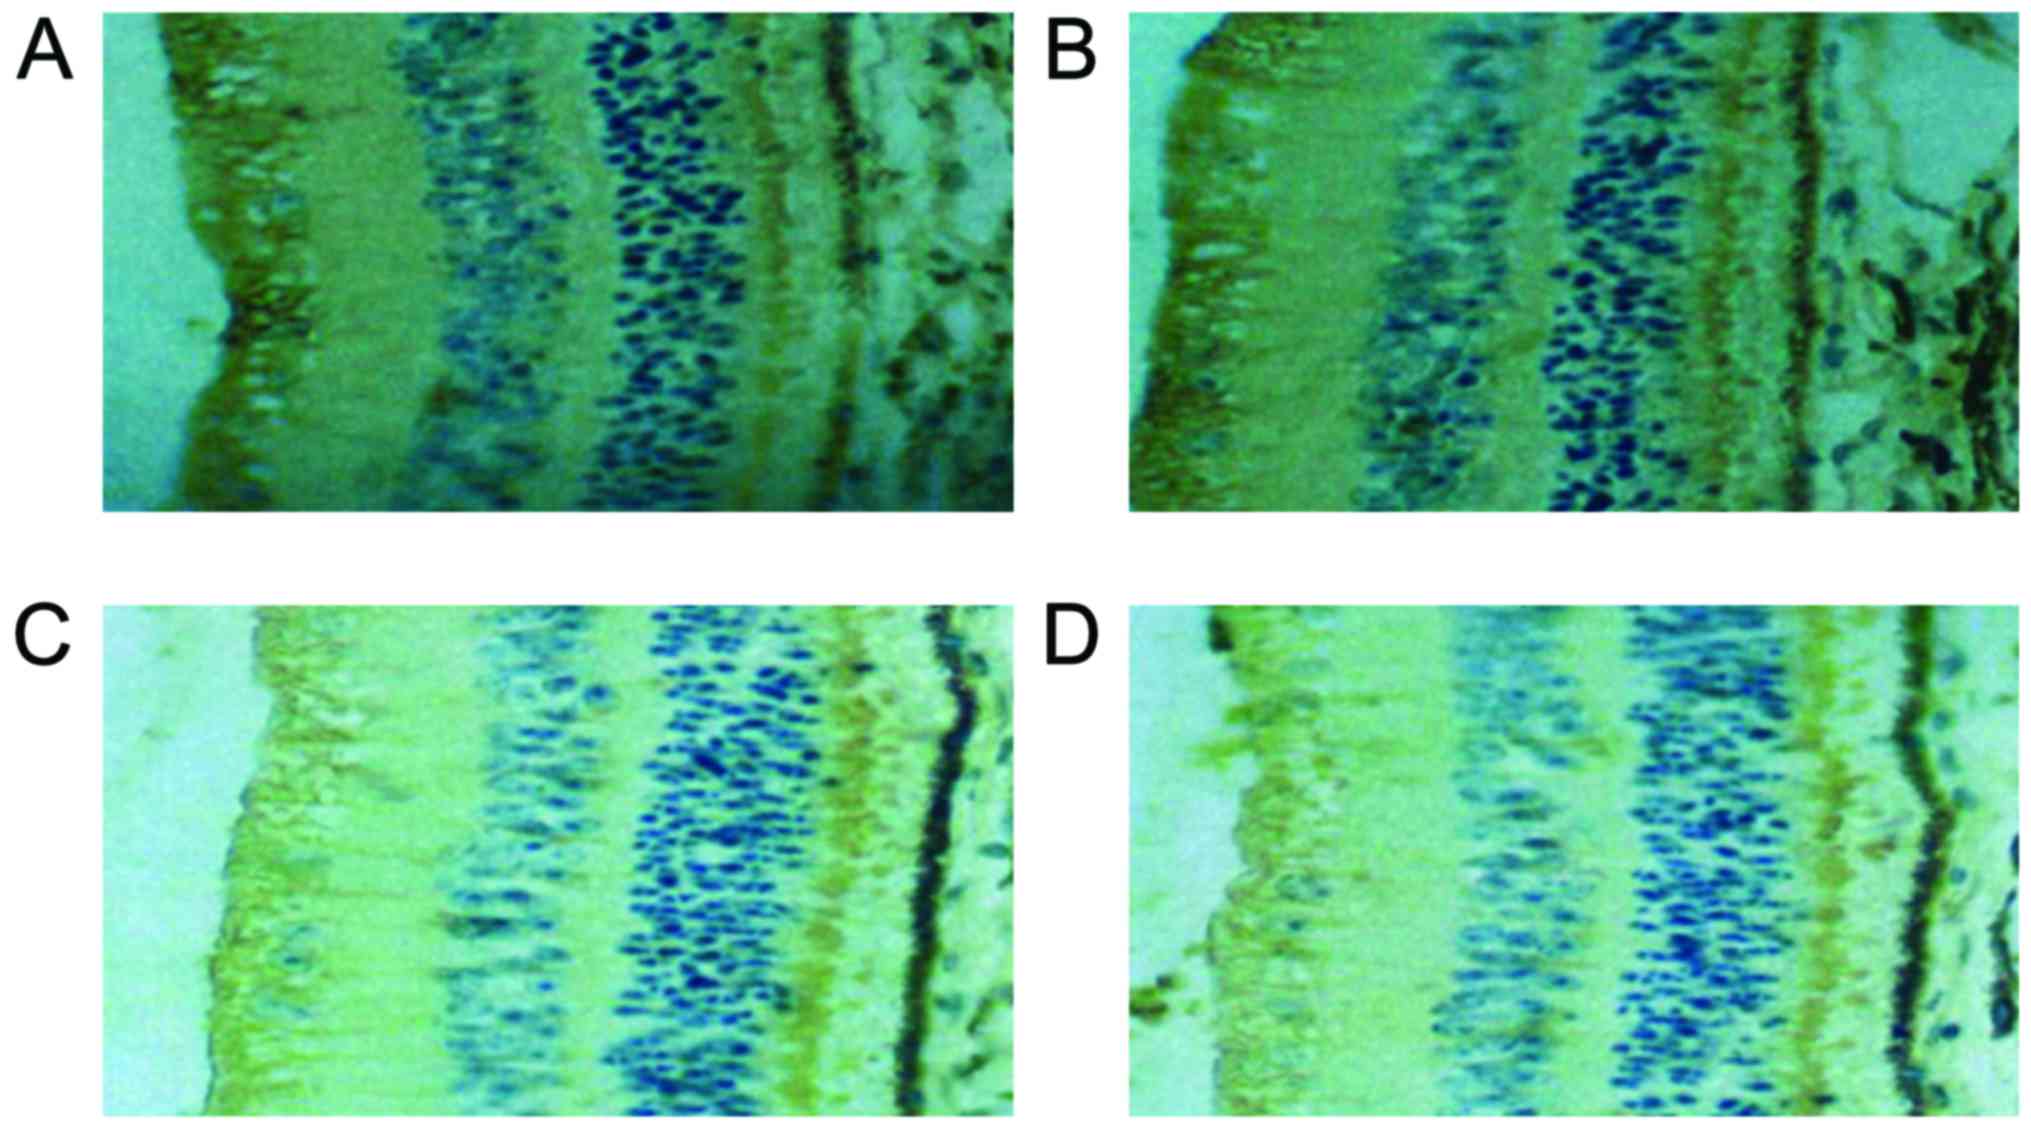
Comparison of c-fos protein level
Expression of c-fos protein in the retina is mainly
in amacrine cells and ganglion cells. For each time-point, the
c-fos protein levels of group C was the highest, followed by groups
B and D, and group A which was the lowest, and the differences were
statistically significant (P<0.05). Except for group A, the MLT
receptor expression levels of the three remaining groups increased
with illumination time, and the differences were statistically
significant (P<0.05) (Table IV
and Fig. 3).
| Table IV.Expression of c-fos protein level. |
Table IV.
Expression of c-fos protein level.
|
| Illumination |
|
|
|---|
|
|
|
|
|
|---|
| Groups | 1 week | 3 weeks | 6 weeks | F-value | P-value |
|---|
| A | 0.08±0.02 | 0.09±0.02 | 0.07±0.02 | 0.534 | 0.303 |
| B | 0.27±0.05 | 0.32±0.06 | 0.35±0.07 | 6.234 | 0.022 |
| C | 0.36±0.05 | 0.39±0.06 | 0.43±0.05 | 6.525 | 0.018 |
| D | 0.28±0.04 | 0.33±0.05 | 0.35±0.06 | 6.317 | 0.020 |
| F-value | 7.968 | 8.302 | 8.421 |
|
|
| P-value | <0.001 | <0.001 | <0.001 |
|
|
Discussion
The retina is the major site of synthesis of MLT
apart from the epiphysis. MLT exerts an influence on the eyes
through paracrine signaling. Its biosynthesis is controlled by
circadian rhythm, as its secretion peaks at night and drops during
the day, a process which is dually regulated by external light and
the body clock (5). The MLT receptor
has seven transmembrane segments, and is a member of the G
protein-coupled receptor superfamily (6). The physiological function of MLT is to
communicate information about circadian rhythms to the body in
response to outside light (7). In
addition, it may play an important role in immunomodulation,
antioxidation, neuroprotection, and tumor inhibition (7). Furthermore, MLT may have a role in
ophthalmological diseases such as diabetic retinopathy, age-related
macular degeneration, glaucoma, cataract and myopia (8).
By setting different illumination times, and
analyzing the regulatory mechanism of MLT in the retinal ganglion
cells of healthy mice, we observed that at each time-point, group C
had the highest MLT levels, followed by group B and D, and then by
group A which had the lowest, and the differences were
statistically significant, whereas in the comparison of
illumination time at 1, 3 and 6 weeks, there was no statistical
difference in the illumination times. This suggests that the
influence of circadian rhythm on MLT was greater than the
illumination time (9). At each
time-point, the MLT receptor expression levels of group C was the
highest, followed by group B, group D and then by group A, and the
differences were statistically significant. Apart from group A, the
MLT receptor expression levels of the three remaining groups
increased with illumination time, and the differences were
statistically significant. This suggests that expression of the MLT
receptor not only relates to circadian rhythm but also illumination
time, such that by extending the illumination time, the expression
levels of the MLT receptor can increase (10). The comparison of iNOS levels among
the different groups suggests there are no statistical differences;
for each time-point, the iNOS levels of group C was the lowest,
followed by group B and D, while highest in group A, and the
differences were statistically significant. The stimulation of
light makes retinal bipolar cells release the neurotransmitter
glutamate. Glutamate interacts with the N-methyl-D-aspartate (NMDA)
receptor on amacrine cells expressing iNOS, thus increasing
internal flow of Ca2+ and iNOS activity, and increasing
NO. NO can in turn, activate the soluble guanylyl cyclase (sGC) in
ganglion and bipolar cells, increase cyclic guanosine monophosphate
(cGMP) concentrations, and produce the cGMP gating cation current.
Therefore, NO possibly regulates the activity of ganglion and
bipolar cells through activation of these pathways to influence the
transmission of visual information (11).
At each time-point, the c-fos protein level of group
C was the highest, followed by groups B and D, and group A which
had the lowest levels. The differences were statistically
significant. With the exception of group A, MLT receptor expression
levels of the remaining three groups increased with illumination
time, and the differences were statistically significant. The c-fos
gene can be induced by second messengers, and is also called the
immediate early gene (12). C-fos is
upregulated in stationary cells following external stimulus. The
c-fos gene and its protein product is not only involved in normal
cellular growth and differentiation, but also participates in the
process of information transmission and energy metabolism within
cells (13). Hossokawa et al
(14) reported that different visual
stimuli induce the outer edge of the chicken hypothalamus and the
inner edge of the geniculate body to upregulate c-fos expression.
Aronin et al (15) showed
that light changes the retinal nucleoprotein reaction level, which
suggests that the expression of c-fos may be part of the
‘light/dark environment’ biological clock mechanism. When Zambia
underground mice were treated with light stimulation, c-fos
expression was found in the retina and brain (16). Light stimulation of transplanted
retina can also induce c-fos expression of the mouse superior
colliculus (17).
In conclusion, appropriate illumination can increase
c-fos, decrease iNOS activity and regulate the physiological
activities of retinal ganglion cells by regulating the expressions
of MLT and its receptor. The results of the present study provide a
basis for further analysis of the function of MLT on the retina
under pathological conditions.
References
|
1
|
Juszczak M, Wolak M, Bojanowska E, Piera L
and Roszczyk M: The role of melatonin membrane receptors in
melatonin-dependent oxytocin secretion from the rat
hypothalamo-neurohypophysial system - an in vitro and in vivo
approach. Endokrynol Pol. 67:507–514. 2016. View Article : Google Scholar : PubMed/NCBI
|
|
2
|
Aranda ML, González Fleitas MF, De
Laurentiis A, Sarmiento MI Keller, Chianelli M, Sande PH, Dorfman D
and Rosenstein RE: Neuroprotective effect of melatonin in
experimental optic neuritis in rats. J Pineal Res. 60:360–372.
2016. View Article : Google Scholar : PubMed/NCBI
|
|
3
|
Zetner D, Andersen LP and Rosenberg J:
Melatonin as protection against radiation injury: a systematic
review. Drug Res (Stuttg). 66:281–296. 2016. View Article : Google Scholar : PubMed/NCBI
|
|
4
|
Gramajo AL, Marquez GE, Torres VE, Juárez
CP, Rosenstein RE and Luna JD: Medscape: Therapeutic benefit of
melatonin in refractory central serous chorioretinopathy. Eye
(Lond). 29:1036–1045. 2015. View Article : Google Scholar : PubMed/NCBI
|
|
5
|
Paulose JK, Wright JM, Patel AG and
Cassone VM: Human gut bacteria are sensitive to melatonin and
express endogenous circadian rhythmicity. PLoS One.
11:e01466432016. View Article : Google Scholar : PubMed/NCBI
|
|
6
|
Zhao L, Liu H, Yue L, Zhang J, Li X, Wang
B, Lin Y and Qu Y: Melatonin attenuates early brain injury via the
melatonin receptor/Sirt1/NF-κB signaling pathway following
subarachnoid hemorrhage in mice. Mol Neurobiol. 54:1612–1621. 2017.
View Article : Google Scholar : PubMed/NCBI
|
|
7
|
Shimada M, Seki H, Samejima M, Hayase M
and Shirai F: Salivary melatonin levels and sleep-wake rhythms in
pregnant women with hypertensive and glucose metabolic disorders: a
prospective analysis. Biosci Trends. 10:34–41. 2016. View Article : Google Scholar : PubMed/NCBI
|
|
8
|
Agorastos A and Huber CG: The role of
melatonin in glaucoma: implications concerning pathophysiological
relevance and therapeutic potential. J Pineal Res. 50:1–7. 2011.
View Article : Google Scholar : PubMed/NCBI
|
|
9
|
Tan DX, Manchester LC and Reiter RJ: CSF
generation by pineal gland results in a robust melatonin circadian
rhythm in the third ventricle as an unique light/dark signal. Med
Hypotheses. 86:3–9. 2016. View Article : Google Scholar : PubMed/NCBI
|
|
10
|
Comai S, Ochoa-Sanchez R, Dominguez-Lopez
S, Bambico FR and Gobbi G: Melancholic-like behaviors and circadian
neurobiological abnormalities in melatonin MT1 receptor knockout
mice. Int J Neuropsychopharmacol. 18:123–125. 2015. View Article : Google Scholar
|
|
11
|
Oversø Hansen P, Kringelholt S, Simonsen U
and Bek T: Hypoxia-induced relaxation of porcine retinal arterioles
in vitro depends on inducible NO synthase and EP4 receptor
stimulation in the perivascular retina. Acta Ophthalmol.
93:457–463. 2015. View Article : Google Scholar : PubMed/NCBI
|
|
12
|
Tanuri FC, de Lima E, Peres MF, Cabral FR,
da Graça Naffah-Mazzacoratti M, Cavalheiro EA, Cipolla-Neto J,
Zukerman E and Amado D: Melatonin treatment decreases c-fos
expression in a headache model induced by capsaicin. J Headache
Pain. 10:105–110. 2009. View Article : Google Scholar : PubMed/NCBI
|
|
13
|
Oshitari T, Yamamoto S and Roy S:
Increased expression of c-Fos, c-Jun and c-Jun N-terminal kinase
associated with neuronal cell death in retinas of diabetic
patients. Curr Eye Res. 39:527–531. 2014. View Article : Google Scholar : PubMed/NCBI
|
|
14
|
Hossokawa NM, Araki CM, Hamassaki-Britto
DE, Wallman J and Britto LR: Expression of the Fos protein reveals
functional subdivisions of the avian ventral lateral geniculate
nucleus. Neurosci Lett. 218:53–56. 1996. View Article : Google Scholar : PubMed/NCBI
|
|
15
|
Aronin N, Sagar SM, Sharp FR and Schwartz
WJ: Light regulates expression of a Fos-related protein in rat
suprachiasmatic nuclei. Proc Natl Acad Sci USA. 87:pp. 5959–5962.
1990; View Article : Google Scholar : PubMed/NCBI
|
|
16
|
Oelschläger HHA, Nakamura M, Herzog M and
Burda H: Visual system labeled by c-Fos immunohistochemistry after
light exposure in the ‘blind’ subterranean Zambian mole-rat
(Cryptomys anselli). Brain Behav Evol. 55:209–220. 2000. View Article : Google Scholar : PubMed/NCBI
|
|
17
|
Matejů K, Sumová A and Bendová Z:
Expression and light sensitivity of clock genes Per1 and Per2 and
immediate-early gene c-fos within the retina of early postnatal
Wistar rats. J Comp Neurol. 518:3630–3644. 2010. View Article : Google Scholar : PubMed/NCBI
|