Introduction
Cellulosic ethanol generated from lignocellulosic
biomass such as agricultural residues has been recognized as one of
the most sustainable biofuels for transportation (1,2). Chinese
medicine residues, which have been treated at high temperature,
contain cellulose, hemicellulose, lignin, fat, protein, and
polysaccharide (3,4). It is a very promising biomass material
for its soft texture and large production.
Cellulose and hemicelluloses are the substrates for
ethanol production (5–8). In fact, cellulose and hemicelluloses
are first hydrolyzed to yield arabinose, galactose, glucose,
xylose, and cellobiose. Then, glucose and xylose are fermented to
produce ethanol. The traditional strain used to produce ethanol is
Saccharomyces cerevisiae (S. cerevisiae). Due to
S. cerevisiae not having a specialized xylose transport
system, it utilizes xylose only after glucose is depleted in the
fermentation broth and then xylose is transferred by the hexose
transport system (9,10). For the sake of simultaneously
converting glucose and xylose to ethanol, we used a fusant,
obtained by protoplast fusion, combining Pichia stipitis
with S. cerevisiae. Thus, in the process of simultaneous
saccharification and co-fermentation (SSCF), a variety of sugars
and monosaccharides can be produced. With the purpose of valuation
of cellulose and hemicellulose utilization, it is necessary to
develop an accurate analysis method for the simultaneous
determination of these compounds.
Several detectors coupled with chromatographic
systems have been used to quantify sugars. Common detection methods
include mass spectrometry (MS) (11,12),
refractive index detection (RID) (13,14),
evaporative light scattering detection (ELSD) (15–17),
charged aerosol detection (CAD) (18,19), and
integrated pulsed amperometric detector (IPAD) (20). Ligand-exchange and cation-exchange
chromatography with RID (21), and
high-performance anion-exchange chromatography with IPAD
(HPAEC-IPAD) (20,22) have been successfully applied to
monitor carbohydrates.
HPAEC-IPAD enables the rapid monitoring of monomeric
and dimeric sugars in the aqueous extracts and hydrolysates of
biomass. The pKa of carbohydrates ranges from 12 to 14 (23). Carbohydrates exist in the forms of
negative ion in strong alkaline neurogen. Therefore, they can be
separated by the IEC (24). Since
carbohydrate is separated in strong alkaline neurogen, its
detection methods should be applicable to the alkaline conditions.
IPAD is technologically suitable. More importantly, derivatization
reaction and sample purification are not needed. Moreover, IPAD can
precisely detect the quantity of carbohydrate from pmol to fmol.
Pulsed amperometric detection is suitable for trace component
analysis and it is a universal and non-specific method with high
sensitivity (24–26). The method can provide a stable
baseline even with steep gradients. Pulse amperometric detection
with the larger response signal is suitable for the quantification
of sugars.
In our study, the strain was a fusant. SSCF was
used. Chinese medicine residue was used as the liquid fermentation
substrate. Products and intermediate products are more complex
because the technological line is long, the strain is unique and
the substrate composition is complicated. We tried to use ELSD, RID
to determine monosaccharides and disaccharides but the results were
not ideal. Finally, a simple, rapid, and reliable IEC method
combined with IPAD was developed for the simultaneous determination
of arabinose, galactose, glucose, xylose, and cellobiose. The
method facilitated the rapid analysis of sugars and degradation
products in biomass degradation products.
Materials and methods
Materials and reagents
Sodium hydroxide stock solution (50%) was purchased
from Merck & Co., Inc. (Whitehouse Station, NJ, USA) (B0921993
334 UM824). Ultrapure water prepared with Milli-Q was used in the
experiment. Astragalus residues were collected from Chinese
medicine factory. Xylanase and cellulase were purchased from
Xiangbo Biological Technology Co., Ltd. (Guangzhou, China).
HPLC-grade arabinose, galactose, glucose, xylose, and cellobiose
(purity >99%) were purchased from Sigma-Aldrich (Shanghai,
China). The test strain was a fusant prepared by protoplast fusion,
combining S. cerevisiae with Pichia stipitis.
Preparation of standard solution
Stock solutions of arabinose (2.5 mg/l), galactose
(2.5 mg/l), glucose (7.5 mg/l), xylose (2.5 mg/l), and cellobiose
(2.0 mg/l) were prepared in ultrapure water. The working standard
solutions were prepared as required by appropriate dilution of
stock solutions with ultrapure water. Standard solutions sugar
(arabinose, galactose, and xylose) were prepared daily according to
various concentrations (0.1, 0.25, 0.5, 1.0 and 1.5 mg/l), and
standard glucose solutions of different concentrations (0.3, 0.75,
1.5, 3.0 and 4.5 mg/l) were prepared. The concentrations of
standard cellobiose solutions were, respectively, 0.08, 0.75, 1.5,
3 and 4.5 mg/l.
Sample preparation
Astragalus residue was first pretreated with
1% sulphuric acid for 2 h at 120°C. Then 0.3% yeast extracts, 0.25
g/l (NH4)2HPO4, and 0.025 g/l
MgSO4·7H2O was added into the fermentation
medium and pH was adjusted to 4.8 with sodium hydroxide solution.
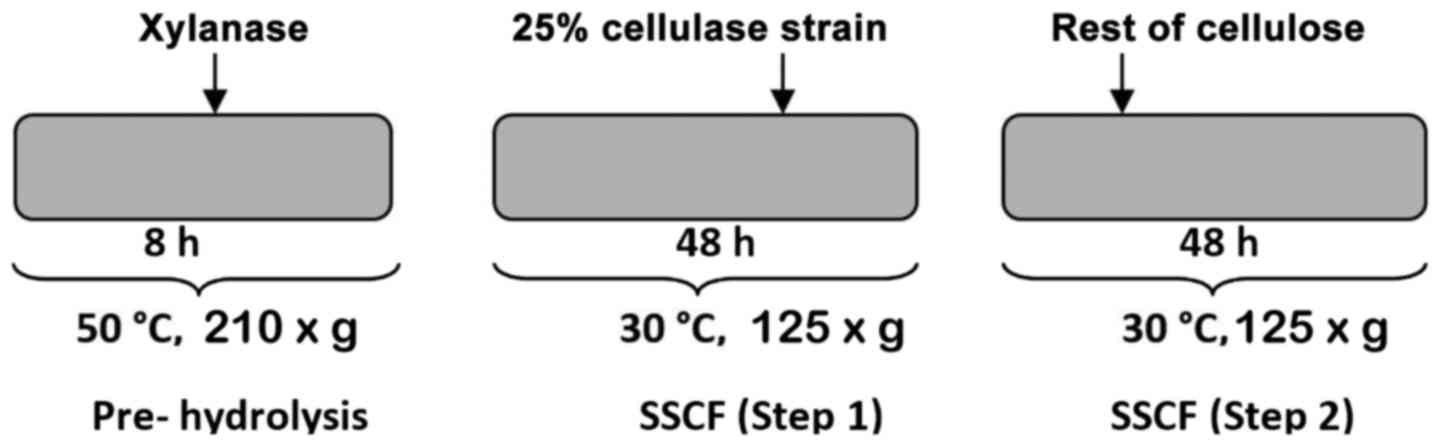
Two-step SSCF technology was employed (27,28).
Xylanase was added to perform 8 h prehydrolysis. Strain and a small
percentage of cellulose were then added into the hydrolyzate to
carry out SSCF (step one) for 48 h. After 48 h, the remaining
cellulose was fed to release glucose from glucan and subsequently
fermented to generate ethanol with the fusant (Fig. 1).
The fermentation liquor was centrifuged at 10,000 ×
g for 10 min. Then the supernatant was diluted 5,000-fold and
filtered through 0.45 µm Millipore filter. The filtrate was
collected as the sample solution.
HPAEC-IPAD instrumentation and
chromatographic conditions
HPLC analysis was performed on a Dionex ICS-2500
equipped with GP50 gradient pump and ED50 IPAD. Working and
reference electrodes were, respectively, gold and silver
electrodes. Separation was achieved on serial no. 002627 Dionex
Analytical column (2×250 mm) (Dionex, Sunnyvale, CA, USA). The
mobile phase consisted of 250 mM sodium hydroxide and water. The
elution program is shown in Table I.
Each elution run was completed within 35 min. The rate of the flow
was 0.2 ml/min and an aliquot of 25 µl of sample solution was
injected into the HPAEC-IPAD system. The column temperature was set
to 30°C for separation and determination.
 | Table I.HPLC gradient elution program. |
Table I.
HPLC gradient elution program.
| Time (min) | 250 mM NaOH (%) |
|---|
| 0–15 |
4 |
| 15–20 | 4–30 |
| 20–35 | 30 |
Calibration curves and limits of
detection and quantification
First, 25 µl of each solution was injected in
duplicates to construct calibration curves. The limits of detection
(LOD) and quantification (LOQ) were determined at signal-to-noise
ratios (S/N) of 3 and 10, respectively. The LOD and LOQ values were
experimentally verified by injecting standard solutions of the
compounds at the LOD and LOQ concentrations.
Accuracy
The recovery test was used to evaluate the detection
accuracy. In the recovery experiments, the selected samples were
also spiked with known amounts of arabinose, galactose, glucose,
xylose, and cellobiose (0.1 mg/l), and then analyzed according to
the chromatographic conditions described above. The average
recoveries were calculated as: Recovery (%) = (the observed amount
- original amount)/the spiked amount × 100%.
Precision
In 3 consecutive days, the intra- and inter-day
precisions were determined through five injections of the sample
solution. Additionally, the reproducibility and repeatability of
the advanced method were determined by measuring the retention time
and peak areas.
Results and Discussion
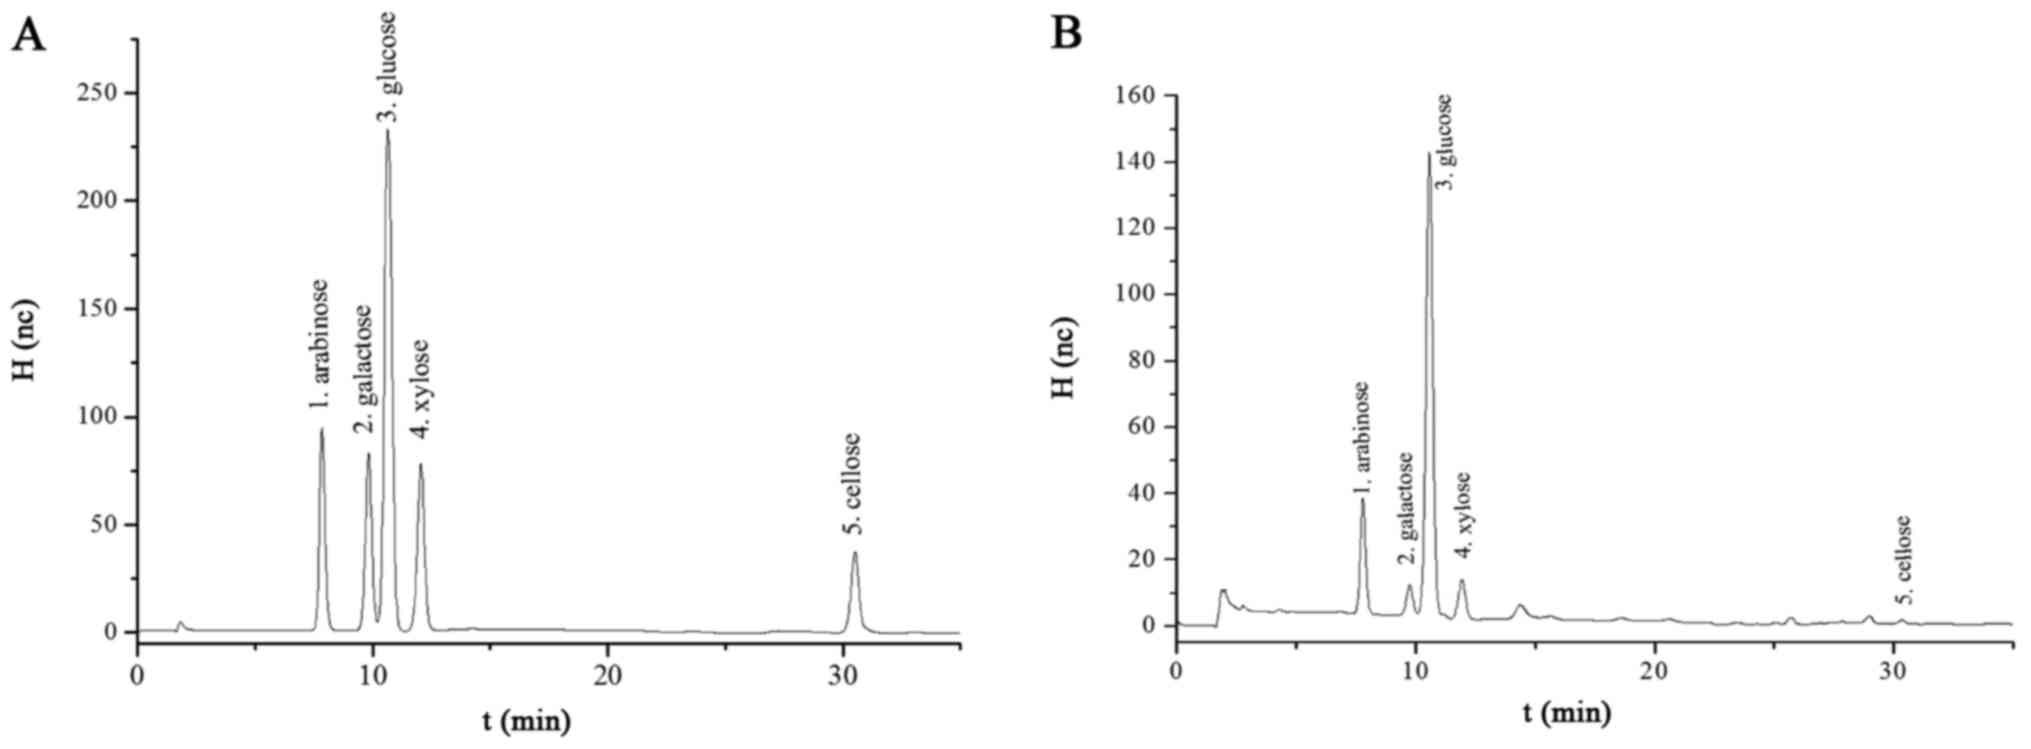
The chromatogram by HPAEC-IPAD for the standard
compounds and sample is shown in Fig.
2, and Table II. The results
demonstrated that the five compounds were well separated by the
serial no. 002627 Dionex analytical column. From this point of
view, the quantitative determinations of arabinose, galactose,
glucose, xylose, and cellobiose in the fermentation liquor of
Astragalus residue were feasible.
| Table II.Regression equation and LOD and LOQ
for arabinose, galactose, glucose, xylose, and cellobiose. |
Table II.
Regression equation and LOD and LOQ
for arabinose, galactose, glucose, xylose, and cellobiose.
| Compounds | Retention time
(min) | Regression
equation | Linearity range
(mg/l) | R2 | LOD (mg/l),
S/N=3 | LOD (mg/l),
S/N=10 |
|---|
| Arabinose | 7.269 | Y=10.998X-0.0866 | 0.10–1.50 | 0.9959 | 0.067 | 0.10 |
| Galactose | 9.085 | Y=10.701X-0.0297 | 0.10–1.50 | 0.9984 | 0.082 | 0.10 |
| Glucose | 9.852 | Y=12.929X-0.2877 | 0.30–4.50 | 0.9979 | 0.074 | 0.23 |
| Xylose | 11.009 | Y=10.669X-0.0978 | 0.10–1.50 | 0.9977 | 0.091 | 0.10 |
| Cellobiose | 29.469 | Y=7.3485X-0.0588 | 0.08–1.20 | 0.9971 | 0.080 | 0.08 |
Table III gives the
recovery and precision data for five compounds. Recovery
experiments were performed to determine the detection accuracy of
the method. The samples were analyzed before and after the addition
of known amounts of arabinose, galactose, glucose, xylose, and
cellobiose. The recoveries ranged from 97.83 to 102.05%. The intra-
and inter-day %RSD of retention time and peak areas have low values
(<3.843%). Therefore, the developed IEC-PAD showed a high
precision, accuracy, and sensitivity for the simultaneous
quantitative evaluation of arabinose, galactose, glucose, xylose,
and cellobiose in fermentation liquor of Astragalus
residues.
| Table III.Precision data of retention time and
peak areas. |
Table III.
Precision data of retention time and
peak areas.
|
| Intra-day precision
(n=3, mean), %RSD |
|
|---|
|
|
|
|
|---|
|
| Day 1 | Day 2 | Day 3 | Intra-day precision
(n=9, mean), %RSD |
|
|---|
|
|
|
|
|
|
|
|---|
| Compounds |
tRa |
PAb |
HCc | tR | PA | HC | tR | PA | HC | tR | PA | HC | Recovery (%) |
|---|
| Arabinose | 0.780 | 0.967 | 2.386 | 1.697 | 2.135 | 3.242 | 0.865 | 0.122 | 1.975 | 1.895 | 1.427 | 3.090 | 97.83 |
| Galactose | 0.886 | 0.555 | 1.492 | 1.505 | 2.961 | 2.712 | 0.809 | 0.633 | 2.258 | 2.043 | 2.351 | 2.713 | 99.06 |
| Glucose | 0.801 | 0.301 | 0.270 | 1.424 | 0.373 | 0.982 | 0.877 | 0.699 | 1.082 | 1.906 | 0.643 | 1.766 | 98.47 |
| Xylose | 0.785 | 1.105 | 1.229 | 1.718 | 0.691 | 0.671 | 0.840 | 1.609 | 0.483 | 1.359 | 1.265 | 1.401 | 99.49 |
| Cellobiose | 0.362 | 0.806 | 1.215 | 0.383 | 2.600 | 2.313 | 0.165 | 2.630 | 3.233 | 0.895 | 2.639 | 3.843 | 102.05 |
The HPAEC-IPAD method was applied to analyze
arabinose, galactose, glucose, xylose, and cellobiose (Table IV). Glucose concentration (17.57
g/l) in fermentation liquor was the highest, indicating that
glucose utilization rate was not high. It was then necessary to
study the way to improve the utilization of glucose. The following
step was based on the process optimization to improve the
utilization of glucose and increase the ethanol yield.
| Table IV.Results of HPAEC-IPAD. |
Table IV.
Results of HPAEC-IPAD.
| Compounds | Arabinose | Galactose | Glucose | Xylose | Cellobiose |
|---|
| Concentrations
(g/l) | 4.19 | 1.33 | 17.57 | 0.81 | 0.035 |
The ion chromatography (IC) pulse ampere detection
method has a high detection sensitivity to sugar and reaches the
level in µg/l. The method is suitable for the detection of
compounds with a low concentration. If the sample concentration was
higher, REDOX reaction may not have been fully completed; thus
leading to a lower measurement value than the actual value. As a
result, it is necessary to dilute the sample to the suitable
concentration. In our experiments, the supernatant was diluted
5,000-fold and the concentration was in the range of the standard
curve.
When the mobile phase was 250 mm NaOH: Water =
4:96%, monosaccharide components can be completely removed.
However, cellobiose was retained in the chromatographic column. To
strengthen the elution effect, the gradient elution program was
used. After increasing the proportion of NaOH to 20%, cellobiose
which has strong adsorption ability can be eluted. The final eluent
condition was provided as follows: 0–15 min, 250 mm NaOH with 4%;
15–20 min, from 4% to 30%; 20–35 min, maintaining 30%.
The content determination method was suitable for
Astragalus residues fermentation medium, as well as for
other fermentation liquids of Chinese medicinal drugs. We have
applied the method to other media, such as Kudzu,
Patchouli and it showed good adaptability. The developed
experimental means is very useful for evaluating resource
utilization of traditional Chinese medicine.
In conclusion, the analysis was carried out on a
Dionex Analytical column (2×250 mm). Water and 250 mM sodium
hydroxide were used as the mobile phase. The rate of the flow was
0.2 ml/min. The column temperature was kept at 30°C. The accuracy
and precision of the detection method were validated. The obtained
regression equation revealed a good linear relationship
(R2=0.9959–0.9984) within the test ranges. The LOD and
LOQ for five analytes (arabinose, galactose, glucose, xylose, and
cellobiose) were in the range of 0.067–0.091 and 0.08–0.23 mg/l,
respectively. The detection method showed good reproducibility for
the quantification of five analytes in fermentation liquor of
Astragalus residues and the intra- and inter-day variations
were <3.843%.
Acknowledgements
The present study was supported by the National
Nature Science Foundation of China (81403193), the Youth Elite
Project of GUCM (QNYC20140112), and the Natural Science Foundation
of Guangdong Province in China (2014A030313587). The authors
gratefully acknowledge Ms. Hu Yang for experiment assistance.
References
|
1
|
Balan V, Bals B, Chundawat SPS, Marshall D
and Dale BE: Lignocellulosic biomass pretreatment using AFEX.
Methods Mol Biol. 581:61–77. 2009. View Article : Google Scholar : PubMed/NCBI
|
|
2
|
Brethauer S and Wyman CE: Review:
continuous hydrolysis and fermentation for cellulosic ethanol
production. Bioresour Technol. 101:4862–4874. 2010. View Article : Google Scholar : PubMed/NCBI
|
|
3
|
Meng X, Yu H, Wang P and Rong X: Study on
pyrolysis and resource utilization of herb residue for Chinese
medicine industry in the perspective of low-carbon economy.
Environment Pollution Control. 32:32–35. 2010.(In Chinese).
|
|
4
|
Wang H, Xu G, Gao W, Li D, Yu L and Sun
YJ: Effects of herbal residues organic substrates on growth, yield,
and quality of capsicum. Jiangsu J Agricultural Sci. 25:1301–1304.
2009.(In Chinese).
|
|
5
|
Shafiei M, Karimi K and Taherzadeh MJ:
Pretreatment of spruce and oak by N-methylmorpholine-N-oxide (NMMO)
for efficient conversion of their cellulose to ethanol. Bioresour
Technol. 101:4914–4918. 2010. View Article : Google Scholar : PubMed/NCBI
|
|
6
|
Jeihanipour A, Karimi K, Niklasson C and
Taherzadeh MJ: A novel process for ethanol or biogas production
from cellulose in blended-fibers waste textiles. Waste Manag.
30:2504–2509. 2010. View Article : Google Scholar : PubMed/NCBI
|
|
7
|
Park I, Kim I, Kang K, Sohn H, Rhee I, Jin
I and Jang H: Cellulose ethanol production from waste newsprint by
simultaneous saccharification and fermentation using Saccharomyces
cerevisiae KNU5377. Process Biochem. 45:487–492. 2010. View Article : Google Scholar
|
|
8
|
Jin M, Gunawan C, Balan V, Lau MW and Dale
BE: Simultaneous saccharification and co-fermentation (SSCF) of
AFEX(TM) pretreated corn stover for ethanol production using
commercial enzymes and Saccharomyces cerevisiae 424A(LNH-ST).
Bioresour Technol. 110:587–594. 2012. View Article : Google Scholar : PubMed/NCBI
|
|
9
|
Bertilsson M, Andersson J and Lidén G:
Modeling simultaneous glucose and xylose uptake in Saccharomyces
cerevisiae from kinetics and gene expression of sugar transporters.
Bioprocess Biosyst Eng. 31:369–377. 2008. View Article : Google Scholar : PubMed/NCBI
|
|
10
|
Diderich JA, Schepper M, van Hoek P,
Luttik MAH, van Dijken JP, Pronk JT, Klaassen P, Boelens HFM, de
Mattos MJ, van Dam K, et al: Glucose uptake kinetics and
transcription of HXT genes in chemostat cultures of Saccharomyces
cerevisiae. J Biol Chem. 274:15350–15359. 1999. View Article : Google Scholar : PubMed/NCBI
|
|
11
|
Puzo G and Promé JC: Mass spectrometry of
acylated sugars as trimethylsilyl ether derivatives. A way for
location of long chain fatty acyl groups. Biomed Mass Spectrom.
5:146–152. 1978. View Article : Google Scholar : PubMed/NCBI
|
|
12
|
Taylor VF, March RE, Longerich HP and
Stadey CJ: A mass spectrometric study of glucose, sucrose, and
fructose using an inductively coupled plasma and electrospray
ionization. Int J Mass Spectrom. 243:71–84. 2005. View Article : Google Scholar
|
|
13
|
Calull M, Marcé RM and Borrull F:
Determination of carboxylic acids, sugars, glycerol and ethanol in
wine and grape must by ion-exchange high-performance liquid
chromatography with refractive index detection. J Chromatogr A.
590:215–222. 1992. View Article : Google Scholar
|
|
14
|
Clement A, Yong D and Brechet C:
Simultaneous identification of sugars by HPLC using evaporative
light scattering detection (ELSD) and refractive index detection
(RI). Application to plant tissues. J Liq Chromatogr Relat Technol.
15:805–817. 1992. View Article : Google Scholar
|
|
15
|
Moh M, Tang T and Tan G: Improved
separation of sucrose ester isomers using gradient high performance
liquid chromatography with evaporative light scattering detection.
Food Chem. 69:105–110. 2000. View Article : Google Scholar
|
|
16
|
Wang J, Zhou Y and Wang Q: Analysis of
mycotoxin fumonisins in corn products by high-performance liquid
chromatography coupled with evaporative light scattering detection.
Food Chem. 107:970–976. 2008. View Article : Google Scholar
|
|
17
|
Yoo DS, Choi YH, Cha MR, Lee BH, Kim SJ,
Yon GH, Hong KS, Jang YS, Lee HS, Kim YS, et al: HPLC-ELSD analysis
of 18 platycosides from balloon flower roots (Platycodi Radix)
sourced from various regions in Korea and geographical clustering
of the cultivation areas. Food Chem. 129:645–651. 2011. View Article : Google Scholar
|
|
18
|
Moreau RA: Lipid analysis via HPLC with a
charged aerosol detector. Lipid Technol. 21:191–194. 2009.
View Article : Google Scholar
|
|
19
|
Beilmann B, Langguth P, Häusler H and
Grass P: High-performance liquid chromatography of lactose with
evaporative light scattering detection, applied to determine fine
particle dose of carrier in dry powder inhalation products. J
Chromatogr A. 1107:204–207. 2006. View Article : Google Scholar : PubMed/NCBI
|
|
20
|
Yu H and Mou S: Methods of amperometric
detection and its applications in ion chromatography. Chemistry.
7:483–488. 2007.
|
|
21
|
Stefansson M and Westerlund D:
Ligand-exchange chromatography of carbohydrates and
glycoconjugates. J Chromatogr A. 720:127–136. 1996. View Article : Google Scholar
|
|
22
|
Sevcik RS, Mowery RA, Becker C and
Chambliss CK: Rapid analysis of carbohydrates in aqueous extracts
and hydrolysates of biomass using a carbonate-modified
anion-exchange column. J Chromatogr A. 1218:1236–1243. 2011.
View Article : Google Scholar : PubMed/NCBI
|
|
23
|
Cai Y, Liu J, Shi Y, Liang L and Mou S:
Determination of several sugars in serum by high-performance
anion-exchange chromatography with pulsed amperometric detection. J
Chromatogr A. 1085:98–103. 2005. View Article : Google Scholar : PubMed/NCBI
|
|
24
|
Jandik P, Cheng J and Avdalovic N:
Analysis of amino acid-carbohydrate mixtures by anion exchange
chromatography and integrated pulsed amperometric detection. J
Biochem Biophys Methods. 60:191–203. 2004. View Article : Google Scholar : PubMed/NCBI
|
|
25
|
Thiele C, Gänzle MG and Vogel RF: Sample
preparation for amino acid determination by integrated pulsed
amperometric detection in foods. Anal Biochem. 310:171–178. 2002.
View Article : Google Scholar : PubMed/NCBI
|
|
26
|
Ding Y, Yu H and Mou S: Direct
determination of free amino acids and sugars in green tea by
anion-exchange chromatography with integrated pulsed amperometric
detection. J Chromatogr A. 982:237–244. 2002. View Article : Google Scholar : PubMed/NCBI
|
|
27
|
Rocklin RD and Pohl CA: Determination of
carbohydrate by anion exchange chromatography with plus
amperometric detection. J Liq Chromatogr. 6:1577–1590. 1983.
View Article : Google Scholar
|
|
28
|
Jin M, Lau MW, Balan V and Dale BE:
Two-step SSCF to convert AFEX-treated switchgrass to ethanol using
commercial enzymes and Saccharomyces cerevisiae 424A(LNH-ST).
Bioresour Technol. 101:8171–8178. 2010. View Article : Google Scholar : PubMed/NCBI
|