Introduction
In patients with glaucoma, the diagnosis and
decision making regarding treatment modalities require precise
assessment of the intraocular pressure (IOP) (1,2). At
present, Goldmann applanation tonometry (GAT) is a widely accepted
international gold standard for the measurement of the IOP
(3,4). However, in eyes with abnormal central
corneal thickness (CCT) and structural corneal rigidity, the
accuracy of this method has been questioned (5). Dynamic contour tonometry (DCT) may be
an ideal alternative means of measuring the IOP, as the tonometer
has a wide safety range of appositional force that reduces operator
bias and is not affected by the tear film or a force to deform the
cornea (6,7). The physical principle of DCT is the
following: The pressure measured at the surface of the eye equals
the pressure inside the eye when the contours of the corneal
surface and the tonometer match (8,9).
In addition to IOP measurement, this tonometer is
also capable of measuring the ocular pulse amplitude (OPA), which
is defined as the difference between the minimum (or diastolic) and
maximum (or systolic) values of the pulsatile IOP. The importance
of the OPA in a clinical glaucoma setting remains to be
established, and studies on the OPA in different types of glaucoma
and controls are required.
The present study compared the OPA and IOP in
patients with chronic angle closure glaucoma (CACG), primary open
angle glaucoma (POAG), normal tension glaucoma (NTG) and suspected
open angle glaucoma (SOAG) as well as normal controls (NC) using
DCT. The OPA among these patients groups was compared and its
correlation with IOP and other factors associated with glaucoma was
assessed.
Patients and methods
Subjects
A total of 127 consecutive patients (63 males and 64
females) with different types of glaucoma were included in the
study with the age ranging from 12 to 89 years (mean age,
54.56±17.84 years). The mean age of the 90 healthy volunteers (42
males and 48 females) was 41.23±17.62 years, ranging from 10 to 76
years old. All of them provided informed patient consent prior to
the study and the study protocol was approved by the Ethics
Committee of Wuxi Second People's Hospital, Nanjing, China. A total
of 30 patients (30 eyes) with different types of glaucoma who were
to receive trabeculectomy for the first time were included. Each
patient and healthy subject was individually assessed by DCT. Eyes
were included in the study if they met the following inclusion
criteria: Group 1 (CACG group); diagnosis of CACG based on elevated
intraocular pressure ≥21 mmHg, progressing angle closure and damage
of optic nerve, closed angle on gonioscopy, coherency between
peripheral iris and meshwork, typical glaucomatous visual field
defects and cupping of the optic disk without acute increase of
IOP. Group 2 (POAG group); diagnosis of POAG based on elevated
intraocular pressure >21 mmHg (based on an average of there IOP
readings on GAT), open angle on gonioscopy, glaucomatous visual
field defects, glaucomatous cupping of the optic disk and defects
of retinal nerve fiber layer. Group 3 (NTG group); diagnosis of NTG
based on normal intraocular pressure (≤21 mmHg), open angle on
gonioscopy, glaucomatous visual field defects, glaucomatous cupping
of the optic disk and defects of retinal nerve fiber layer.
Diseases leading to optic nerve damage such as intracal occupying
lesion were ideally excluded using computed tomography or magnetic
resonance imaging. Group 4 (SOAG group); diagnosis of SOAG based on
elevated intraocular pressure (≥21 mmHg) during several IOP
measurements at 24-hour intervals, large optic cup, significant
asymmetry of optic cup (>0.2) between the two eyes. Group 5 (NC
group, healthy volunteers); normal intraocular pressure (≤21 mmHg)
with no family history of glaucoma, C/D ≤0.3, normal limbal
anterior chamber depth (≥1/3 cornea thickness), with the exception
of mild cataract in the old and ametropia, no other eye diseases
were observed.
Patients were excluded from the study if they had
the following: i) Corneal diseases such as corneal macula and
corneal edema; ii) iridocyclitis; iii) severe myopia; iv) lens
opacity; v) poor performance in stare test; vi) use of
corticosteroid hormones; vii) history of intraocular surgery or
ocular trauma; viii) recent wearing of corneal contact lenses; ix)
previous filtering/drainage procedure or any other intraocular
surgery.
History of medication use was documented and
considered in the analysis. The total number of topical
IOP-lowering medications and the frequency of their use were
noted.
Assessments
Patients were studied prospectively, with visual
examinations and tests performed in the following sequence during
their visit: IOP and OPA measurements using DCT (Pascal DCT, SMT
Swiss Microtechnology AG, Port, Switzerland), and visual field
tests using oculus twinfield perimetry. Subjects were examined in a
random order and each tonometer was used three times separately,
with a 15-minute interval between each measurement. Each patient
undergoing trabeculectomy was subjected to DCT measurement
separately one day prior to surgery and at one week post-operation.
All of the measurements were performed by the same examiner. As DCT
offers a reliability coefficient (Q=1-5) for each reading, it
indicates a poorer reliability if a higher Q-value is obtained. In
the present study, only those readings with Q≤3 were used. GAT
measurements were performed on a slit lamp with a tonometer
calibrated according to the manufacturer's instructions under
topical anesthesia. Three GAT readings were obtained for each eye,
with a 5-min interval, and mean IOP was recorded. MD and LV was
detected by Oculus Twinfield perimetry (Oculus Optikgeraete GmbH,
Wetzlar, Germany) and C/D ratio was provided by Cirrus HD-OCT 4000
(Carl Zeiss AG, Oberkochen, Germany).
Statistical analysis
Values are expressed as the mean ± standard
deviation. During the evaluation of the study data, along with the
descriptive statistical methods, parameters with normal
distribution for the comparison of qualitative data were evaluated
using a paired-samples t-test. Pearson's correlation coefficients
were used to assess the correlation between OPA and other
parameters. P<0.05 was considered to indicate a statistically
significant difference. Statistical calculations were performed
using SPSS 11.5 (SPSS, Inc., Chicago, IL, USA).
Results
Population
A total of 217 eyes of 217 glaucoma patients were
included in the present study. The mean age was 54.56±17.84 (range,
12–89) years and the patient cohort included 63 males and 64
females. The patients were divided into the following five groups:
CACG (n=37), POAG (n=35), NTG (n=20), SOAG (n=35) and NC (n=90).
The mean cup-to-disk (C/D) ratio was 0.738±0.22 (range, 0.3–1). The
OPA value varied from 0.7 to 8.9 mmHg, with a mean of 2.85±1.41
mmHg. Table I summarizes the patient
characteristics in the different diagnostic groups.
 | Table I.Patient characteristics. |
Table I.
Patient characteristics.
| Group | N | Mean age, years
(range) | Males vs. females
(n) | Mean C/D ratio
(range) |
|---|
| Total | 127 |
54.56±17.84 | 63/64 |
0.738±0.22 |
| SOAG | 35 |
51.43±16.50 | 15/20 |
0.698±0.20 |
| CACG | 37 |
62.43±9.14 | 13/24 |
0.664±0.25 |
| POAG | 35 |
44.63±20.70 | 20/15 |
0.781±0.20 |
| NTG | 20 |
62.20±17.79 | 15/5 |
0.855±0.11 |
| NC | 90 |
41.23±17.62 | 42/48 |
0.267±0.28 |
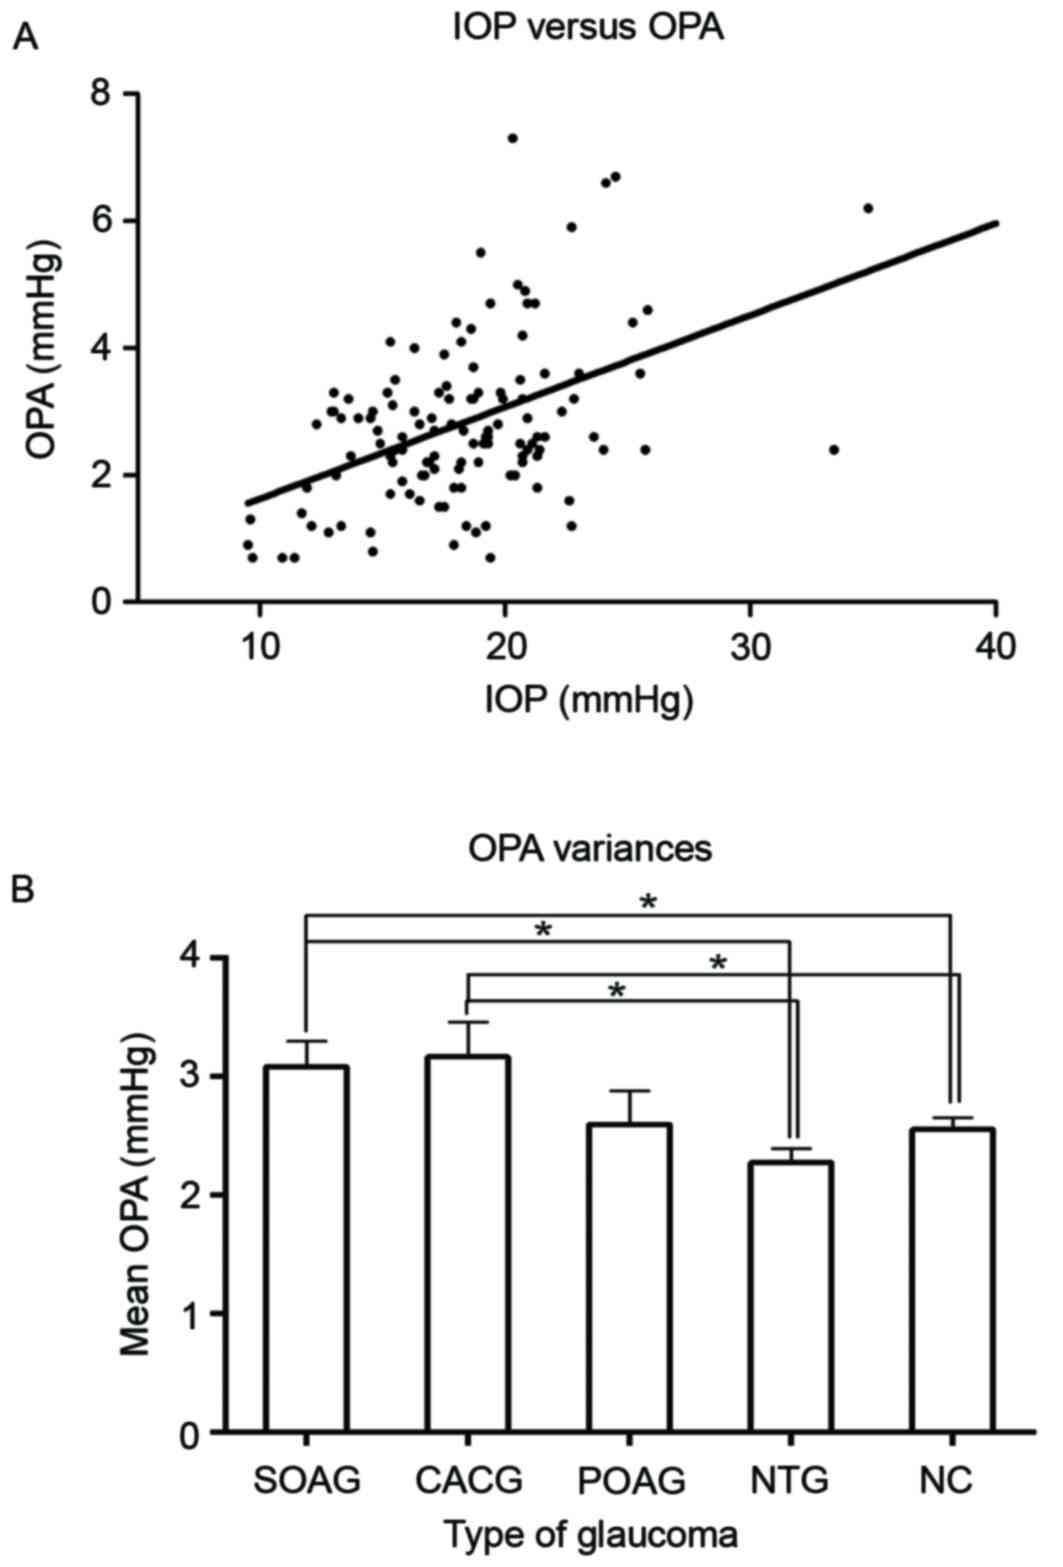
Correlation between OPA and IOP
The OPA was found to be significantly correlated
with the IOP measured by DCT, and the correlation coefficient was
0.503 (P<0.001; Fig. 1A). There
was a significant positive association between OPA and IOP (slope
estimate, 0.159; P<0.001), indicating that the OPA increased by
~1.6 mmHg with every 10-mmHg elevation in IOP measured by DCT.
Fig. 1B directly shows the mean OPA
values in each group. After comparing OPA among different types of
glaucoma and normal controls (Table
II), it was found that the average OPA values were highest in
the CACG group (3.17±1.76 mmHg). The NTG group had the lowest OPA
values (2.28±0.53 mmHg). The CACG group had significantly higher
OPA values than the NTG (P=0.014) and normal control group
(P=0.018). There was a similar significance of the difference of
the SOAG group from the NTG and normal control group (P=0.028 and
0.044, respectively). Table II also
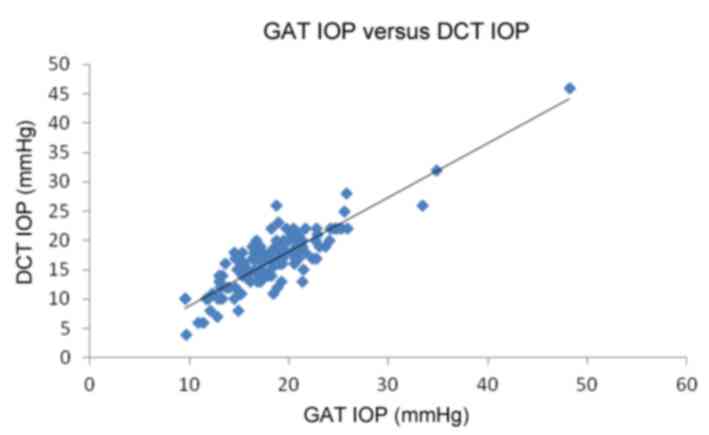
shows the mean IOP values detected by DCT as well as GAT in each of
these groups. The results indicated that DCT IOP values were in
good correspondence with the GAT IOP, with a correlation
coefficient of 0.867 (P<0.001, Fig.
2).
| Table II.GAT IOP, DCT IOP and DCT OPA in each
of the groups. |
Table II.
GAT IOP, DCT IOP and DCT OPA in each
of the groups.
| Group | N | GAT IOP (mmHg) | DCT IOP (mmHg) | DCT OPA (mmHg) |
|---|
| Total glaucoma | 127 |
16.67±5.22 |
18.45±4.91 |
2.85±1.41 |
| SOAG | 35 |
17.86±2.95 |
19.47±2.81 |
3.09±1.25a,b |
| CACG | 37 |
15.16±4.92 |
16.94±4.21 |
3.17±1.76a,b |
| POAG | 35 |
18.2±7.40 |
20.20±7.10 |
2.60±1.39 |
| NTG | 20 |
14.7±2.43 |
16.39±2.36 |
2.28±0.53 |
| NC | 90 |
14.27±2.81 |
17.33±2.71 |
2.56±1.18 |
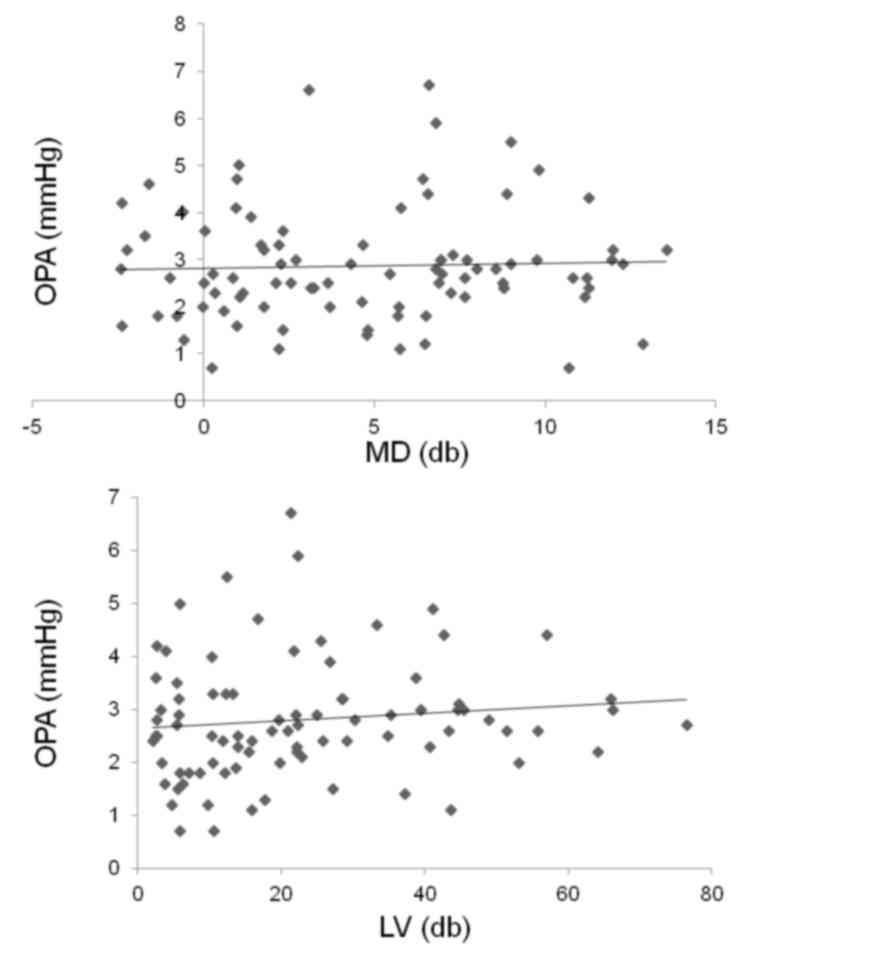
Correlation between OPA and visual
field parameters
The correlation of the OPA with the mean damage (MD)
and loss variance (LV) on the oculus twinfield perimetry was
assessed in order to determine whether visual field severity has
any correlation with the OPA. It was found that the OPA correlates
well with MD and LV, with the correlation coefficients being 0.322
(P=0.02) and 0.354 (P=0.01), respectively (Fig. 3).
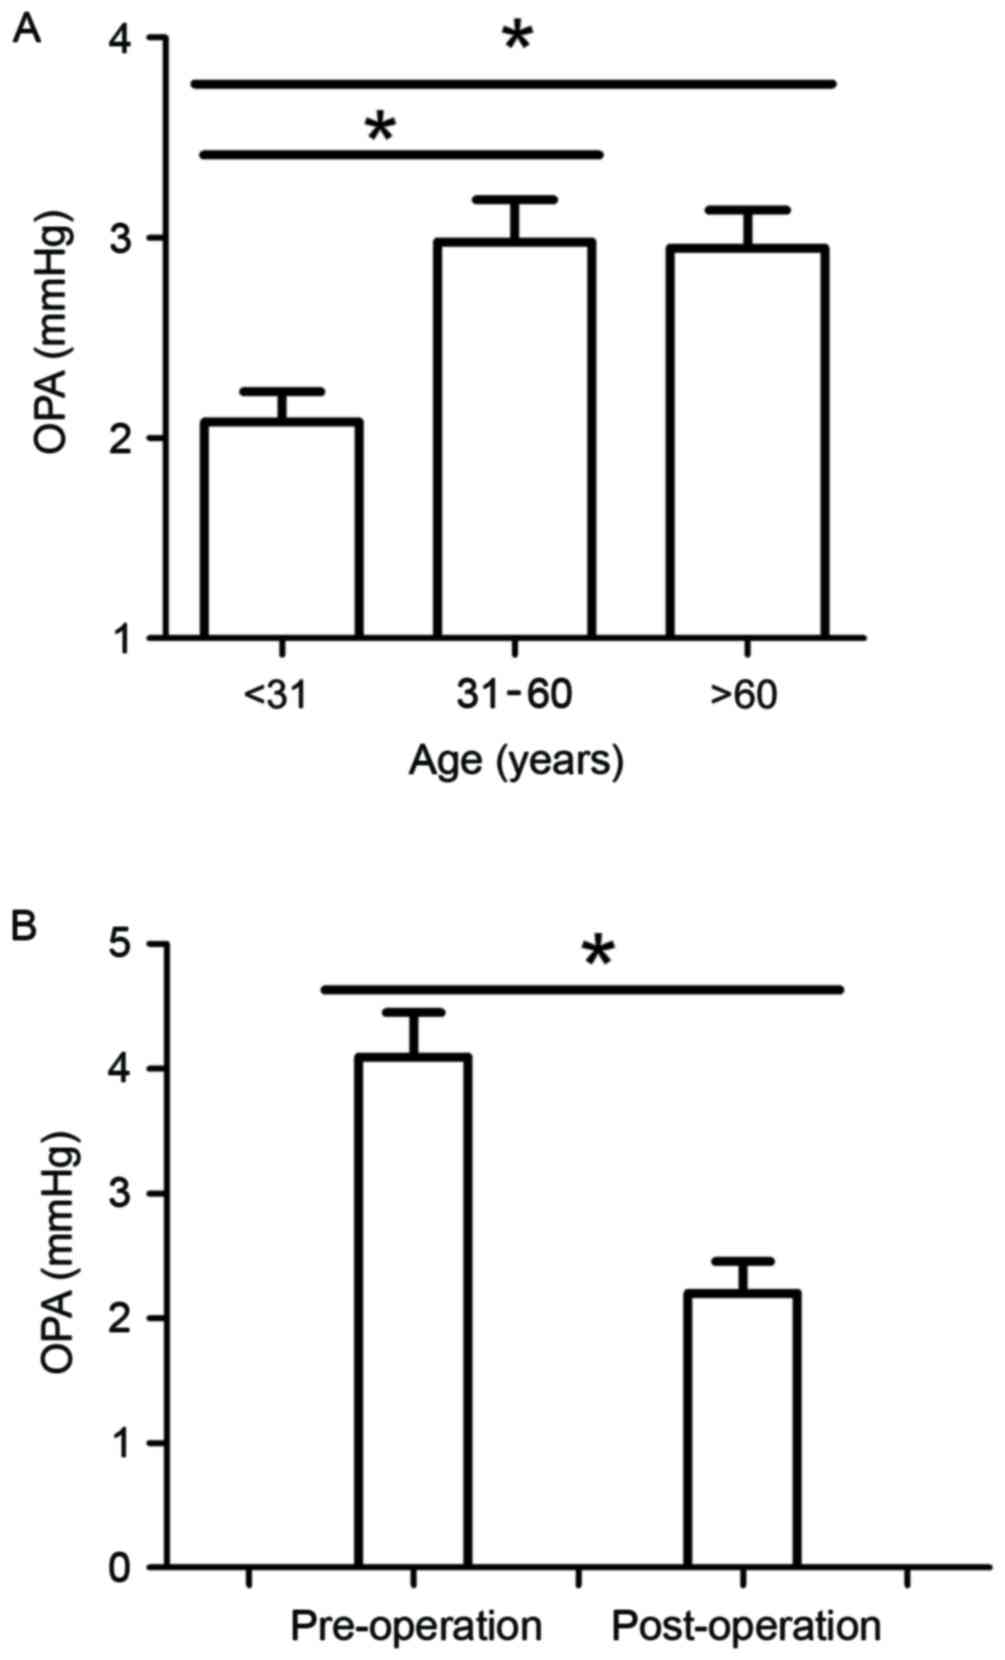
Association between OPA and age
In order to determine whether OPA varies in
different age groups, patients were divided into the following
three age groups: Group 1, <31 years; Group 2, 31–60 years;
Group 3, >60 years. The OPA values in Group 1 were significantly
lower than those in Groups 2 and 3 (P=0.022 and 0.025,
respectively). There was no significant difference between Groups 2
and 3 (P=0.915; Fig. 4A).
Association between OPA and
surgery
Comparison of the OPA prior to and subsequent to
surgery revealed that OPA values obviously decreased by 1.89±1.76
mmHg after surgery (P<0.05; Fig.
4B). Twenty-eight patients who had a decreased OPA following
surgery formed perfect blebs which possessed a fine filtered
function one week after surgery, while the other two patients who
had an increased OPA were found to have an increased IOP as well;
in these patients, the IOP was difficult to control and they had a
congestive and flat bleb.
Discussion
DCT is a novel principle of IOP measurement that is
totally independent of central corneal thickness, thus presumed to
provide more precise IOP measurements than other methods. The
tonometer is capable of measuring the OPA, which represents the
difference between systolic and diastolic values of the IOP. It may
be compared with the pulse pressure, which is the difference
between systolic and diastolic values of systemic blood pressure
(10). OPA is considered to be the
objective parameter reflecting choroidal perfusion and fluctuation
of the IOP, thus having significance in the clinical evaluation of
IOP constancy. The OPA may also be used to detect severe
cardiovascular disease as a non-invasive and affordable screening
tool (11). The present study
identified that the DCT OPA measurements are in good concordance
with the DCT IOP. Measured by DCT, the OPA values were consistent
with the IOP values.
This positive correlation between OPA and IOP has
been previously reported in healthy and glaucomatous eyes (8,12–14). Age
may have an important influence on DCT OPA. Patients with lower
average age (<31 years) showed a significantly lower OPA value.
While there was no linear correlation between OPA and age of
glaucoma patients, those aged <31 years indeed had a
significantly lower OPA than the others, which may be due to better
eyeball resilience and lower outflow resistance of aqueous fluid.
C/D ratios are likely to have no influence on OPA, which is similar
to the finding of a study by Romppainen et al (15). In fact, scleral properties (rigidity)
may vary with the level of IOP, which may contribute to the fact
that OPA increases with higher IOP.
The present study evaluated the differences in DCT
OPA among CACG, SOAG, POAG, NTG patients as well as healthy
controls. The DCT OPA in the CACG and SOAG groups was significantly
higher than that in the NTG and normal control groups, while that
in the POAG group was not significantly different from that in the
other groups. It has been previously reported that the OPA in NTG
patients was significantly lower (16,17),
while that in POAG patients was significantly higher than that in
healthy controls (18–20). In the present study, the OPA in the
POAG group was higher than that in the NTG group, while this
difference was not statistically significant, probably due to the
small sample size in the NTG group. However, detection of the OPA
may still be promising for clinical diagnosis: Owing to the high
value in the CACG group, the OPA may be supportive in the diagnosis
of CACG patients who have no symptoms or typical glaucomatous
visual field damage in the early stage.
Another interesting observation in the present study
was that the OPA value was obviously increased with the MD and LV
parameters of the visual field. This result is in accordance with
the findings from Vulsteke et al (13), indicating that, besides the
progression of visual field loss, an increased OPA value may be a
reliable indicator of the severity of glaucoma; more importantly,
the OPA value is not influenced by subjective factors. Therefore,
the OPA may be used as a significant indicator giving direction for
decisions regarding the treatment of glaucoma.
The present study found that 93.3% of glaucoma
patients had reduced OPA values after trabeculectomy and 92.9% of
them formed perfect blebs with a good filtering function at one
week after the operation. Such changes in the OPA appear to
illustrate that the OPA value is dependent on intraocular perfusion
pressure, which is altered by trabeculectomy. In addition, high
post-operative OPA values reflect the high amplitude of the
pulsatile ocular tension (21),
which may accelerate the formation of fibrillation and scar, which
unavoidably induce the failure of surgery. Therefore, the OPA value
represents a macroscopic parameter that predicts the bleb condition
and prognosis at an early stage after trabeculectomy in those
patients who require frequent follow-up and possibly additional
intervention. Patients who have decreased OPA values are likely to
form perfect blebs which possesses fine filtered function one week
after surgery, while those who had increased OPA values were found
to have increased IOP values as well, such patients' intraocular
pressure are always difficult to be controlled and they are more
likely to form congestive and flat bleb. Our study indicated that
OPA values measured by DCT can be a predictor for glaucoma
diagnosis and prognosis.
Acknowledgements
The authors would like to thank Dr Yinong Zhang
(Department of Ophthalmology, Wuxi Second People's Hospital of
Nanjing Medical University, Nanjing, China) for the help in
contacting the participants and caring for them. Colleagues who
contributed to the recording and analysis of the data are also
acknowledged.
References
|
1
|
Brown KE and Congdon NG: Corneal structure
and biomechanics: Impact on the diagnosis and management of
glaucoma. Curr Opin Ophthalmol. 17:338–343. 2006. View Article : Google Scholar : PubMed/NCBI
|
|
2
|
Punjabi OS, Kniestedt C, Stamper RL and
Lin SC: Dynamic contour tonometry: Principle and use. Clin Exp
Ophthalmol. 34:837–840. 2006. View Article : Google Scholar : PubMed/NCBI
|
|
3
|
Troost R, Vogel A, Beck S, Schwenn O, Grus
F and Pfeiffer N: Clinical comparison of two intraocular pressure
measurement methods: SmartLens dynamic observing tonography versus
Goldmann. Graefes Arch Clin Exp Ophthalmol. 239:889–892. 2001.
View Article : Google Scholar : PubMed/NCBI
|
|
4
|
Whitacre MM, Stein RA and Hassanein K: The
effect of corneal thickness on applanation tonometry. Am J
Ophthalmol. 115:592–596. 1993. View Article : Google Scholar : PubMed/NCBI
|
|
5
|
Brandt JD: Corneal thickness in glaucoma
screening, diagnosis, and management. Curr Opin Ophthalmol.
15:85–89. 2004. View Article : Google Scholar : PubMed/NCBI
|
|
6
|
Chihara E: Assessment of true intraocular
pressure: The gap between theory and practical data. Surv
Ophthalmol. 53:203–218. 2008. View Article : Google Scholar : PubMed/NCBI
|
|
7
|
Jonas J and Dichtl A: Optic disc
morphology in myopic primary-open angle glaucoma. Graefes Arch Clin
Exp Ophthalmol. 235:627–633. 1997. View Article : Google Scholar : PubMed/NCBI
|
|
8
|
Punjabi OS, Ho HK, Kniestedt C, Bostrom
AG, Stamper RL and Lin SC: Intraocular pressure and ocular pulse
amplitude comparisons in different types of glaucoma using dynamic
contour tonometry. Curr Eye Res. 31:851–862. 2006. View Article : Google Scholar : PubMed/NCBI
|
|
9
|
Knecht PB, Bosch MM, Michels S, Mannhardt
S, Schmid U, Bosch MA and Menke MN: The ocular pulse amplitude at
different intraocular pressure: A prospective study. Acta
Ophthalmol. 89:e466–e471. 2011. View Article : Google Scholar : PubMed/NCBI
|
|
10
|
Pourjavan S, Boëlle PY, Detry-Morel M and
De Potter P: Physiological diurnal variability and characteristics
of the ocular pulse amplitude (OPA) with the dynamic contour
tonometer (DCT-Pascal). Int Ophthalmol. 27:357–360. 2007.
View Article : Google Scholar : PubMed/NCBI
|
|
11
|
Bertelmann T, Langanke S, Potstawa M and
Strempel I: Can dynamic contour tonometry and ocular pulse
amplitude help to detect severe cardiovascular pathologies? Clin
Ophthalmol. 8:1317–1321. 2014. View Article : Google Scholar : PubMed/NCBI
|
|
12
|
Stalmans I, Harris A, Vanbellinghen V,
Zeyen T and Siesky B: Ocular pulse amplitude in normal tension and
primary open angle glaucoma. J Glaucoma. 17:403–407. 2008.
View Article : Google Scholar : PubMed/NCBI
|
|
13
|
Vulsteke C, Stalmans I, Fieuws S and Zeyen
T: Correlation between ocular pulse amplitude measured by dynamic
contour tonometer and visual field defects. Graefes Arch Clin Exp
Ophthalmol. 246:559–565. 2008. View Article : Google Scholar : PubMed/NCBI
|
|
14
|
Kniestedt C, Lin S, Choe J, Nee M, Bostrom
A, Stürmer J and Stamper RL: Correlation between intraocular
pressure, central corneal thickness, stage of glaucoma, and
demographic patient data: Prospective analysis of biophysical
parameters in tertiary glaucoma practice populations. J Glaucoma.
15:91–97. 2006. View Article : Google Scholar : PubMed/NCBI
|
|
15
|
Romppainen T, Kniestedt C, Bachmann LM and
Stürmer J: Ocular pulse amplitude: A new biometrical parameter for
the diagnose of glaucoma? Ophthalmologe. 104:230–235. 2007.(In
German). View Article : Google Scholar : PubMed/NCBI
|
|
16
|
Schmidt KG, Rückmann AV, Mittag TW,
Hessemer V and Pillunat LE: Reduced ocular pulse amplitude in low
tension glaucoma is independent of vasospasm. Eye (Lond).
11:485–488. 1997. View Article : Google Scholar : PubMed/NCBI
|
|
17
|
Schmidt KG, von Rückmann A, Geyer O and
Mittag TW: Effect of nifedipine on ocular pulse amplitude in normal
pressure glaucoma. Klin Monbl Augenheilkd. 210:355–359. 1997.(In
German). View Article : Google Scholar : PubMed/NCBI
|
|
18
|
Mittag TW, Serle J, Schumer R, Brodie S,
Stegman D, Schmidt KG, Taniguchi T, Rho SH and Podos S: Studies of
the ocular pulse in primates. Surv Ophthalmol. 38:S183–S190. 1994.
View Article : Google Scholar : PubMed/NCBI
|
|
19
|
Schmidt KG, von Rückmann A and Mittag TW:
Ocular pulse amplitude in ocular hypertension and open-angle
glaucoma. Ophthalmologica. 212:5–10. 1998.(In German). View Article : Google Scholar : PubMed/NCBI
|
|
20
|
Choi J, Lee J, Park SB, Lee KS, Sung KR
and Kook MS: Factors affecting ocular pulse amplitude in eyes with
open angle glaucoma and glaucoma suspect eyes. Acta Ophthalmol.
90:552–558. 2012. View Article : Google Scholar : PubMed/NCBI
|
|
21
|
von Schulthess SR, Kaufmann C, Bachmann
LM, Yanar A and Thiel MA: Ocular pulse amplitude after
trobeculectomy. Graefes Arch Clin Exp Ophthalmol. 244:46–51. 2006.
View Article : Google Scholar : PubMed/NCBI
|