Introduction
Acute myocardial infarction (AMI) refers to
myocardial necrosis resulting from acute, persistent ischemia and
hypoxia due to coronary atherosclerosis and poses a serious threat
to patients. The incidence of AMI is rising due to the rapidly
increasing population (1,2). Therefore, it is essential to reduce the
morbidity and mortality rates of AMI and improve the prognosis of
patients.
AMI is caused by the interaction of multiple
factors, including immunity, the environment and genetics (3). The risk factors of AMI include age,
sex, smoking, dyslipidemia, hypertension, diabetes, abdominal
obesity and chronic inflammation (4). Furthermore, the incidence of AMI
exhibits clear familial aggregation and a large number of
associated genes serve important roles in its onset and development
(5). Gene-chip technology
facilitates the identification of differentially expressed genes in
patients with AMI and may potentially be used as an auxiliary means
during the evaluation and diagnosis of patients with AMI (6). Abnormally expressed genes may
contribute to early identification of high-risk groups and may
potentially be used as an early warning marker or therapeutic
target of AMI.
Fatty acids are an important source of energy for
mammals. They are broken down into carbon dioxide and water under
aerobic conditions, during which a large amount of energy is
released in the form of adenosine triphosphate (ATP) (7). The long-chain acyl-coenzymeA synthetase
(ACSL) family is a key enzyme family for the biosynthesis and
catabolism of fatty acids (8). ACSL1
serves a role in multiple anabolic and catabolic lipid pathways,
including those making cholesterol esters, triglycerides and
phosphate esters (9). Disruptions in
these pathways can cause various metabolic diseases, including
hepatic steatosis, hyperlipoidemia and insulin resistance (10). ACSL1 is the major subtype of ACSL in
the liver; however the association between the expression of ACSL1
in peripheral blood leukocytes (PBL) and AMI remains unclear. The
results of our previous study investigating the differential gene
expression profile of AMI indicated that the expression of certain
genes in PBL differs significantly between patients with AMI and
healthy controls (11). Among
differentially expressed genes, the expression of ACSL1 is
significantly increased in AMI (LogFC=2.590, P=0.04) (11). Based on this pattern of expression,
the present study hypothesized that the ACSL1 gene is involved in
the pathogenesis of AMI and an investigation was conducted into the
potential of using ACSL1 expression in PBL as a biomarker for
assessing AMI risk.
Patients and methods
Patients
The patient group (AMI group) consisted of 75
inpatients (45 male and 30 female; mean age, 58.96 years) from the
Han population of Northern China. Patients were admitted into the
Department of Cardiology of The China-Japan Union Hospital of Jilin
University (Jilin, China) between November 2014 and March 2016.
Diagnosis of AMI was confirmed according to the Universal
Definition of Myocardial Infarction (12) and coronary angiography was performed
to confirm that narrowing of >70% was exhibited in ≥1 of the
main branches (left main, left anterior descending, circumflex and
right) of the coronary arteries. Non-coronary atherosclerotic heart
disease was confirmed when narrowing of <50% was exhibited in
the main branches of the coronary arteries (left main, left
anterior descending, circumflex and right coronary arteries) using
coronary angiography. This was present in 70 cases (39 male and 31
female; mean age, 58.13 years), which were subsequently selected as
controls (Control group). They were admitted into the Department of
Cardiology of The China-Japan Union Hospital of Jilin University
between November 2014 and March 2016. The exclusion criteria of
patients in the current study were as follows: i) AMI induced by
percutaneous coronary intervention or coronary artery bypass
grafting; ii) an imbalance between supply and demand secondary to
the myocardial injury, including coronary endothelial dysfunction
with no significant coronary artery disease, coronary artery spasm,
coronary embolism, fast/slow arrhythmia, severe anemia, severe
respiratory failure, aortic dissection or severe aortic valve
disease and hypertrophic cardiomyopathy; iii) non-ischemic
myocardial injury, including cardiac contusion, surgery, ablation,
pacemaking or defibrillation, rhabdomyolysis with cardiac
involvement, myocarditis and taking cardiotoxic drugs; iv)
myocardial injury induced by multifactor or uncertain factors
including severe heart failure, stress cardiomyopathy, severe
pulmonary hypertension or pulmonary embolism, sepsis and critically
ill patients, renal failure, severe acute neurological diseases,
including stroke, subarachnoid hemorrhage, invasive diseases,
including amyloidosis, sarcoidosis and intense exercise; v)
patients exhibiting severe infectious diseases or malignant tumors;
vi) patients suffering from chronic infectious diseases or with a
history of recurrent infectious disease; vii) active or latent
Tuberculosis infection history; viii) patients with immune system
diseases and/or taking hormones and suspected or confirmed
immunodeficiency; ix) patients with incomplete angiographic or
clinical data. The exclusion criteria (v-ix) were also applicable
to the control group.
Ethical approval
The current study was approved by the Ethics
Committee of the China-Japan Union Hospital of Jilin University
(Jilin, China). Written informed consent was obtained from all
subjects prior to enrollment in the study. Detailed clinical data
were recorded, including medication history, blood lipids, fasting
blood glucose, markers of myocardial damage, blood pressure while
seated, body mass index (BMI), coronary angiography information,
family history of premature coronary heart disease, smoking history
and history of other clinical diseases.
Blood collection
A total of 4 ml peripheral blood was drawn into EDTA
anticoagulant-coated tubes from all fasting subjects in the morning
and stored at 4°C. All blood samples were used within 2 h of
collection. Each peripheral blood sample was equally divided for
total RNA or protein extraction from peripheral blood mononuclear
cells.
Total RNA extraction and cDNA
synthesis
Peripheral blood mononuclear cells were isolated
from fresh blood samples by Ficoll density gradient centrifugation
(Lymphocyte Separation Medium; Hao Yang Biological Technology Co.,
Ltd., Tianjin, China) according to the manufacturer's protocol.
Total RNA from peripheral blood mononuclear cells was extracted
using the RNA simple Total RNA kit (Beijing Bio-tech Co Ltd,
Beijing, China) following the manufacturer's instructions. RNA
purity and concentration were measured using a NanoDrop
spectrophotometer (NanoDrop 2000; Thermo Fisher Scientific Inc.,
Wilmington, DE, USA) with a sample volume of 1 µl. RNA purity was
assessed according to A260/A280 and A260/A230 absorbance ratios.
RNA samples are required to have an absorbance reading of 1.9–2.1
for the A260/A280 ratio and >2 for the A260/A230 ratio. RNA
integrity was verified based on the 28S and 18S ribosomal RNA bands
following electrophoresis on a 1.5% agarose gel, staining with
ethidium bromide (20–30 min at room temperature) and visualization
with UV light. A total of 1 µg qualified total RNA was used for
cDNA synthesis with a ReverTra Ace® RT-qPCR kit (Toyobo
Co., Ltd., Osaka, Japan) following the manufacturer's protocol.
cDNA samples were stored at −20°C prior to qPCR.
Total protein extraction
Peripheral blood mononuclear cells were lysed with
radioimmunoprecipitation assay lysis buffer (Beyotime Institute of
Biotechnology, Haimen, China) and total protein was collected from
the supernatant following centrifugation at 13,400 × g for 20 min
at 4°C. Protein concentration was measured using the bicinchoninic
acid method using a spectrophotometer (Nanodrop 2000; Thermo Fisher
Scientific, Inc.). Protein samples were stored at −80°C prior to
western blot analysis.
qPCR detection
A cDNA sample (1 µg; ×10 dilution) was used for qPCR
with SYBR® Premix Ex Taq™ (Takara
Biotechnology Co., Ltd., Dalian, China). qPCR amplification was
conducted in a 20 µl reaction mixture containing 10 µl
SYBR® Premix Ex Taq™, 0.5 µl upstream and
downstream primers with a concentration 10 µmol/l and 8 µl
nuclease-free double-distilled water in the Mx3005P RT-qPCR System
(Stratagene; Agilent Technologies Inc., Santa Clara, CA, USA). The
thermocycling conditions were as follows: 95°C for 10 min; 40
cycles of 95°C for 15 sec, 60°C for 20 sec, 72°C for 20 sec and
95°C for 1 min, 55°C for 30 sec and 95°C for 30 sec. Following the
reaction, 10 µl assay mixture was used for 1.5% agarose gel
electrophoresis using Tris, acetic acid and EDTA buffer (1x),
following a standard procedure. GAPDH was used as the reference
gene and each sample was run at least in triplicate. The results
were quantified using the 2−∆∆Cq method (13). All PCR primers were designed with
Primer Premier 6.0 (VoyaGene Biotech Co., Ltd., Hangzhou, China)
according to the mRNA sequence from the National Centre for
Biotechnology Information (https://www.ncbi.nlm.nih.gov/; ACSL1, NM_001995;
GAPDH, NM_001256799) and synthesized by Shanghai Biological
Technology Ltd. (Shanghai, China) and the sequences are presented
in Table I.
 | Table I.Primer sequences. |
Table I.
Primer sequences.
| Gene names | Primer sequences
(5′-3′) |
|---|
| ACSL1 |
|
| F |
CCATGAGCTGTTCCGGTATTT |
| R |
CCGAAGCCCATAAGCGTGTT |
| GAPDH |
|
| F |
GGAGCGAGATCCCTCCAAAAT |
| R |
GGCTGTTGTCATACTTCTCATGG |
Western blot analysis
Total protein (30 µg per lane) underwent 10%
SDS-PAGE and was transferred onto a polyvinylidene fluoride
membrane with a semi-dry transfer device (Bio-Rad Laboratories,
Inc., Hercules, CA, USA) for 10 min. The membrane was blocked with
blocking buffer (TBS with 0.1% Tween-20 and 5% skim milk powder) at
room temperature for 1 h. The blocked membrane was incubated with a
primary antibodies in TBST at 4°C overnight (ACSL1 monoclonal
antibodies, 1:1,000, cat. no. ab177958; β-actin polyclonal antibody
antibodies, 1:1,000, cat. no. ab8227; Abcam, Cambridge, MA, USA)
Following washing, the membrane was incubated with secondary
antibodies (Hydroxypyruvate reductase conjugated sheep anti-rabbit
immunoglobulin G; 1:3,000; cat. no. ab 97051; Abcam) at 4°C for 1
h. The membrane was developed using an enhanced chemiluminescence
kit (Thermo Fisher Scientific, Inc.). To analyze the relative
expression level of each protein, densitometric analysis was
performed using Image Lab 4.1 software (Bio-Rad Laboratories,
Inc.).
Statistical analysis
All data were statistically analyzed with SPSS 22.0
software (IBM Corp., Armonk, NY, USA) and expressed as mean ±
standard error. When comparing differences between groups, data
with a normal distribution were analyzed using an independent T
test and non-normal distribution data were analyzed using a
Wilcoxon signed rank test. Count data were expressed as frequency
for statistical description and differences between groups were
analyzed with a χ2 test; AMI-associated risk factors
were analyzed using binary logistic regression analysis. Blood
vessel lesions between groups were compared with the Mann-Whitney U
test. The correlation between the relative expression of ACSL1 and
cardiac troponin I (cTnI) was measured using bivariate correlation
analysis. Data of relative ACSL1 expression were used to construct
a receiver operating characteristic (ROC) curve and the area under
the curve and standard error were calculated to deduce the
threshold value. P<0.05 was considered to indicate a
statistically significant difference.
Results
Analysis of clinical data
There were no significant differences between the
AMI and control groups in age, sex, BMI, family history of coronary
heart disease, smoking history, incidence of hypertension and
diabetes (Table II). However, there
were significant differences between serum lipid and glucose levels
in the AMI and control groups. The fasting glucose, total plasma
cholesterol, plasma triglycerides and plasma low-density
lipoprotein (LDL) levels in the AMI group were significantly
increased compared with the control group (all P<0.01; Table III), whereas plasma high-density
lipoprotein (HDL) levels were significantly decreased compared with
the control group (P<0.05; Table
III).
| Table II.Clinical data comparison between the
AMI and control groups. |
Table II.
Clinical data comparison between the
AMI and control groups.
| Data | AMI group (n=75) | Control group
(n=70) | t/χ2 | P-values |
|---|
| Age (year) | 58.96±9.05 | 58.13±6.68 | −0.63 | 0.53 |
| Sex |
|
| 0.27 | 0.60 |
| Male | 45 (60.00) | 39 (55.71) |
|
|
|
Female | 30 (40.00) | 31 (44.29) |
|
|
| BMI
(kg/m2) | 25.10±3.44 | 25.56±3.90 | 0.76 | 0.45 |
| Hypertension | 37 (49.33) | 26 (37.14) | 2.19 | 0.14 |
| Diabetes | 15 (20.00) | 10 (14.29) | 0.83 | 0.36 |
| Family history | 6 (8.00) | 5 (7.14) | 0.04 | 0.85 |
| Smoking
history | 38 (50.67) | 26 (37.14) | 2.69 | 0.10 |
| Table III.Comparison of the levels of blood
glucose and blood lipid between the AMI and control groups. |
Table III.
Comparison of the levels of blood
glucose and blood lipid between the AMI and control groups.
| Index (mmol/l) | AMI group
(n=75) | Control group
(n=70) | t | P-values |
|---|
| Fasting
blood-glucose | 6.73±2.10 | 5.76±1.53 | −3.08 | 0.003a |
| Total
cholesterol | 4.96±1.24 | 4.43±1.02 | −2.79 | 0.01a |
| Triglycerides | 2.48±1.34 | 1.77±0.98 | −3.61 |
<0.001a |
| LDL | 3.34±1.03 | 2.86±0.81 | −3.11 | 0.002a |
| HDL | 0.98±0.29 | 1.07±0.27 | 2.06 | 0.04a |
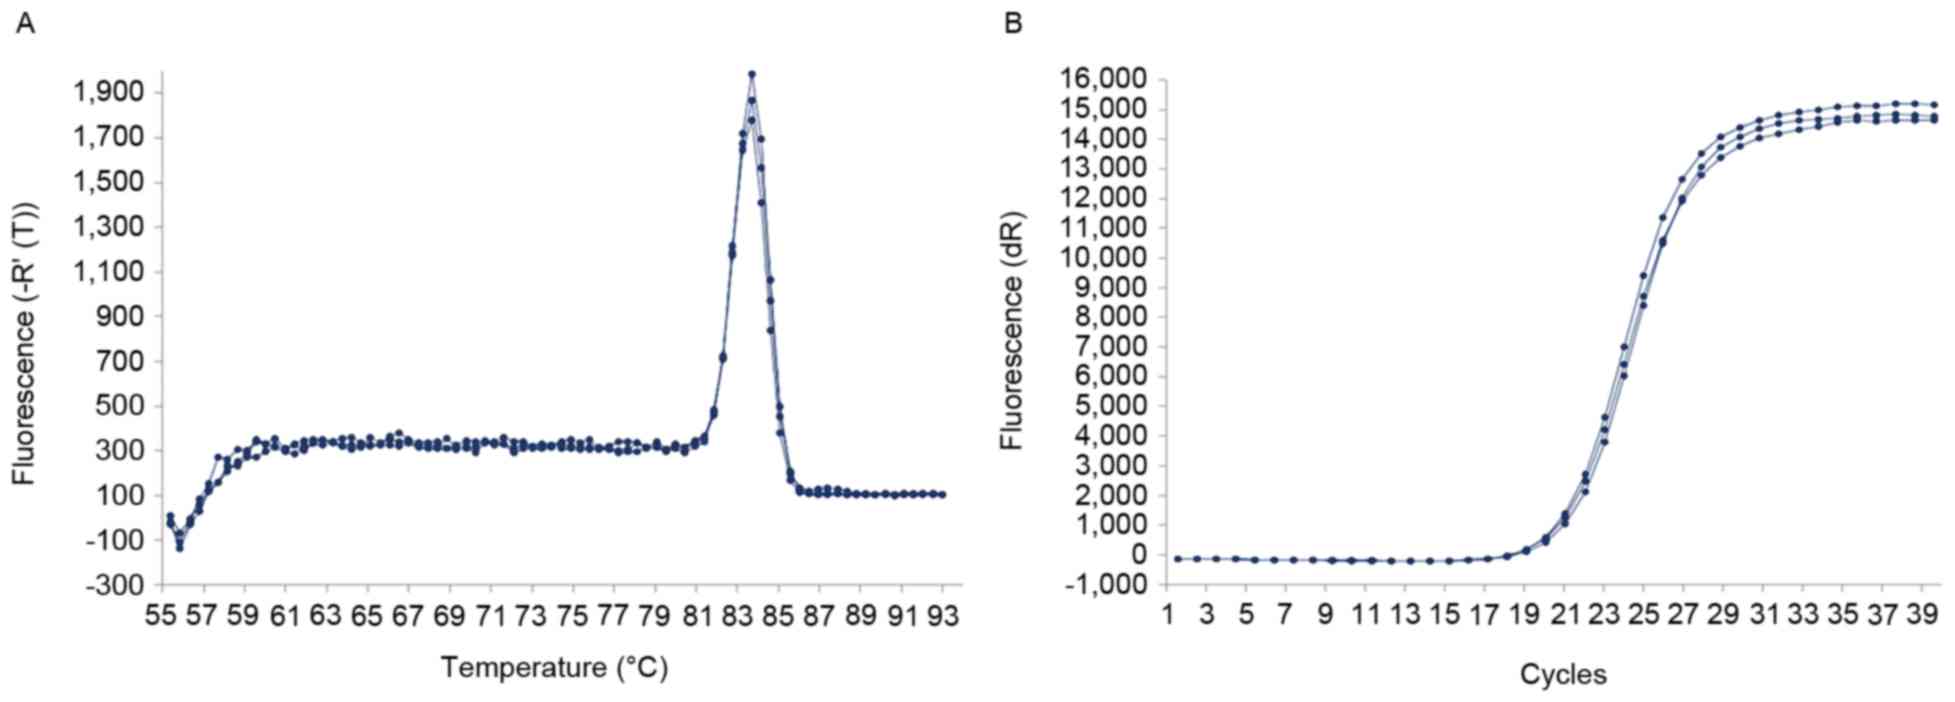
RT-qPCR
The dissolution curve of the ACSL1 gene exhibited a
single dissolution peak with high PCR specificity (Fig. 1A) and the amplification curve was
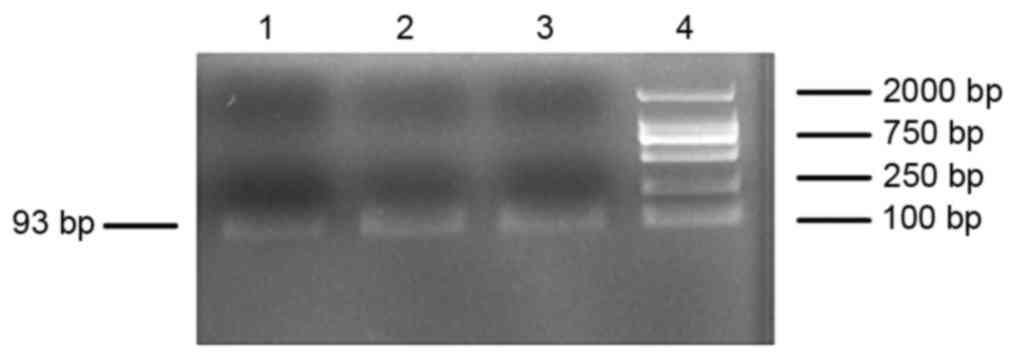
clearly sigmoid (Fig. 1B). PCR
products were checked for the presence of the objective band on the
1.5% agarose gel. The PCR products were used to measure ACSL1
expression and exhibited the target band with the expected size of
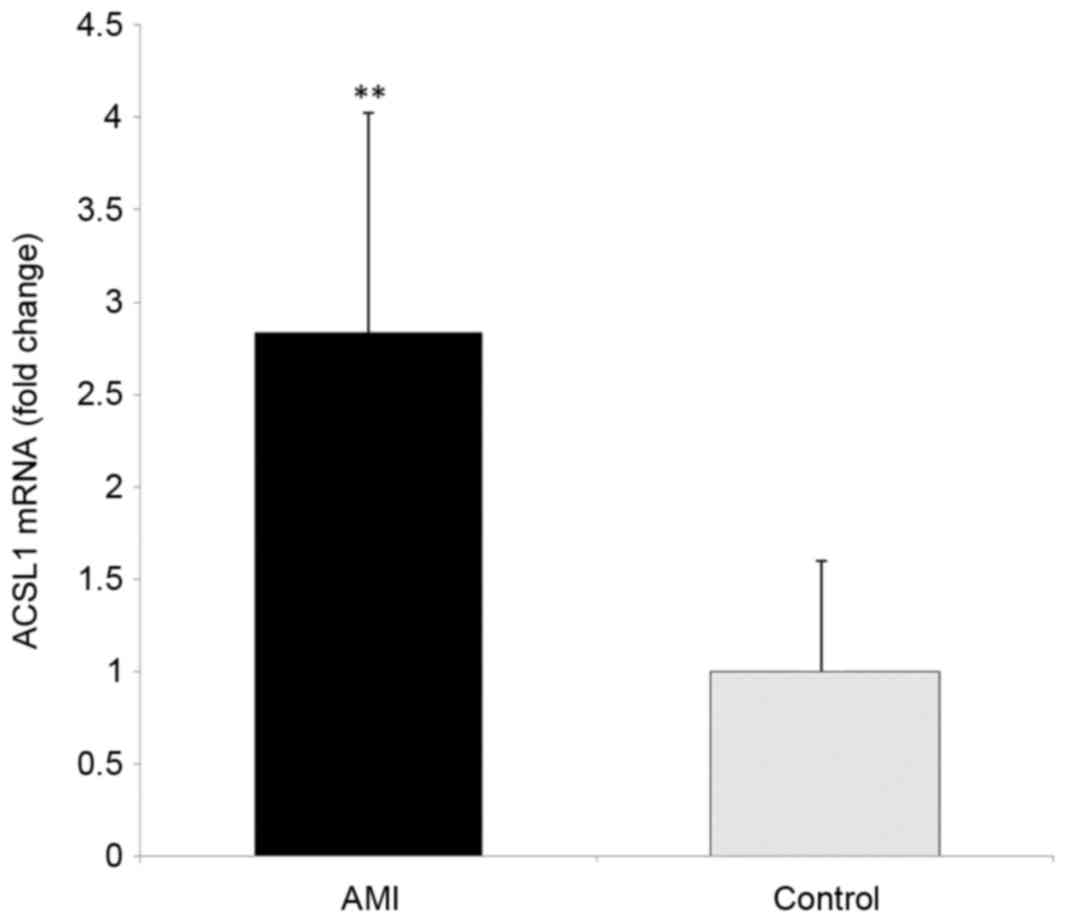
~93-bp (Fig. 2). The ΔΔCq value of
RT-qPCR from each sample was the mean ± standard deviation of three
repeats within the required range. There was a significant
difference in the 2−ΔΔCq value of the ACSL1 gene between
the AMI 0.18±0.08 and control groups (0.06±0.04; t=−11.48,
P<0.01). The relative expression of ACSL1 gene was calculated by
2−∆∆Cq method. The results showed that the relative
expression of ACSL1 gene was 2.84±1.18 times of the control group
(Fig. 3). These results demonstrate
that the level of ACSL1 mRNA in the PBL of patients with AMI is
significantly increased.
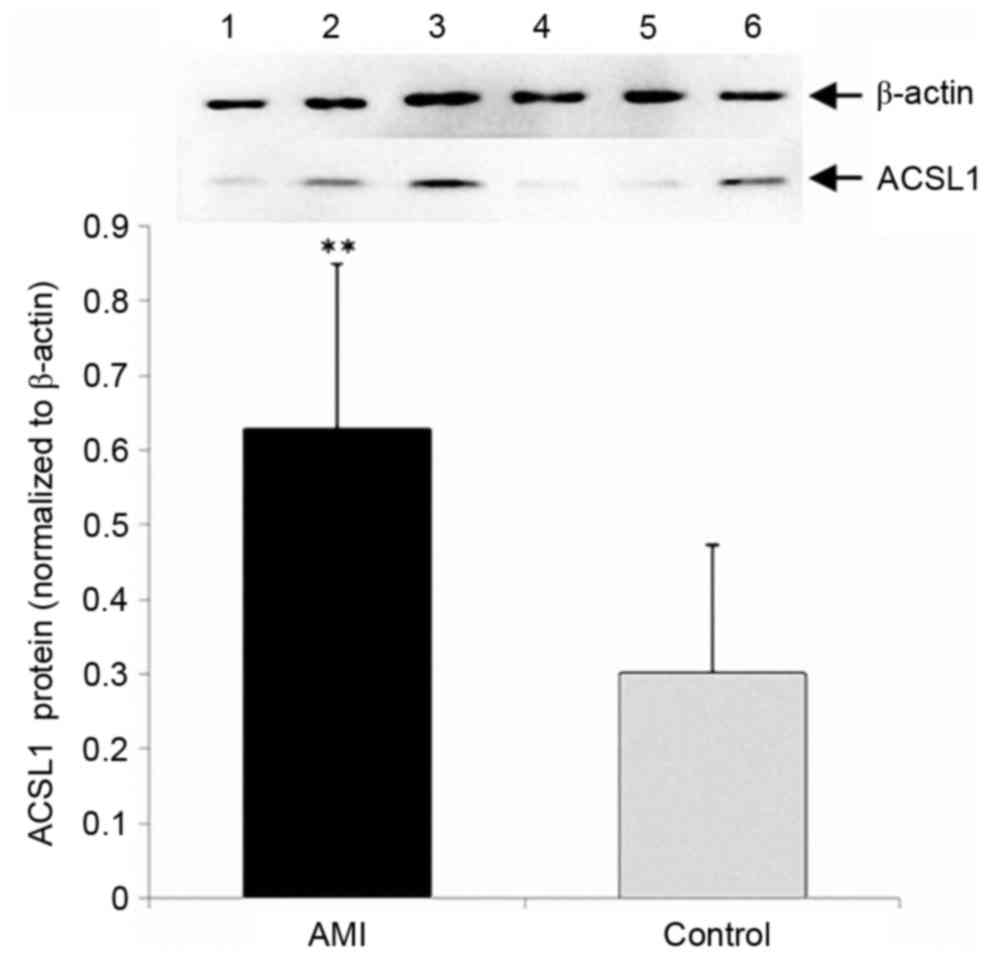
Western blot analysis
The expression of ACSL1 protein in the AMI group was
significantly increased compared with the control group (P<0.01;
Fig. 4).
Logistic regression analysis assessing
the association between expression of ACSL1 and AMI
To further analyze whether increased expression of
ACSL1 was a risk factor of AMI, the 145 subjects were divided into
a low expression group (2−ΔΔCq ≤0.11) and a high
expression group (2−Δ∆Cq>0.11), according to the
median relative level of ACSL1 expression (Table IV). The associations between AMI and
the relative expression of ACSL1, age, sex, BMI, smoking history,
family history of premature coronary heart disease, hypertension,
diabetes, blood sugar and blood cholesterol were analyzed using
stepwise logistic regression analysis. The results demonstrated
that increased gene expression of ACSL1 (P<0.01) and increased
total blood cholesterol levels (P=0.01) were independent risk
factors for AMI (Table V).
| Table IV.Clinical data comparison between the
low expression and high expression groups. |
Table IV.
Clinical data comparison between the
low expression and high expression groups.
| Data | Low expression
(n=73) | High expression
(n=72) |
t/χ2 | P-value |
|---|
| Age (year) | 57.62±6.87 | 59.51±8.90 | −1.43 | 0.15 |
| Sex |
|
| 0.19 | 0.66 |
|
Male | 41 (56.16) | 43 (59.72) |
|
|
|
Female | 32 (43.84) | 29 (40.28) |
|
|
| BMI
(kg/m2) | 25.88±3.91 | 24.76±3.33 | 1.86 | 0.06 |
| Hypertension | 28 (38.36) | 35 (48.61) | 1.55 | 0.21 |
| Diabetes | 12 (16.44) | 13 (18.066) | 0.07 | 0.79 |
| Family history | 8 (10. 96) | 3 (4.17) | 2.38 | 0.12 |
| Smoking
history | 29 (39.73) | 35 (48.61) | 1.16 | 0.28 |
| FBG (mmol/l) | 5.82±1.54 | 6.79±1.98 | −3.22 | 0.002a |
| TC (mmol/l) | 4.59±1.17 | 4.82±1.15 | −1.22 | 0.22 |
| TG (mmol/l) | 1.80±0.94 | 2.48±1.39 | −3.44 | 0.001a |
| LDL (mmol/l) | 2.95±0.97 | 3.27±0.91 | −1.98 | 0.04a |
| HDL (mmol/l) | 1.08±0.27 | 0.97±0.28 | 2.23 | 0.03a |
| Table V.Logistic regression analysis
indicating independent risk factors of AMI. |
Table V.
Logistic regression analysis
indicating independent risk factors of AMI.
| Variables | Regression
coefficient | Standard error | Wald | P-values | OR | 95% CI |
|---|
| Relative expression
level of ACSL1 | 4.07 | 0.56 | 52.35 |
<0.001a | 58.66 | 19.47–176.74 |
| Total
cholesterol | 0.61 | 0.23 |
7.20 | 0.01a |
1.84 | 1.18–2.88 |
The association between the expression
of ACSL1 in patients with AMI and the severity of coronary artery
lesions
The 75 patients with AMI were divided into a ACSL1
low expression level group (2−∆∆Cq≤0.17) and a ACSL1
high expression level group (2−∆∆Cq>0.17) according
to the median relative expression levels in the AMI group. The
numbers of blood vessel lesions were counted in the two groups.
Lesions were identified where angiography confirmed coronary artery
stenosis of >70%. The severity of lesions between the AMI and
control groups was compared using the Mann-Whitney U test and the
results demonstrated that high expression of ACSL1 was
significantly associated with the numbers of lesions in the main
branches of the coronary artery (P=0.03; Table VI), suggesting that the expression
of ACSL1 may reflect the severity of coronary arteriosclerosis.
| Table VI.Comparison of the number of vessel
lesions between patients with different levels of ACSL1
expression. |
Table VI.
Comparison of the number of vessel
lesions between patients with different levels of ACSL1
expression.
| Group | Single vessel
lesion | Double vessel
lesion | Three vessel
lesion | Z value | P-value |
|---|
| Low ACSL1
expression level (n=38) | 16 (42.11) | 12 (31.58) | 10 (26.31) | −2.16 | 0.03a |
| High ACSL1
expression level (n=37) | 6
(16.22) | 16 (43.24) | 15 (40.54) |
|
|
Bivariate correlation analysis on
serum cTnI and relative expression of ACSL1 in patients with
AMI
The median cTnI concentration of the AMI group was
0.56 (0.11–7.52) ng/ml (data not shown). Bivariate correlation
analysis on cTnI and the relative gene expression of in AMI
patients gave an Spearman's rank correlation coefficient
(rs) of value 0.20 (P=0.16), indicating that there was
no correlation between ACSL1 expression and the concentration of
serum cTnI. Although the increased gene expression of ACSL1
increases the morbidity of AMI, the expression of ACSL1 is not
associated with the size of the myocardial injury.
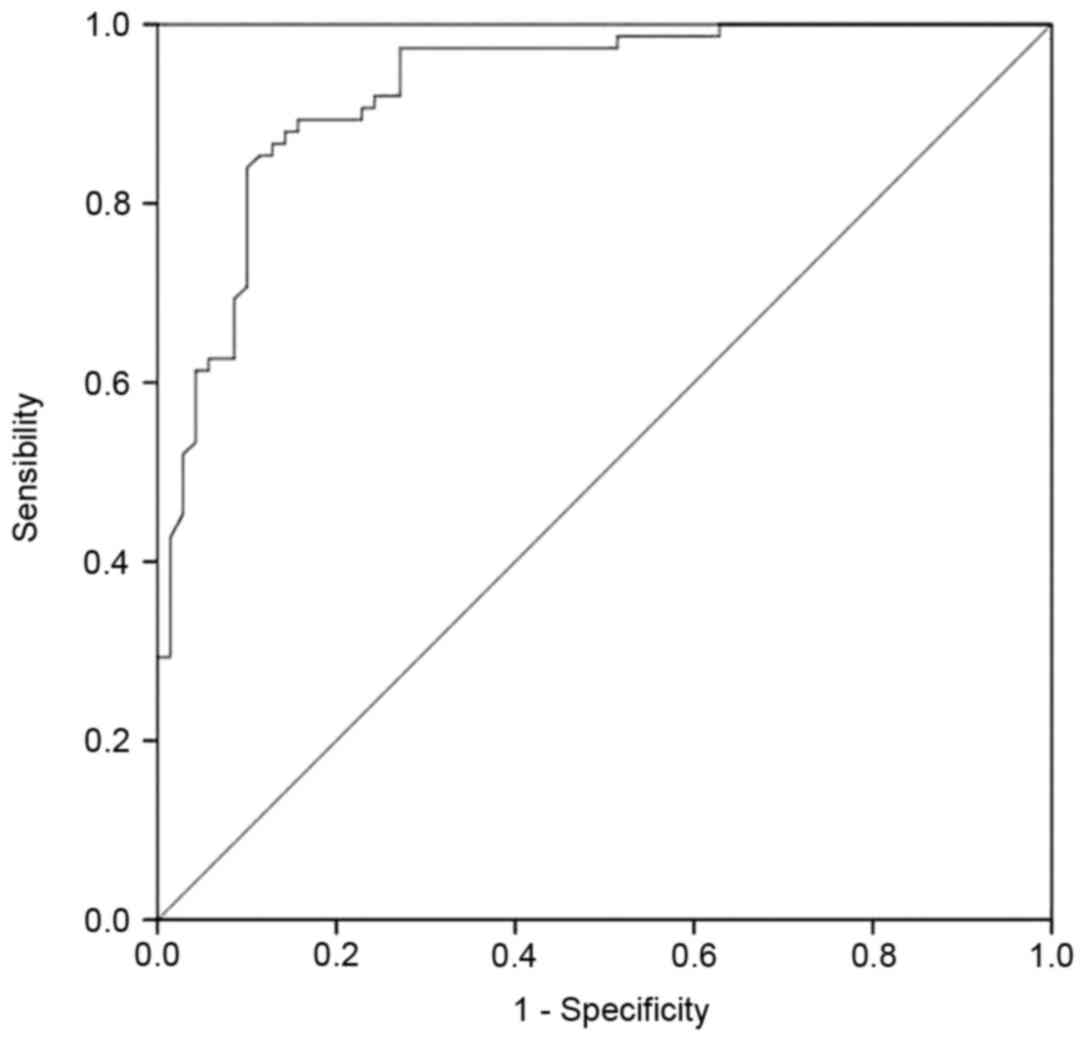
ROC curves and cut off value of the
relative expression of ACSL1 in patients with AMI
Levels of ACSL1 expression exhibited diagnostic
accuracy for AMI and the area under the curve was 0.93±0.02 with a
cutoff value of 0.112 as determined by the maximum value of
Youden's index (14) (P<0.01;
Fig. 5)/This indicates that high
expression of ACSL1 results in a high likelihood of AMI. The
sensitivity and specificity were 84 and 90%, respectively. The
positive and negative prediction rates were 90 and 84%,
respectively.
Discussion
Coronary atherosclerotic heart disease is the most
common cardiovascular disease and is caused by the interaction
between genetic and environmental factors (15–17). AMI
refers to myocardial necrosis induced by acute, persistent ischemia
and hypoxia, which can result in further life-threatening
complications, including arrhythmia, cardiogenic shock and acute
heart failure. A previous study has demonstrated that changes in
the expression of various genes (including ALOX5, MGST1, CREB5,
IL1RN, CSF2R, VCAN are CSF3R) are correlated with susceptibility of
patients to coronary heart disease (18,19).
Furthermore, a previous study on the differential gene expression
profile of AMI determined that the expression of ACSL1 in the
peripheral blood of patients with AMI is significantly increased
(11). The present study expanded
the sample size and confirmed that the expression of ACSL1 mRNA and
protein was significantly increased in the PBL of patients with AMI
from Northern China.
Fatty acids are an important source of energy for
mammals. Fatty acids and their products exert many different
functions in metabolism and signal transduction. Long-chain
acyl-coenzyme A synthetase catalyzes the first step of the reaction
in fatty acid metabolism and is one of the key enzymes in fat
synthesis and catabolism (20).
ACSL1, a major subtype of ACSL, catalyzes the synthesis of
bioactive acyl-coenzyme A esters using long-chain fatty acids, ATP
and coenzyme A as substrates (21).
Acyl-coenzyme A ester is an important fuel for fatty acid
catabolism and participates in the synthesis of phospholipids,
cholesterol esters, ceramide, triglycerides and other complex
lipids (22). Increased levels of
ACSL1 are expressed in the liver, cardiac muscle, fat and
endothelial cells and monocytes-macrophages (23). It has been demonstrated that the
expression of ACSL1 is correlated with increased lipid loading and
insulin sensitivity and that decreased gene expression of ACSL1 can
reduce the lipid loading and glucose uptake in cells (24). In mice with high-fat diets, the
expression of ACSL1 is consistent with the severity of obesity,
suggesting that ACSL1 is involved in the regulation of insulin
sensitivity and lipids in cells (25).
ACSL1 is actively involved in the synthesis and
oxidation of fat in liver cells (26). Disorders in metabolic pathways can
trigger a variety of metabolic diseases. However, to the best of
our knowledge, the association between ACSL1 expression and AMI
remains unclear. In the present study, logistic regression analysis
demonstrated that ACSL1 expression in PBL was an independent risk
factor for AMI. Furthermore, ACSL1 expression is correlated with
the number of lesions on the main branches of the coronary artery.
Therefore, the increased expression of ACSL1 suggests more severe
atherosclerosis.
Cardiac troponin is currently recognized as an
indicator with high specificity and sensitivity for necrotic
myocardial cell injury (27). cTnI
released from myocardial cells during AMI is positively correlated
with the scope of myocardial cell damage (28). The present study indicated that ACSL1
expression was not significantly correlated with serum cTnI levels
in patients with AMI, suggesting that the expression of ACSL1
promotes the onset of AMI, not the scope of myocardial
infarction.
The ROC curves indicated that the relative
expression of ACSL1 exhibited high sensitivity, specificity and
positive and negative prediction values in the diagnosis of AMI.
Therefore, the relative expression of ACSL1 may be used as a
genetic marker for assessing the risk of AMI.
Clinical data analysis identified that patients with
AMI had significantly increased fasting blood glucose, total
cholesterol, triglyceride and LDL, which are risk factors of
atherosclerosis but exhibited decreased levels of HDL compared with
the control group. ACSL1 is broadly involved in the synthesis and
oxidation of fatty acids; therefore it is possible that increased
ACSL1 expression influences blood glucose and lipid levels, leading
to atherosclerosis of the arteries, thus stimulating the
development of AMI.
Apart from glucose and lipid metabolism disorders,
chronic inflammation serves an important role in atherosclerosis
and AMI. Previous studies have indicated that ACSL1 expression may
affect the expression of inflammatory chemokines and it has been
demonstrated that levels of ACSL1 expression are significantly
increased in monocyte-macrophages in a type I diabetic mouse model
and in humans with type I diabetes (29–31).
Furthermore, specific inhibition of ACSL1 expression in type I
diabetic mice selectively reduces the inflammatory response of the
cells and the effects of diabetic atherosclerosis (32). This suggests that the expression of
ACSL1 is closely associated with chronic inflammation in patients
with diabetes, which contributes to the initiation and progression
of atherosclerosis. However, further studies are required to
determine whether ACSL1 expression promotes the pro-inflammatory
response in individuals with normal blood sugar levels. The current
study was limited as the inflammatory markers were not measured and
recorded.
In conclusion, the current study demonstrated that
ACSL1 expression was significantly increased in the peripheral
blood mononuclear cells of patients with AMI and it was determined
that increased expression of ACSL1 is an independent risk factor
for AMI. ACSL1 expression was positively correlated with the
severity of atherosclerosis. However, the expression of ACSL1 was
not correlated with the scope of AMI. ACSL1 may promote the onset
of AMI by affecting the metabolism of fat and glucose. Thus, the
increased expression of ACSL1 in peripheral blood mononuclear cells
may potentially be used as a molecular marker for the early
diagnosis of AMI.
Acknowledgements
The authors would like to thank Professor Zhihui
Zhao and his team in Jilin University School of Animal Husbandry
and Veterinary Medicine (Jilin, China) for their excellent
technical guidance in the current study.
References
|
1
|
Lopez AD and Mathers CD: Measuring the
global burden of disease and epidemiological transitions:
2002–2030. Ann Trop Med Parasitol. 100:481–499. 2006. View Article : Google Scholar : PubMed/NCBI
|
|
2
|
Moran AE, Forouzanfar MH, Roth GA, Mensah
GA, Ezzati M, Flaxman A, Murray CJ and Naghavi M: The global burden
of ischemic heart disease in 1990 and 2010: The global burden of
disease 2010 study. Circulation. 129:1493–1501. 2014. View Article : Google Scholar : PubMed/NCBI
|
|
3
|
Moreira DM, da Silva RL, Vieira JL, Fattah
T, Lueneberg ME and Gottschall CA: Role of vascular inflammation in
coronary artery disease: Potential of anti-inflammatory drugs in
the prevention of atherothrombosis. Inflammation and
anti-inflammatory drugs in coronary artery disease. Am J Cardiovasc
Drugs. 15:1–111. 2015. View Article : Google Scholar : PubMed/NCBI
|
|
4
|
White HD and Chew DP: Acute myocardial
infarction. Lancet. 372:570–584. 2008. View Article : Google Scholar : PubMed/NCBI
|
|
5
|
Zdravkovic S, Wienke A, Pedersen NL and de
Faire U: Genetic susceptibility of myocardial infarction. Twin Res
Hum Genet. 10:848–852. 2007. View Article : Google Scholar : PubMed/NCBI
|
|
6
|
Zhang Y, Lin P, Jiang H, Xu J, Luo S, Mo
J, Li Y and Chen X: Extensive serum biomarker analysis in patients
with ST segment elevation myocardial infarction (STEMI). Cytokine.
76:356–362. 2015. View Article : Google Scholar : PubMed/NCBI
|
|
7
|
Yan S, Yang XF, Liu HL, Fu N, Ouyang Y and
Qing K: Long-chain acyl-CoA synthetase in fatty acid metabolism
involved in liver and other diseases: An update. World J
Gastroenterol. 21:3492–3498. 2015. View Article : Google Scholar : PubMed/NCBI
|
|
8
|
Coleman RA, Lewin TM and Muoio DM:
Physiological and nutritional regulation of enzymes of
triacylglycerol synthesis. Annu Rev Nutr. 20:77–103. 2000.
View Article : Google Scholar : PubMed/NCBI
|
|
9
|
Soupene E and Kuypers FA: Mammalian
long-chain acyl-CoA synthetases. Exp Biol Med (Maywood).
233:507–521. 2008. View Article : Google Scholar : PubMed/NCBI
|
|
10
|
Li LO, Mashek DG, An J, Doughman SD,
Newgard CB and Coleman RA: Overexpression of rat long chain
acyl-coa synthetase 1 alters fatty acid metabolism in rat primary
hepatocytes. J Biol Chem. 281:37246–37255. 2006. View Article : Google Scholar : PubMed/NCBI
|
|
11
|
Xudong Guo, Lin Fan, Xiangdong Li and
Fanbo Meng: Microarray analysis of differential gene expression
profile in the peripheral blood cells of the patients with
myocardial infarction. ResearchGate. DOI:
10.1016/j.jacc.2015.06.596.
|
|
12
|
Thygesen K, Alpert JS, Jaffe AS, Simoons
ML, Chaitman BR and White HD: Writing Group on the Joint
ESC/ACCF/AHA/WHF Task Force for the Universal Definition of
Myocardial Infarction. Thygesen K, Alpert JS, White HD, et al:
Third universal definition of myocardial infarction. Eur Heart J.
33:2551–2567. 2012.
|
|
13
|
Livak KJ and Schmittgen TD: Analysis of
relative gene expression data using real-time quantitative PCR and
the 2(-Delta Delta C(T)) method. Methods. 25:402–408. 2001.
View Article : Google Scholar : PubMed/NCBI
|
|
14
|
Hughes G: Youden's index and the weight of
evidence. Methods Inf Med. 54:198–199. 2015. View Article : Google Scholar : PubMed/NCBI
|
|
15
|
Zeller T, Blankenberg S and Diemert P:
Genomewide association studies in cardiovascular disease-an update
2011. Clin Chem. 58:92–103. 2012. View Article : Google Scholar : PubMed/NCBI
|
|
16
|
Kullo IJ and Ding K: Mechanisms of
disease: The genetic basis of coronary heart disease. Nat Clin
Pract Cardiovasc Med. 4:558–569. 2007. View Article : Google Scholar : PubMed/NCBI
|
|
17
|
Joehanes R, Ying S, Huan T, Johnson AD,
Raghavachari N, Wang R, Liu P, Woodhouse KA, Sen SK, Tanriverdi K,
et al et al: Gene expression signatures of coronary heart disease.
Arterioscler Thromb Vasc Biol. 33:1418–1426. 2013. View Article : Google Scholar : PubMed/NCBI
|
|
18
|
Friede KA, Ginsburg GS and Voora D: Gene
expression signatures and the spectrum of coronary artery disease.
J Cardiovasc Transl Res. 8:339–352. 2015. View Article : Google Scholar : PubMed/NCBI
|
|
19
|
Ogawa N, Imai Y, Morita H and Nagai R:
Genome-wide association study of coronary artery disease. Int J
Hypertens. 21:7905392010.
|
|
20
|
Wang YL, Guo W, Zang Y, Yaney GC, Vallega
G, Getty-Kaushik L, Pilch P, Kandror K and Corkey BE: Acyl coenzyme
a synthetase regulation: Putative role in long-chain acyl coenzyme
a partitioning. Obes Res. 12:1781–1788. 2004. View Article : Google Scholar : PubMed/NCBI
|
|
21
|
Parkes HA, Preston E, Wilks D, Ballesteros
M, Carpenter L, Wood L, Kraegen EW, Furler SM and Cooney GJ:
Overexpression of acyl-CoA synthetase-1 increases lipid deposition
in hepatic (HepG2) cells and rodent liver in vivo. Am J Physiol
Endocrinol Metab. 291:E737–E744. 2006. View Article : Google Scholar : PubMed/NCBI
|
|
22
|
Li LO, Klett EL and Coleman RA: Acyl-CoA
synthesis, lipid metabolism and lipotoxicity. Biochim Biophys Acta.
1801:246–251. 2010. View Article : Google Scholar : PubMed/NCBI
|
|
23
|
Kanter JE, Tang C, Oram JF and Bornfeldt
KE: Acyl-CoA synthetase 1 is required for oleate and linoleate
mediated inhibition of cholesterol efflux through ATP-binding
cassette transporter A1 in macrophages. Biochim Biophys Acta.
1821:358–364. 2012. View Article : Google Scholar : PubMed/NCBI
|
|
24
|
Ellis JM, Li LO, Wu PC, Koves TR, Ilkayeva
O, Stevens RD, Watkins SM, Muoio DM and Coleman RA: Adipose
acyl-CoA synthetase-1 directs fatty acids toward beta-oxidation and
is required for cold thermogenesis. Cell Metab. 12:53–64. 2010.
View Article : Google Scholar : PubMed/NCBI
|
|
25
|
Joseph R, Poschmann J, Sukarieh R, Too PG,
Julien SG, Xu F, Teh AL, Holbrook JD, Ng KL, Chong YS, et al: ACSL1
is associated with fetal programming of insulin sensitivity and
cellular lipid content. Mol Endocrinol. 29:909–920. 2015.
View Article : Google Scholar : PubMed/NCBI
|
|
26
|
Zhan T, Poppelreuther M, Ehehalt R and
Füllekrug J: Overexpressed FATP1, ACSVL4/FATP4 and ACSL1 increase
the cellular fatty acid uptake of 3T3-L1 adipocytes but are
localized on intracellular membranes. PLoS One. 7:e450872012.
View Article : Google Scholar : PubMed/NCBI
|
|
27
|
Zimmerman J, Fromm R, Meyer D, Boudreaux
A, Wun CC, Smalling R, Davis B, Habib G and Roberts R: Diagnostic
marker cooperative study for the diagnosis of myocardial
infarction. Circulation. 99:1671–1677. 1999. View Article : Google Scholar : PubMed/NCBI
|
|
28
|
Boden H, Ahmed TA, Velders MA, van der
Hoeven BL, Hoogslag GE, Bootsma M, le Cessie S, Cobbaert CM,
Delgado V, van der Laarse A and Schalij MJ: Peak and fixed-time
high-sensitive troponin for prediction of infarct size, impaired
left ventricular function and adverse outcomes in patients with
first ST-segment elevation myocardial infarction receiving
percutaneous coronary intervention. Am J Cardiol. 111:1387–1393.
2013. View Article : Google Scholar : PubMed/NCBI
|
|
29
|
Kanter JE, Kramer F, Barnhart S, Averill
MM, Vivekanandan-Giri A, Vickery T, Li LO, Becker L, Yuan W, Chait
A, et al et al: Diabetes promotes an inflammatory macrophage
phenotype and atherosclerosis through acyl-CoA synthetase 1. Proc
Natl Acad Sci USA. 109:E715–E724. 2012. View Article : Google Scholar : PubMed/NCBI
|
|
30
|
Renard CB, Kramer F, Johansson F, Lamharzi
N, Tannock LR, von Herrath MG, Chait A and Bornfeldt KE: Diabetes
and diabetes-associated lipid abnormalities have distinct effects
on initiation and progression of atherosclerotic lesions. J Clin
Invest. 114:659–668. 2004. View Article : Google Scholar : PubMed/NCBI
|
|
31
|
Ricciotti E and FitzGerald GA:
Prostaglandins and inflammation. Arterioscler Thromb Vasc Biol.
31:986–1000E7. 2011. View Article : Google Scholar : PubMed/NCBI
|
|
32
|
Kanter JE and Bornfeldt KE: Inflammation
and diabetes-accelerated atherosclerosis: Myeloid cell mediators.
Trends Endocrinol Metab. 24:137–144. 2013. View Article : Google Scholar : PubMed/NCBI
|