Introduction
Metabolic syndrome is a pathological state that
contains multiple metabolic abnormalities, which is manifested in
the form of hyperglycemia, hyperlipoidemia, blood lipid disorder,
obesity and other clinical features (1). Blood glucose and blood lipid metabolic
disorders also significantly increase the probability of
cardiovascular disease in patients (2). Atherosclerosis is the main cause for
the induction of multiple cardiovascular diseases, but whether
there is a direct correlation between MS and atherosclerosis
remains unclear. Many clinical data and studies have found that the
central link of metabolic syndrome is insulin resistance (3).
Adiponectin (APN) is located on chromosome 3q27 and
contains three exons and two groups of introns. Human APN protein
structure has 244 amino acids, while the C-terminal aromatic amino
acid globular sequence is the key part of the activity of APN
protein (4). As an important
upstream factor regulating the activity of insulin, APN has widely
drawn attention since its discovery (5). Previous studies have confirmed that
APN gene has important physiological functions and is
closely associated with the incidence of cardio-cerebral vascular
disease, obesity, and MS (6–8). Completion of genome sequencing plays an
important role in the diagnosis and prediction of human diseases.
In recent years, an increasing number of APN polymorphic sites have
been found in the genome, while many polymorphic sites have an
important relationship with the occurrence of multiple diseases
(9–11). Previous studies found that APN
gene single nucleotide polymorphism (SNP) rs266729 is closely
related to Type 2 diabetes mellitus (T2DM), but whether this site
could increase the incidence of MS and the degree of
atherosclerosis in patients with MS remains unclear. Therefore, APN
rs266729 gene polymorphisms in the metabolic syndrome group
(n=182), the metabolic abnormality group (n=187) and the control
group (n=134) were detected, and the levels of plasma in APN
protein and atherosclerosis-related protein were examined to
analyze the correlation between adiponectin (APN) gene polymorphism
and metabolic syndrome and its relationship with the degree of
atherosclerosis in the patients included in the present study.
Materials and methods
Subjects
The study was conducted on 264 subjects, admitted to
the Department of Medicine April 2008 and May 2013, and who were
diagnosed as obese (BMI ≥28). There were 145 male and 119 female
cases, with an average age of 54±0.6 years. Of the 264 subjects,
114 cases were selected as the control group; 71 male and 43 female
cases, with an average age of 55±0.3 years.
Informed consent was obtained from all the subjects
and it was taken into consideration that the subjects were not
related to each other. The study was approved by the Ethics
Committee of Hebei Medical University.
MS observation index and
measurement
The body mass index (BMI), waist circumference and
hip circumference were measured to calculate the waist-to-hip
ratio. The triglyceride and high-density lipoprotein (HDL) were
detected by MINDRAY sublimation automatic analyzer (Mindray,
Shenzhen, China). The fasting blood glucose was determined by
glucose oxidase assay and the fasting insulin was determined by
radioimmunoassay.
Diagnosis and grouping of MS
Diagnosis of MS was based on WHO (1999) T2DM
diagnostic criteria, the hyperglycemia criterion which included
impaired glucose tolerance, impaired fasting blood glucose and
impaired glucose regulation. As per the 1999 WHO/ISII diagnostic
criteria, the hypertension criterion was defined as for the
multiple blood pressure measurements on the different days, the
systolic blood pressure was ≥140 mmHg and/or the diastolic blood
pressure was ≥90 mmHg. MS criterion was in accordance with the
diagnostic criteria proposed by the Chinese Medical Association in
2004. The subjects were divided into three groups based on the
presence and degree of metabolic abnormality. The MS group (n=142)
required three items or all of the four items as follows: i)
overweight and/or obesity: BMI ≥25.0 kg/m2; ii)
hyperglycemia: fasting blood glucose ≥6.1 mmol/l and/or 2 h PG ≥7.8
mmol/l, and/or the patients who were diagnosed as having diabetes
and were receiving treatment; iii) hypertension: blood pressure
≥140/90 mmHg, and/or the patients who diagnosed as hypertension and
were receiving treatment; iv) blood lipid disorder: triglyceride
≥1.7 mmol/l and/or HDL-C: male <0.9 mmol/l and female <1.0
mmol/l. The 122 cases in the metabolic abnormality group met one or
two of the above MS criteria. The normal control group comprised
individuals who met none of the MS criteria.
Sample collection
Venous blood (5 ml) was taken after patients fasted
for 12 h. Five milliliters was used to extract the peripheral blood
genomic DNA using the routine chloroform method after
anticoagulation. One milliliter was used to detect blood glucose,
blood lipid and HDL after procoagulation and separating the serum.
Then, 4 ml was used to detect the related protein expression level
changes in serum by immunoblotting.
Gene polymorphism detection
The rs121917815 gene sequence was
ACCTGGAGAAGGTGCCTATGTATAC[C/T]GCTCA GCATTCAGTGTGGGATTGGA. The PCR
primer sequence was rs121917815 upstream 5′-AGGTCCCCGAGGCTTTCCG-3
and downstream primer 5′-TAGAAGATCTTGGTAAAGGCG AAT-3. TaqMAN probe
sequence was 5′-ACCTGGAGAAGG TGCCTATGTATACT(C)GCTCAGCATTCAGTG-3,
and FAM was marked at the T allele 5-terminal, VIC was marked at
the C allele 5-terminal, while TAMRA was marked at 3-terminal
(Shanghai Shengshun Biological Technology Co., Ltd., Shanghai,
China). APN rs121917815 gene polymorphism was detected by
quantitative PCR. The reaction conditions were activating UNG
enzyme at 50°C for 2 min, pre-denaturation at 94°C for 4 min,
denaturation at 94°C for 30 sec, annealing at 54°C for 40 sec,
extension at 60°C for 45 sec, a total of 40 cycles, and extension
at 72°C for 10 min was the final condition. After each cycle, the
fluorescence intensity of the PCR product was detected.
Evaluation of the degree of
atherosclerosis
C-reactive protein (CRP), IL-1, HDL-2a and HDL-2b
immunoblotting as well as AI were used to evaluate the degree of
atherosclerosis in the patients. The atherosclerosis index (AI) was
calculated as: [Total cholesterol (TC)-HDL]/HDL. Normal AI was set
as <4, while AI >4 suggests presence of atherosclerosis.
Detecting APN protein, CRP, IL-1,
HDL-2a and HDL-2b expression level changes by immunoblotting
After separating the target protein using 12% SDS
gel, a cross-flow transferring membrane using 350 mA current was
performed for 4 h, and the sample was sealed using 10% BSA for 1 h.
The primary antibody dilution was performed in accordance with the
antibody specification. After 4°C overnight, the membrane was
washed three times with TBST buffer for 20 min. Then, it was
diluted in accordance with the secondary antibody specification, at
room temperature for 1 h, and the membrane was washed three times
with TBST buffer for 20 min. The sample was then treated with ECL,
and color development was carried out in the dark. After scanning,
the optical density was analyzed by ImageJ, and the data were
collected for statistical treatment using SPSS software.
Statistical analysis
SPSS 15.0 software (Chicago, IL, USA) was used for
the analysis of collected data. The experimental data were
expressed as mean ± SD, and a t-test was used for analyzing the
difference among the groups. The Chi-square test was used for the
comparison of countable data among the groups. P<0.05 suggested
that the difference was statistically significant.
Results
Comparison of clinical data and serum
APN protein expression changes in the three groups
The clinical data of the control, the metabolic
abnormality and the MS group showed that the body mass index,
waist-to-hip ratio, abdominal fat area, systolic blood pressure,
diastolic blood pressure, and fasting insulin levels in the MS
group were higher than those in the control group and the metabolic
abnormality group (P<0.05), while the index levels in the
metabolic abnormality group were higher than those in the control
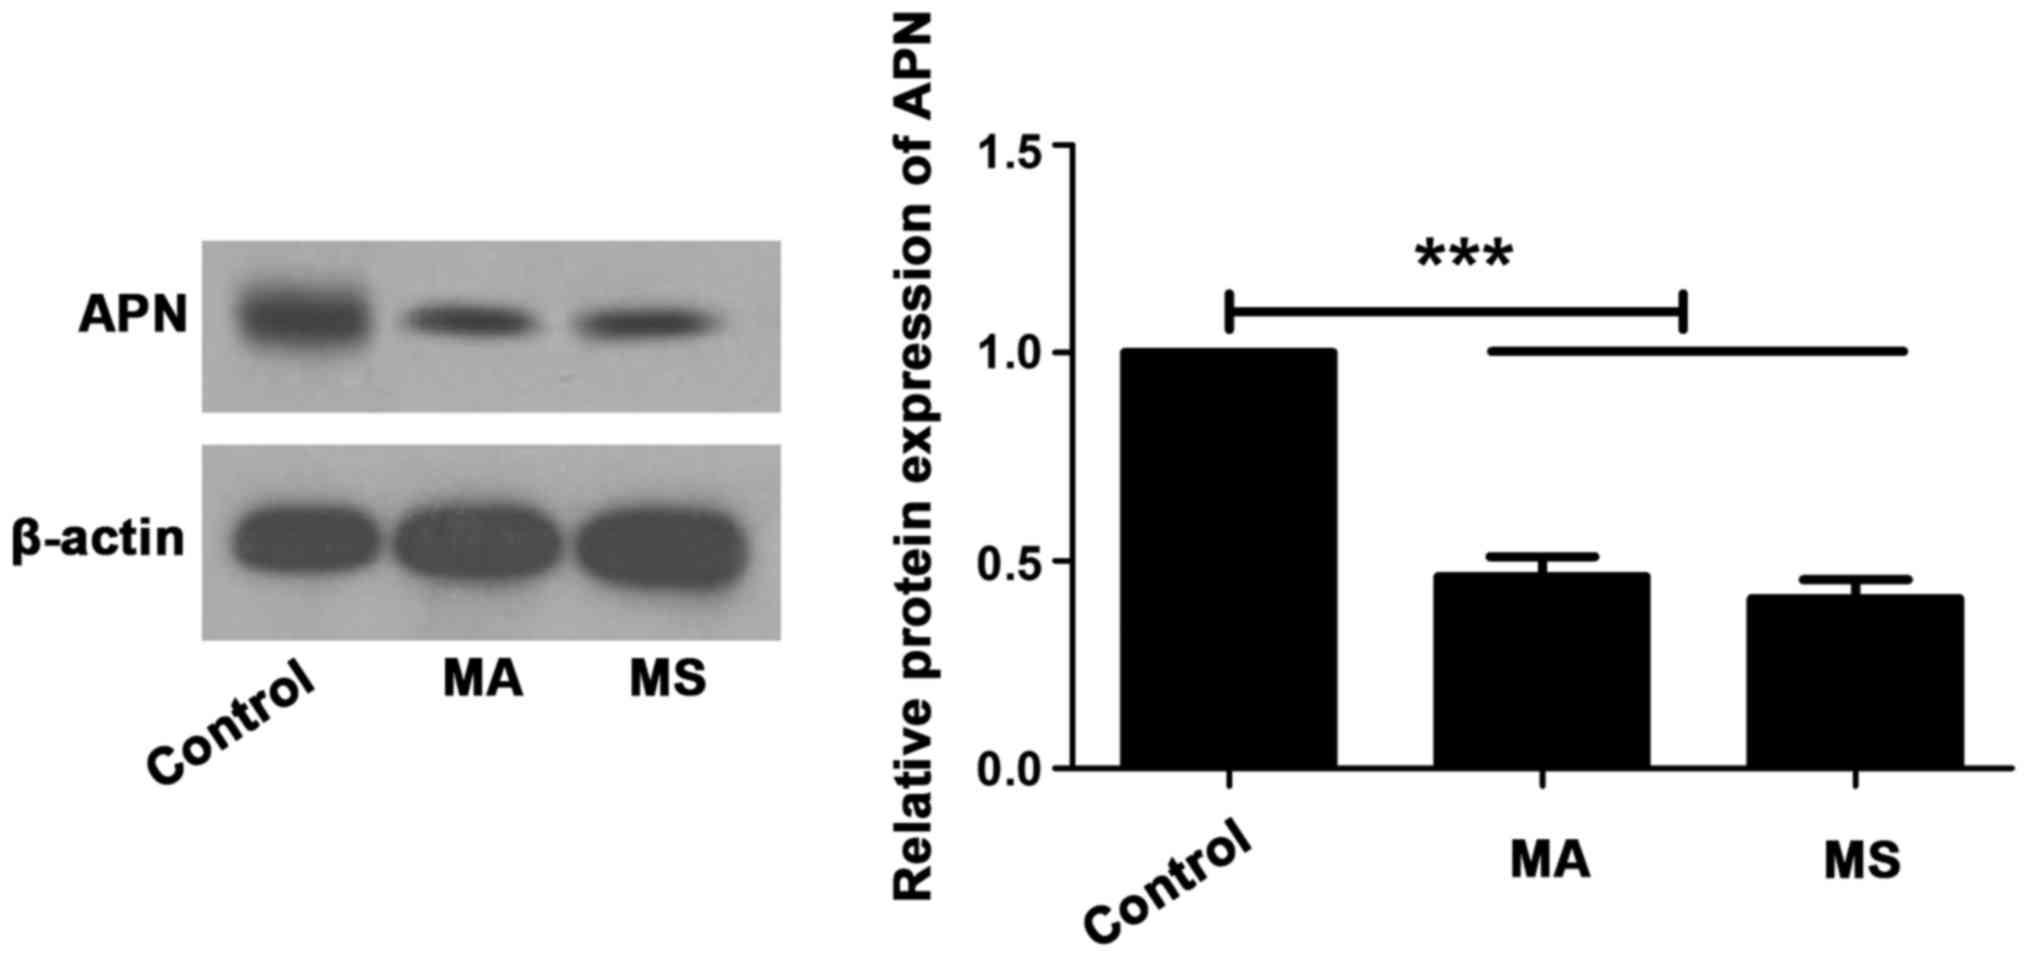
group (P<0.05). The serum APN and HDL levels of the MS group
were lower than those of the metabolic abnormality group. The HDL
level in the metabolic abnormality group was lower than that in the
control group (P<0.05), but there was no statistical
significance in the difference of serum APN between the two groups
(P>0.05) (Table I). Compared with
the control group, serum APN protein expression levels in the
metabolic abnormality group and the MS group were decreased
(Fig. 1).
 | Table I.Comparison of physical and baseline
clinical data between the three study groups. |
Table I.
Comparison of physical and baseline
clinical data between the three study groups.
| Detection items | Control group | Metabolic abnormality
group | MS group |
|---|
| BMI
(kg/m2) |
21.54±0.212 |
4.61±0.34a |
27.68±0.15a |
| Waist-to-hip
ratio |
0.78±0.06 |
0.87±0.03a |
0.95±0.04b |
| Abdominal fat area
(cm2) |
37.64±4.527 |
1.26±3.43b |
109.13±1.26a |
| Systolic blood
pressure (mmHg) |
113.56±1.2312 |
4.32±1.35a |
140.13±1.52b |
| Diastolic blood
pressure (mmHg) |
70.92±1.017 |
9.03±0.92a |
90.42±0.77b |
| Triglyceride
(mmol/l) |
1.10±0.04 |
1.52±0.06a |
2.42±0.03b |
| HDL (mmol/l) |
1.36±0.02 |
1.19±0.07b |
1.12±0.06a |
| Fasting blood glucose
(mmol/l) |
4.97±0.11 |
5.54±0.06a |
6.01±0.73a |
| Fasting insulin
(nmol/l) |
0.06±0.01 |
0.09±0.02b |
0.11±0.01b |
Gene rs121917815 polymorphic site
detection and allele frequency
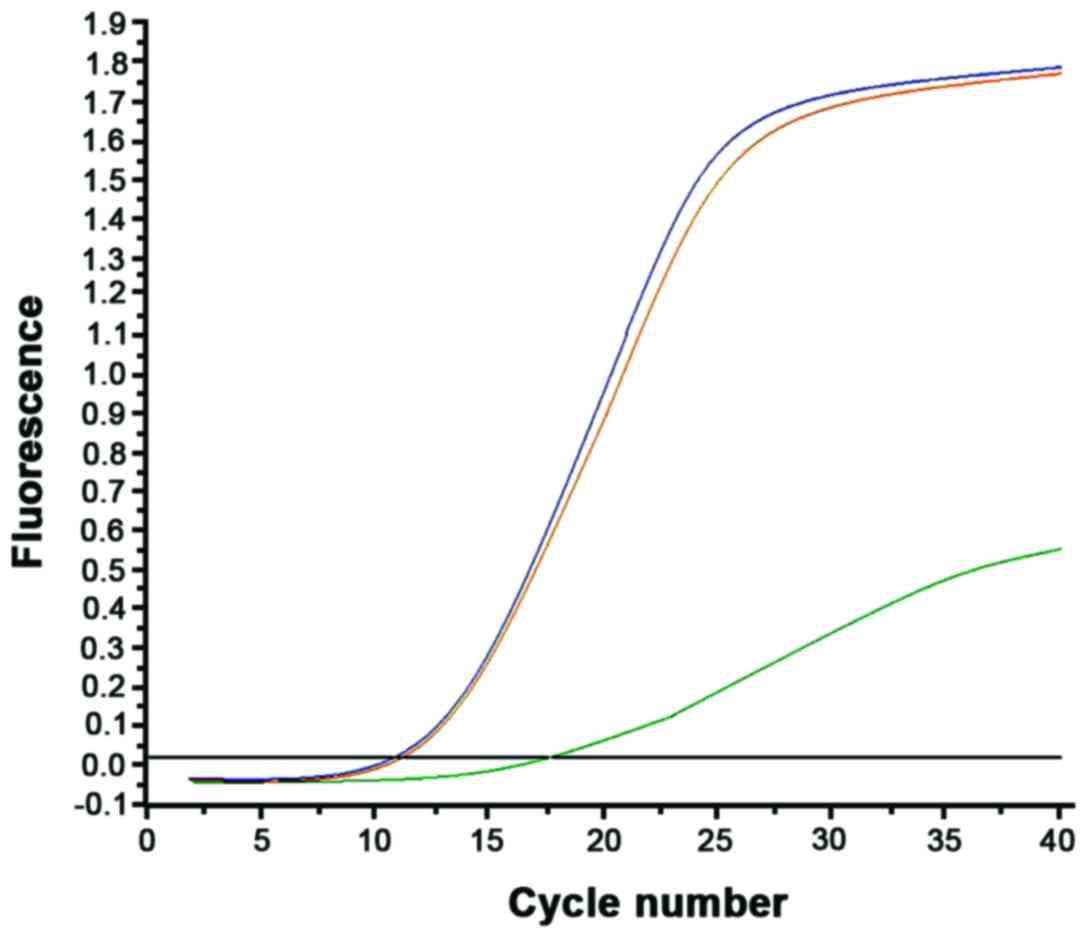
TaqMAN probe was inserted into the PCR product
containing the mutation sequence to detect the product containing
different alleles using different fluorescence, and to determine
the APN polymorphic site in the individual. The results are shown
in Fig. 2.
The TT, TC and CC genotype frequency and the T and C
allele probability were obtained by the statistical analysis of
polymorphic site rs121917815 genotype in the control group, the
metabolic abnormality group and the MS group (Table II). There was no significant
difference in the comparison of the three genotype and allele
frequencies between the control and metabolic abnormality groups
(P>0.05). The CC genotype and C allele frequencies in the MS
group were significantly increased. Compared with the control
group, TT genotype and T allele frequencies in the MS group were
significantly decreased, while the comparison of CT genotype
frequency between the two groups had no significant difference.
These data showed that the difference of the three genotypes and
two alleles in the MS and control groups was statistically
significant, showing 26.52 and 34.73 as the Chi-square test value,
with a statistically significant difference.
| Table II.rs121917815 genotype and allele
frequency. |
Table II.
rs121917815 genotype and allele
frequency.
|
| Genotype | Allele |
|---|
|
|
|
|
|---|
| Groups | Cases | TT | CT | CC | T | C |
|---|
| Control group | 114 | 37 (32.45%) | 36 (31.58%) | 41 (35.96%) | 110 (48.24%) | 118 (51.76%) |
| Metabolic abnormality
group | 122 | 42 (34.42%) | 37 (30.32%) | 43 (35.24%) | 120 (49.59%) | 123 (50.41%) |
| MS group | 142 | 32 (22.53%) | 42 (29.58%) | 68 (47.89%) | 106 (37.32%) | 178 (62.68%) |
| χ2 | 26.52 | 34.73 |
| P-value | <0.001 | <0.001 |
Relationship between APN gene
polymorphism and the incidence of MS
The distribution of rs121917815 genotypes and
alleles in patients with MS is shown in Table III. To estimate the relationship
between APN rs121917815 gene polymorphic site and the incidence of
MS, the risk of MS was expressed by the odds ratio (OR). The OR of
TT genotype was 0.60 (32×78/37×110), the OR of CT genotype was 0.91
(42×78/36×100), and the OR of CC genotype was 1.64 (68×73/41×74).
The OR of T allele was 0.56 (110×106/118×118), and the OR of C
allele was 1.71 (178× 110/106×108). The above results of OR
indicated that CC genotype and C allele significantly increased the
risk of MS.
| Table III.Distribution of rs121917815 genotypes
and alleles in patients with MS. |
Table III.
Distribution of rs121917815 genotypes
and alleles in patients with MS.
|
| Genotypes | Alleles |
|---|
|
|
|
|
|---|
| Groups | Cases | TT | TC | CC | T | C |
|---|
| Control group | 114 | 37 | 36 | 41 | 110 | 118 |
| Metabolic abnormality
group | 122 | 42 | 37 | 43 | 120 | 123 |
| MS group | 142 | 32 | 42 | 68 | 106 | 178 |
Relationship of
atherosclerosis-related indexes in patients with MS
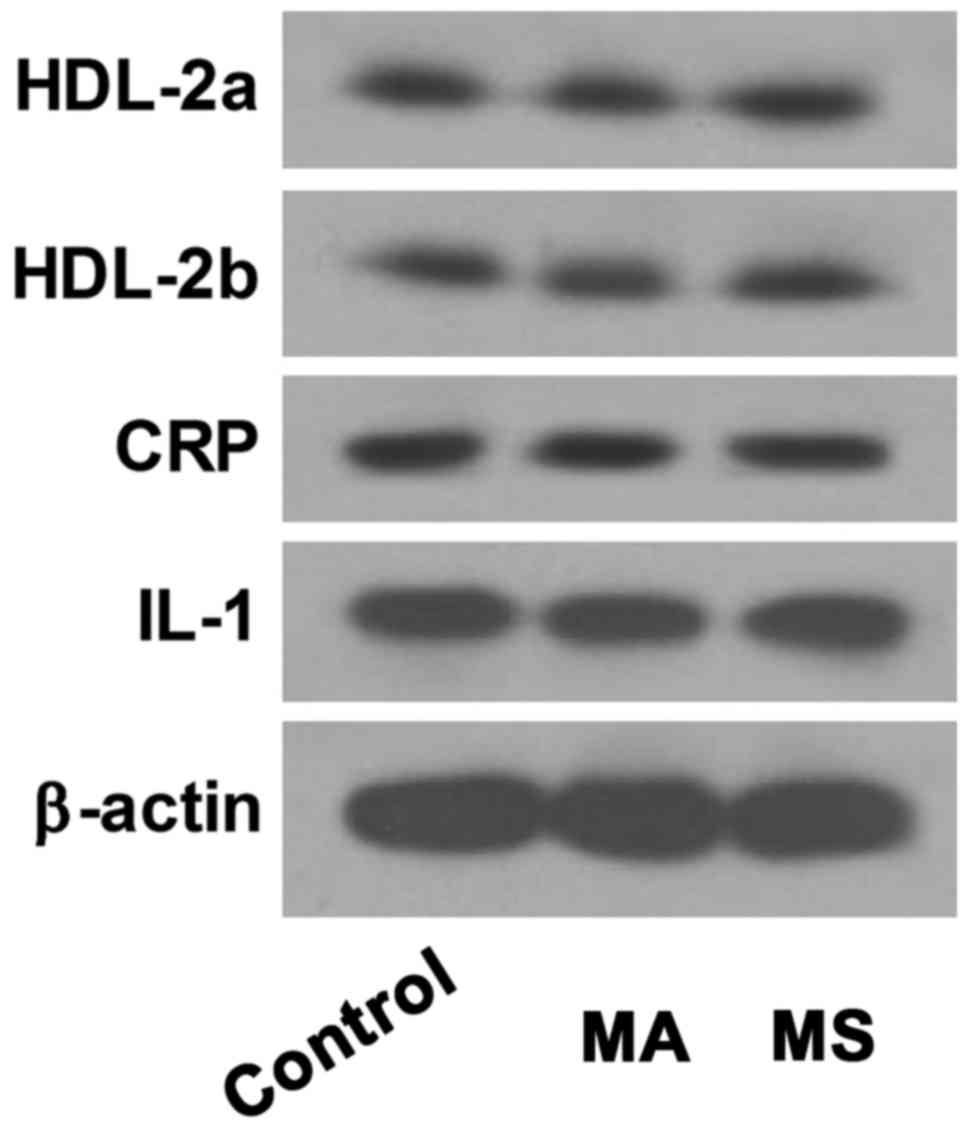
The expression level changes of CRP, IL-1, HDL-2a
and HDL-2b in the blood of the control group, the metabolic
abnormality group and the MS group were detected (Fig. 3), the total cholesterol and HDL of
different genotypes in the three groups were detected using the
MINDRAY biochemical automatic analyzer, and the AI values of the
three genotypes of patients were calculated (Table IV). The study found that there was
no statistical difference in the degree of atherosclerosis between
the MS group and the control group as well as the metabolic
abnormality group, which suggested that the rs121917815 polymorphic
site was not correlated with the degree of atherosclerosis.
| Table IV.Comparison of genotype AI value
between the MS and control groups. |
Table IV.
Comparison of genotype AI value
between the MS and control groups.
|
| Genotypes |
|---|
|
|
|
|---|
| Groups | TT | CT | CC |
|---|
| Control | 3.79±0.34 | 3.82±0.19 | 4.26±0.41 |
|
| (n=37) | (n=36) | (n=41) |
| MS | 3.82±0.42 | 3.77±0.29 | 4.36±0.14 |
|
| (n=32) | (n=42) | (n=38) |
Discussion
Metabolic syndrome is a comprehensive disease with
insulin resistance as its central link, which is manifested by
central obesity, hypertension, hyperglycemia and other diseases
caused by the metabolic abnormalities of glucose and lipid
(12). Previous findings have shown
that individuals aged more than 60 years are likely to suffer from
MS, showing serious condition (13).
However, data regarding the clinical description of early onset MS
patients and whether MS may cause other diseases are limited. In
this study, the patients with an approximate age of 55 years were
selected as the main research objects to investigate the possible
pathogenesis of early onset MS.
APN has been found to play an important role in
blood glucose and lipid metabolism which are regulated by insulin,
while it has been reported that APN multiple polymorphic sites also
account for a large proportion in the pathogenesis of MS (14,15).
Additionally, the rs121917815 gene polymorphic site can cause T2DM,
leading to severe clinical symptoms in patients (16). However, there is limited literature
available regarding whether there is a relationship between this
site and MS.
The origin of atherosclerosis is well known, mainly
due to the metabolic abnormalities of glucose and lipid, which is
similar to the pathological phenomenon caused by MS (17,18).
However, to the best of our knowledge, there is no report on the
relationship between early onset MS and atherosclerosis. In
patients with atherosclerosis, CRP and regulatory factor IL-1,
which have different degrees of increase, can be used as the
indexes of atherosclerosis. Additionally, combined with the
calculation of atherosclerosis index, the degree of atherosclerosis
in patients with MS may be evaluated by these methods (19).
Based on the above research background, this study
found that through the clinical data of patients with MS and
immunoblotting for serum APN protein expression, the grouping mode
and disease diagnosis were correct. In the analysis of the three
groups of APN SNP rs121917815 site genotypes, we found that CC
genotype frequency and C allele frequency in the MS group were
significantly increased. Compared with the control group, TT
genotype and T allele frequencies in the MS group were
significantly decreased, while the comparison of CT genotype
frequency between the two groups had no significant difference
concerning the clinical description, we found that more MS symptoms
appeared in this population, which indicated that C allele at
rs121917815 was the pathogenic factor of MS. At the same time, the
OR value of the three genotypes and two alleles suggested that the
occurrence of CC genotype and C allele in rs121917815 site could
increase the incidence of MS.
CRP and its regulatory factor IL-1 play an important
role in the evaluation of atherosclerosis, while the serum HDL-2a
and HDL-2b are also of significance in the process of
atherosclerosis (20). To the best
of our knowledge, for the first time, we found that there was no
distinct change of CRP, IL-1, HDL-2a and HDL-2b in the patients
with C allele in the MS group, while the difference was not
statistically significant in the comparison of the AI between the
MS and control groups as well as the metabolic abnormality group.
There was no direct correlation between rs121917815 and
atherosclerosis in cardiovascular disease.
In conclusion, APN rs121917815 gene polymorphic site
is associated with the early MS and could increase the risk of MS,
but the difference is not statistically significant in
atherosclerosis-related indexes in MS patients with rs121917815
polymorphic site, which indicates that APN rs121917815 polymorphic
site is related to MS, but it is not directly involved in the
aggravation of atherosclerosis. This study has provided a
theoretical basis for the pathogenesis of MS and atherosclerosis,
which may be conducive to seek a particular approach for clinical
treatment.
Acknowledgements
The present study was supported by the Hebei
Province Science and Technology Plan (no. 15277794D).
References
|
1
|
Alberti KGM, Zimmet P and Shaw J: IDF
Epidemiology Task Force Consensus Group: The metabolic syndrome - a
new worldwide definition. Lancet. 366:1059–1062. 2005. View Article : Google Scholar : PubMed/NCBI
|
|
2
|
Gastrich MD, Lasser NL, Wien M and
Bachmann G: Dietary complex carbohydrates and low glycemic
index/load decrease levels of specific metabolic
syndrome/cardiovascular disease risk factors. Top Clin Nutr.
23:76–96. 2008. View Article : Google Scholar
|
|
3
|
Kim B and Feldman EL: Insulin resistance
as a key link for the increased risk of cognitive impairment in the
metabolic syndrome. Exp Mol Med. 47:e1492015. View Article : Google Scholar : PubMed/NCBI
|
|
4
|
Yamauchi T, Kamon J, Minokoshi Y, Ito Y,
Waki H, Uchida S, Yamashita S, Noda M, Kita S, Ueki K, et al:
Adiponectin stimulates glucose utilization and fatty-acid oxidation
by activating AMP-activated protein kinase. Nat Med. 8:1288–1295.
2002. View Article : Google Scholar : PubMed/NCBI
|
|
5
|
Kadowaki T, Yamauchi T, Kubota N, Hara K,
Ueki K and Tobe K: Adiponectin and adiponectin receptors in insulin
resistance, diabetes, and the metabolic syndrome. J Clin Invest.
116:1784–1792. 2006. View
Article : Google Scholar : PubMed/NCBI
|
|
6
|
Lee S and Kwak HB: Role of adiponectin in
metabolic and cardiovascular disease. J Exerc Rehabil. 10:54–59.
2014. View Article : Google Scholar : PubMed/NCBI
|
|
7
|
Nigro E, Scudiero O, Monaco ML, Palmieri
A, Mazzarella G, Costagliola C, Bianco A and Daniele A: New insight
into adiponectin role in obesity and obesity-related diseases.
Biomed Res Int. 2014:6589132014.https://doi.org/10.1155/2014/658913 View Article : Google Scholar : PubMed/NCBI
|
|
8
|
Fu Y: Adiponectin signaling and metabolic
syndrome. Prog Mol Biol Transl Sci. 121:293–319. 2014. View Article : Google Scholar : PubMed/NCBI
|
|
9
|
Bouatia-Naji N, Meyre D, Lobbens S, Séron
K, Fumeron F, Balkau B, Heude B, Jouret B, Scherer PE, Dina C, et
al: ACDC/adiponectin polymorphisms are associated with severe
childhood and adult obesity. Diabetes. 55:545–550. 2006. View Article : Google Scholar : PubMed/NCBI
|
|
10
|
Al-Daghri NM, Al-Attas OS, Alokail MS,
Alkharfy KM, Hussain T, Yakout S, Vinodson B and Sabico S:
Adiponectin gene polymorphisms (T45G and G276T), adiponectin levels
and risk for metabolic diseases in an Arab population. Gene.
493:142–147. 2012. View Article : Google Scholar : PubMed/NCBI
|
|
11
|
Cai X, Gan Y, Fan Y, Hu J, Jin Y, Chen F,
Chen T, Sun Y, Wang J, Qin W, et al: The adiponectin gene
single-nucleotide polymorphism rs1501299 is associated with
hepatocellular carcinoma risk. Clin Transl Oncol. 16:166–172. 2014.
View Article : Google Scholar : PubMed/NCBI
|
|
12
|
Samson SL and Garber AJ: Metabolic
syndrome. Endocrinol Metab Clin North Am. 43:1–23. 2014. View Article : Google Scholar : PubMed/NCBI
|
|
13
|
Yesil A and Yilmaz Y: Review article:
Coffee consumption, the metabolic syndrome and non-alcoholic fatty
liver disease. Aliment Pharmacol Ther. 38:1038–1044. 2013.
View Article : Google Scholar : PubMed/NCBI
|
|
14
|
Stumvoll M, Tschritter O, Fritsche A,
Staiger H, Renn W, Weisser M, Machicao F and Häring H: Association
of the T-G polymorphism in adiponectin (exon 2) with obesity and
insulin sensitivity: Interaction with family history of type 2
diabetes. Diabetes. 51:37–41. 2002. View Article : Google Scholar : PubMed/NCBI
|
|
15
|
Fredriksson J, Carlsson E, Orho-Melander
M, Groop L and Ridderstråle M: A polymorphism in the adiponectin
gene influences adiponectin expression levels in visceral fat in
obese subjects. Int J Obes. 30:226–232. 2006. View Article : Google Scholar
|
|
16
|
Zietz B, Buechler C, Kobuch K, Neumeier M,
Schölmerich J and Schäffler A: Serum levels of adiponectin are
associated with diabetic retinopathy and with adiponectin gene
mutations in Caucasian patients with diabetes mellitus type 2. Exp
Clin Endocrinol Diabetes. 116:532–536. 2008. View Article : Google Scholar : PubMed/NCBI
|
|
17
|
Hutter N, Baena M, Sangüesa G, Dávalos A,
Latasa MJ, Escolà-Gil JC, Sánchez RM, Roglans N, Alegret M and
Laguna JC: Liquid fructose supplementation in LDL-R−/−
mice fed a western-type diet enhances lipid burden and
atherosclerosis despite identical calorie consumption. Int J
Cardiol. 9:12–21. 2015.
|
|
18
|
Shih DM, Wang Z, Lee R, Meng Y, Che N,
Charugundla S, Qi H, Wu J, Pan C, Brown JM, et al: Flavin
containing monooxygenase 3 exerts broad effects on glucose and
lipid metabolism and atherosclerosis. J Lipid Res. 56:22–37. 2015.
View Article : Google Scholar : PubMed/NCBI
|
|
19
|
Rudolf J and Lewandrowski KB: Cholesterol,
lipoproteins, high-sensitivity c-reactive protein, and other risk
factors for atherosclerosis. Clin Lab Med. 34(113–127): vii.
2014.PubMed/NCBI
|
|
20
|
Parhofer KG: Increasing HDL-cholesterol
and prevention of atherosclerosis: A critical perspective.
Atheroscler Suppl. 18:109–111. 2015. View Article : Google Scholar : PubMed/NCBI
|