Introduction
The obesity epidemic has become a major public
health crisis, contributing to an upsurge in cases of hypertension,
coronary heart disease and diabetes (1). Obesity, defined as the excess
accumulation of white adipose tissue (WAT), develops when energy
intake exceeds expenditure (2).
Weight reduction and increased physical activity are recommended as
the most effective treatments for obesity; however, in many cases
these lifestyle changes are not sustained in the long-term
(3). Additionally, many anti-obesity
drugs have been linked with adverse side effects and consequently
withdrawn from the market, such as 2,4-dinitrophenol (2,4-DNP)
(4).
Mammalian adipose tissue is comprised predominantly
of WAT, with a proportionally smaller amount of brown adipose
tissue (BAT) (5). WAT is the primary
site of energy storage and contains a single large lipid droplet
and a small number of mitochondriathat store excess energy in the
form of triglycerides (5). WAT also
secretes a variety of cytokines and hormones that regulate energy
metabolism and insulin resistance (6). By contrast, BAT, which was determined
to serve a role in adult human metabolism in 2009 (7–11),
contains many small lipid droplets and a much higher number of
mitochondria (6,12). BAT expresses uncoupling protein 1
(UCP1), which localizes on the inner mitochondrial membrane and
uncouples the activity of the respiratory chain from adenosine
triphosphate (ATP) synthesis, thereby releasing energy as heat via
the process of thermogenesis (12,13).
Recent findings have indicated that UCP2 also has an important role
in mediated energy metabolism as UCP1 (14). This heat production process means
that BAT effectively accelerates fat metabolism when stimulated. A
study in humans by Rothwell and Stock (15) estimated that as little as 50 g
maximally stimulated BAT could account for up to 20% of the daily
energy expenditure of an individual. The exploitation of BAT has
been proposed as a potential method of combatting obesity (7) and a growing body of evidence suggests
that BAT recruitment (16–20) or BAT transplantation (19,20) may
be effective at decreasing body mass and improving energy
metabolism.
G protein-coupled bile acid receptor 1 (TGR5), a G
protein-coupled receptor highly expressed in the mitochondria of
BAT, serves a key function in regulating glycometabolism (21). Bile acids, a family of steroid
molecules generated in the liver by cholesterol oxidation,
solubilize dietary lipids and promote their absorption in the
digestive tract, as well as induce energy expenditure by promoting
the activation of intracellular thyroid hormone (22). The primary bile acids cholic acid
(CA) and chenodeoxycholic acid (CDCA), and the secondary bile acids
deoxycholic acid (DCA) and lithocholic acid (LCA), as well as
oleanolic acid (OA), all act as signaling molecules and are natural
ligands of TGR5 and farnesoid X receptor (FXR) (23–25). The
bile acid-regulated receptor TGR5 downregulates ATP synthesis by
activating cyclic adenosine monophosphate (cAMP). Increased levels
of intracellular cAMP activate protein kinase A (PKA), which in
turn phosphorylates cAMP response element binding protein (CREB),
which transactivates target genes, including the Dio2 gene
that encodes the enzyme 2-iodothyronine deiodinase (D2) (26). Bile acid-mediated induction of D2 has
been detected in human skeletal muscle and murine BAT, the only
tissues that co-express TGR5 and D2 (27). D2 promotes intracellular thyroid
hormone activation by converting thyroxine to triiodothyronine
(T3), which upregulates UCP expression, effectively decreasing ATP
synthesis (energy expenditure) by dissipating the proton gradient
generated by the electron transport chain (23). Thus, the bile
acid-TGR5-cAMP-D2-T3-UCP pathway may serve a key function in
regulating energy homeostasis and reducing body mass.
Another cellular receptor that serves an important
role in regulating glycometabolism is the nuclear hormone receptor
peroxisome proliferator-activated receptor γ (PPARγ). It has been
demonstrated that the transcription factor PPARγ is essential for
adipogenesis, coordinating the expression of hundreds of genes
responsible for the development of mature adipocytes (28). Numerous growth factors that inhibit
fat cell differentiation mediate the phosphorylation of PPARγ via
mitogen-activated protein kinase and downregulate its
transcriptional activity (29).
In the present study, a diet-induced obesity mouse
model was used to assess the ability of bile acid ligands to reduce
obesity induced by a high-fat diet and improve glucose tolerance.
Immunohistochemical staining, reverse transcription-quantitative
polymerase chain reaction (RT-qPCR), western blotting and ELISA
assays were performed to analyze the effects of these ligands on
body weight, glucose tolerance, serum insulin levels, hepatic fat
tissue and the expression of cAMP, UCP2 and D2 in mouse fat tissue.
The results of the current study suggest that TGR5 serves a key
function in modulating high-fat diet-induced obesity.
Materials and methods
Reagents
CDCA was purchased from Sigma-Aldrich; Merck KGaA
(Darmstadt, Germany). Hematoxylin and eosin (H&E) and the serum
insulin detection ELISA kit (cat. no. CSB-E05071m) were purchased
from Roche Diagnostics (Indianapolis, IN, USA). All other reagents
were purchased from Sigma-Aldrich; Merck KGaA.
Alimentary obesity rodent model and
drug treatment procedure
A total of 15C57BL/6 wild-type male mice (age, 6
weeks; weight, 15–20 g) were purchased from the Model Animal
Research Center of Nanjing University (MARC, Nanjing, China) were
maintained in the Animal Resource Facility of the Animal Experiment
Center at Fujian Medical University (Fuzhou, China). The mice were
housed in a temperature-, humidity and light-controlled environment
(25°C; 5.6%; 12-h light/dark cycle). For alimentary-induced obesity
rodent models, mice in the high-fat diet (HF) group (n=10) were
gavaged with high-lipid food (carbohydrate, 40%; protein, 13%; fat,
40%; other, 7%) and mice in the normal food diet (NF) group (n=5),
which acted as the control, were fed with standard rodent chow
(carbohydrate, 60%; protein, 22%; fat, 10%; other, 8%). Food and
water were supplied ad libitum. After 10 weeks, 5 mice from
the HF group were gavaged with CDCA (5 g/kg) to form the HF+CDCA
group (n=5). All mice were fed for a further 10 weeks and mice were
weighed each week. All animals were treated in accordance with the
Guide for the Care and Use of Laboratory Animals and all
experiments were approved and performed according to the guidelines
of the Ethics Committee of The Union Hospital of Fujian Medical
University (Fuzhou, China).
Cell culture
3T3-L1 cells were obtained from Procell Life Science
Co., Ltd. (Wuhan, China). 3T3-L1 preadipocytes were cultured in
medium A (Dulbecco's modified Eagle's medium; Sigma-Aldrich; Merck
KGaA; supplemented with 15% fetal bovine serum; Sigma-Aldrich;
Merck KGaA) at 37°C in an atmosphere containing 5% CO2.
A total of 2 days after confluence was reached, cells were
differentiated into adipocytes following the addition of
differentiation medium (medium A containing 0.5 mM
3-isobuthyl-1-methylxantine, 1 mM dexamethasone, 10 mg/ml insulin
and 5 mM pioglitazone hydrochloride) in the presence or absence of
5 µg/ml CDCA (day 0). After 2 days, the 3T3-L1 cells were
transferred to adipocyte-growing medium (medium A containing 5
mg/ml insulin and 5 mM pioglitazone hydrochloride) in the presence
or absence of 5 µg/ml CDCA, which was replenished every 2 days.
Dimethyl sulfoxide was used as the vehicle control for the test
compounds. On day 8, the differentiated adipocytes were stained
with oil red O at room temperature for 10 min and photographed at
×40 magnification using an SP350 digital camera (Olympus
Corporation, Tokyo, Japan) and optical microscope (Olympus BX51;
Olympus Corporation).
Glucose tolerance test and serum
insulin detection assay
To test the effect of different ligands on blood
glucose metabolism, mice from each group that had been gavage for
20 weeks were administered with an intraperitoneal injection of
glucose (2 g/kg). A micro blood glucose instrument (Ningbo
Kingkerry Medical Instrument Co., Ltd., Ningbo, China) was used to
monitor the changes in blood sugar between 0 and 120 min. Serum
insulin levels were measured using an ELISA kit. A total of 20 µl
serum was obtained at 0 and 120 min after intraperitoneal injection
of glucose and processed via centrifuging 200 µl whole mouse blood
obtained from the tail vein at 2,000 × g at 4°C for 10 min as
described previously (29).
Immunohistochemical staining
All mice were humanely euthanized with
CO2 gas following 20 weeks treatment with the drug and
gavage. Livers were harvested and a tissue sample from the right
lobe of each liver was fixed in 4% PBS-buffered paraformalin at
room temperature for 24 h. Livers were prepared as either paraffin
sections or frozen sections and stained with H&E or oil red O,
as described previously (30,31).
RT-qPCR analysis of factors involved
in fatty acid synthesis and fat metabolism
Total RNA was prepared from the tissue samples using
TRI reagent (Molecular Research Center, Inc., Cincinnati, OH, USA).
First-strand cDNA was synthesized from the total RNA using Moloney
Murine Leukemia Virus reverse transcriptase (Invitrogen; Thermo
Fisher Scientific, Inc., Waltham, MA, USA). Gene expression of
cAMP, UCP2 and D2 was quantified by qPCR using an Applied
Biosystems 7300 Real-Time PCR system (Applied Biosystems; Thermo
Fisher Scientific, Inc.). The 20 ml reaction mixture contained 7.0
ml nuclease-free water, 1.0 ml cDNA (1 mg/ml), 1.0 ml (10 mM) each
primer and 10.0 ml Maxima SYBR-Green/ROX qPCR Master Mix (2X)
(Thermo Fisher Scientific, Inc.) and underwent the following
thermocycling conditions: 95°C for 10 sec followed by 40 cycles of
94°C for 15 sec, annealing at 55°C for 30 sec, and a final
extension at 70°C for 30 sec. The data was determined using default
threshold settings and the mean Cq was calculated from the
quintuplicate PCRs. The ratio of mRNA was calculated by using the
equation 2−ΔCq, in which
ΔCq=Cqtreatment-Cqcontrol (14). The sequences of specific forward and
reverse primers are presented in Table
I. The quantity of mRNA was normalized to an internal standard,
mouse β-actin.
 | Table I.Primers used in the present
study. |
Table I.
Primers used in the present
study.
| Gene name | Forward primer | Reverse primer |
|---|
| cAMP |
5′-TATCACTGCTGCTGCTACTG-3′ |
5′-GCGGAGAAGTCCAGCCAGCC-3′ |
| Ucp2 |
5′-GTGGTGGTCGGAGATACCAGA-3′ |
5′-GGGCAACATTGGGAGAAGTCC-3′ |
| D2 |
5′-AGGACTGGAAGGGGTGATCC-3′ |
5′-CCGACCTGGACCTCAAAGC-3′ |
| β-actin |
5′-GGCTGTATTCCCCTCCATCG-3′ |
5′-CCAGTTGGTAACAATGCCATGT-3′ |
Western blot analysis
Samples from 3T3-L1 cells lysates were isolated
using radioimmunoprecipitation assay lysis buffer (Santa Cruz
Biotechnology, Inc., Santa Cruz, CA, USA). Protein concentration
was determined using the bicinchoninic acid protein assay.
Subsequently, 60 µg/ml protein were subjected to 10% SDS-PAGE and
transferred to a polyvinylidenedifluoride membrane. Membranes were
blocked with TBST containing 5% non-fat dry milk in Tris-buffered
saline containing 0.1% Tween-20, and incubated at 4°C overnight.
Subsequently membranes were incubated with goat monoclonal
anti-mouse PPARγ (1:1,000; sc-22020 P; Santa Cruz Biotechnology,
Inc.), β-actin (1:5,000; sc-58673; Santa Cruz Biotechnology, Inc.).
β-actin was used as an internal control for protein loading. The
membrane was further incubated with horseradish
peroxidase-conjugated goat anti-mouse IgG (1:5,000; sc-34665; Santa
Cruz Biotechnology, Inc.) for 1 h at room temperature. Membranes
visualized using the enhanced chemiluminescence system.
Densitometric analysis was performed using Scion Image 3.0 software
(Scion Corporation, Frederick, MD, USA).
Statistical analysis
All data are presented as the mean ± standard error
of the mean. The two-tailed Student's t-test was used to evaluate
differences between data groups using GraphPad Prism 5.0 software
(GraphPad Software, Inc., La Jolla, CA, USA). P<0.05 was
considered to indicate a statistically significant difference.
Results
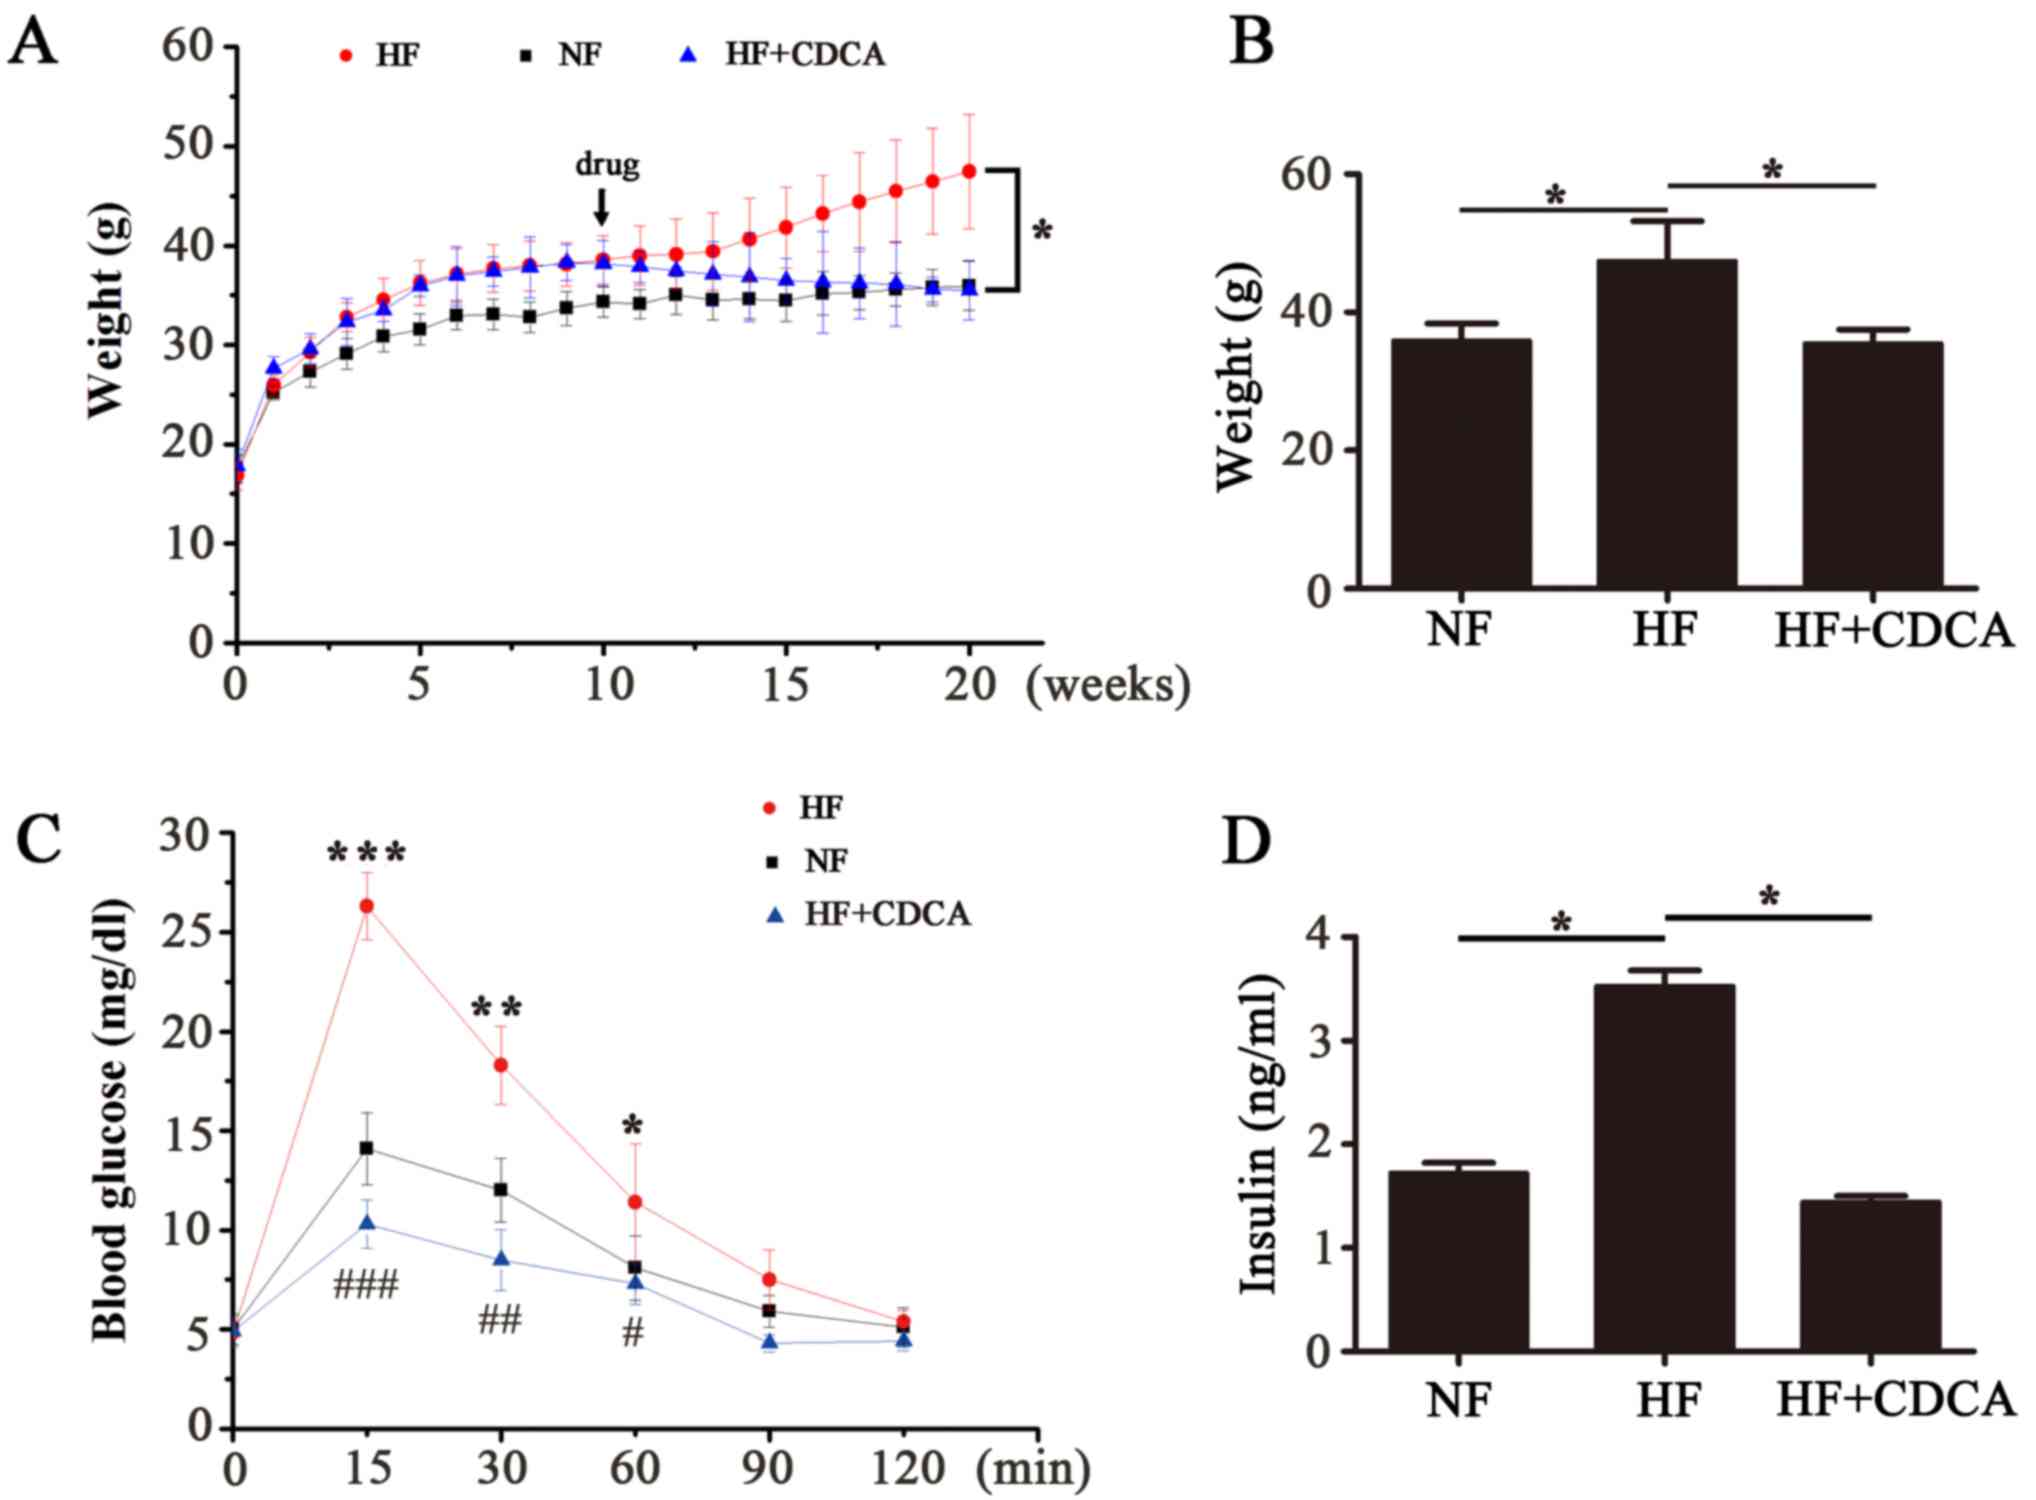
Effect of CDCA on mouse body
weight
To analyze the effect of different ligands on fat
accumulation in mice fed a high-fat diet, a 20-week feeding program
was followed. Mice were fed an NF or HF diet for 10 weeks, then
some of the HF mice were treated with CDCA (5 g/kg) and feeding was
continued for all mice for another 10 weeks. The body weights of
the mice were measured each week for 20 weeks (Fig. 1A). After the 20-week feeding period
the body weights of the mice in each group were compared (Fig. 1B). The results indicated that there
was a significant decrease in the body weight of mice in the
HF+CDCA group compared with those fed an HF diet alone (P<0.05).
These results suggest that treatment with CDCA, a natural TGR5
ligand, decreases fat accumulation.
Effect of TGR5 ligands on glucose
tolerance and serum insulin levels
After 20 weeks feeding, the mice received an
intraperitoneal injection with glucose (2 g/kg). Subsequently,
blood glucose levels were monitored over a 120-min period to
determine glucose tolerance (Fig.
1C). The results indicated that there was a significant
decrease in blood glucose levels in mice fed an HF+CDCA diet
compared with those fed an HF diet alone (P<0.001 at 15 min;
P<0.01 at 30 min; P<0.05 at 60 min). This indicates that CDCA
treatment improves glucose tolerance.
Serum insulin levels were determined using ELISA
(Fig. 1D). Insulin levels in the
serum of mice in the HF+CDCA group were significantly lower than
those in the HF group (P<0.05). This indicates that CDCA
protects against hyperinsulinemia induced by a high-fat diet.
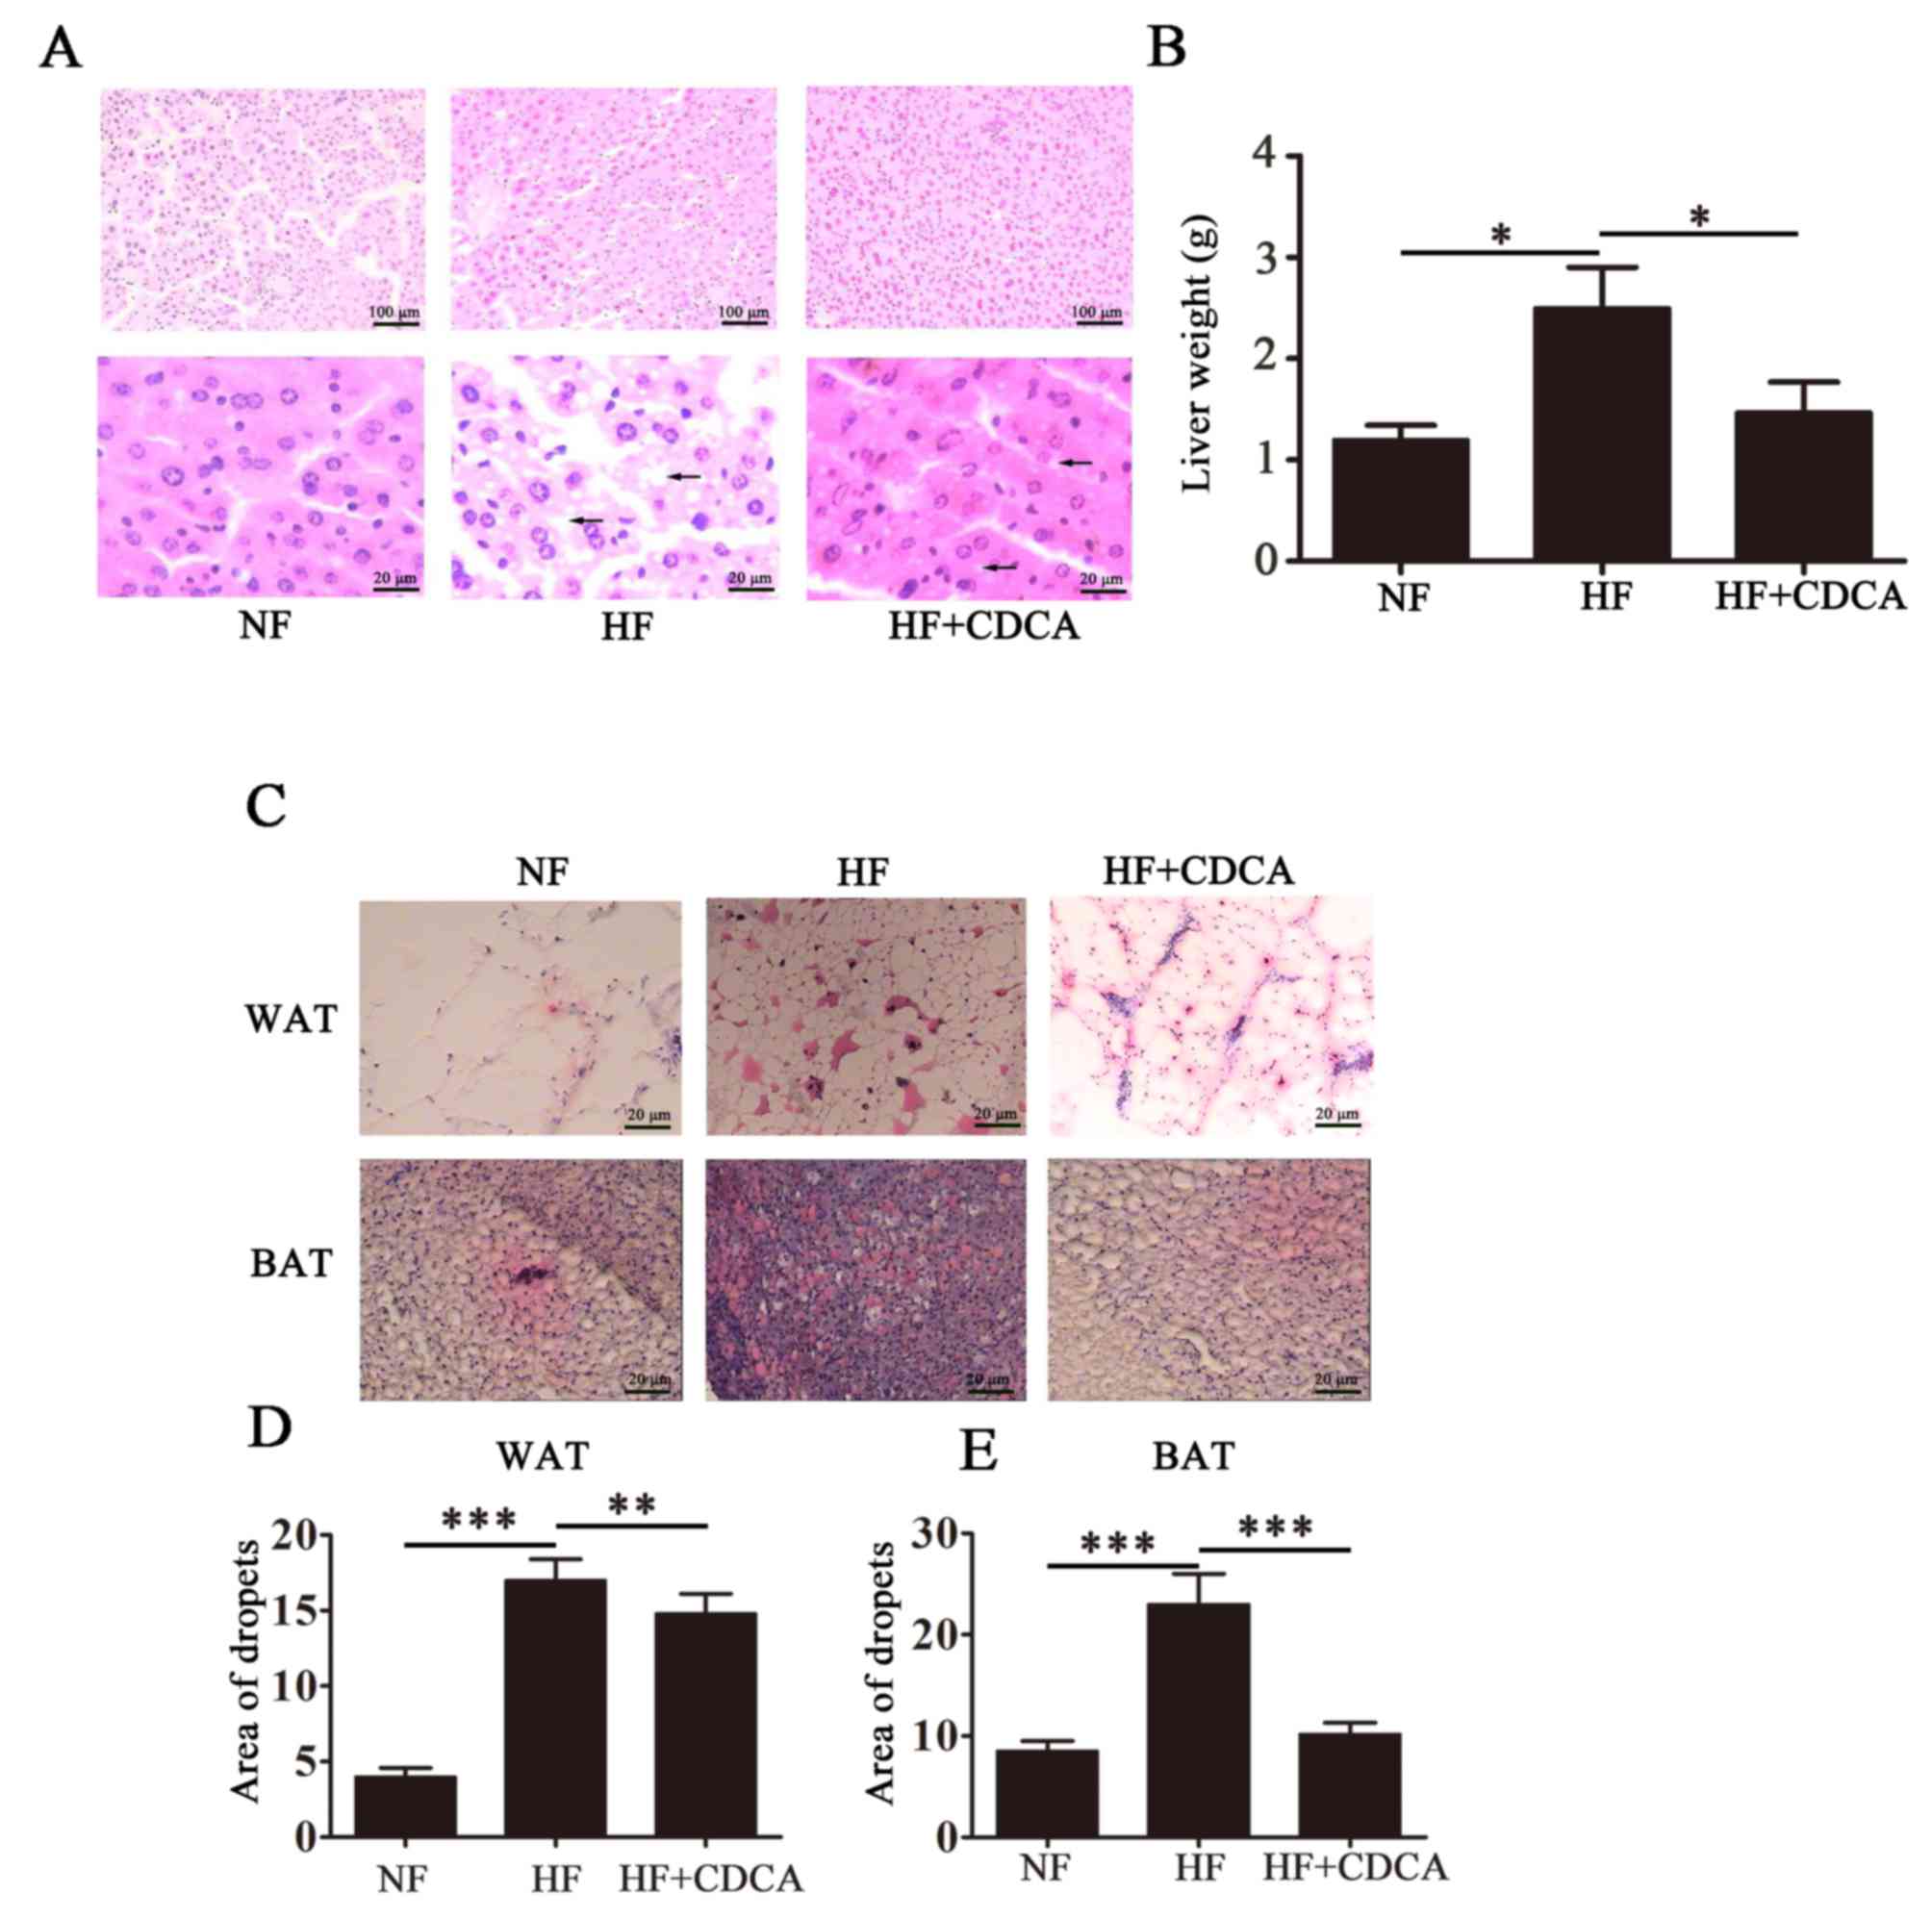
Effect of TGR5 ligands on hepatic fat
deposition
To analyze fat deposition in the livers of the mice,
liver sections taken from mice euthanized after 20 weeks feeding
were stained with H&E and representative images are presented
in Fig. 2A. As expected, the HF diet
promoted the accumulation of fat particles, as indicated by black
arrows on the images. This phenomenon was reversed following
treatment with CDCA. Liver weight analysis indicated that treatment
with CDCA significantly reversed the HF diet-induced hepatic fat
deposition observed in mice fed a HF diet alone (P<0.05;
Fig. 2B). Treatment with CDCA
resulted in liver weight similar to that of mice fed a NF diet.
These findings indicate that CDCA is able to downregulate the
hepatic fat deposition that occurs in response to a HF diet.
Effect of TGR5 ligands on fat
accumulation
To determine the effect of TGR5 ligand treatmenton
fat accumulation, WAT and BAT from liver sections taken from mice
after 20 weeks of feeding were separated and lipid droplets were
detected by oil red O staining. Representative images of liver
sections from the different treatment groups (n=10) are presented
in Fig. 2C. The relative lipid
content was quantified (Fig. 2D and
E) and the results indicated that for WAT, CDCA treatment
significantly reduced lipid deposition compared with untreated mice
on the HF diet (P<0.01). Furthermore, for BAT, treatment with
CDCA significantly reduced lipid deposition compared with untreated
mice on the HF diet (P<0.001). These findings indicate that CDCA
may inhibit fat accumulation induced by a HF diet.
Effect of CDCA on fatty acid synthesis
and fat metabolism
To determine the effect of the TGR5 ligand CDCA at
the molecular level, the mRNA levels of the oxidation-related
factors UCP2, D2 and cAMP in the WAT and BAT of mice were measured
by RT-qPCR (Fig. 3). The results
demonstrated that CDCA treatment significantly promoted the
activation of fatty acid oxidation-related factors in BAT
(P<0.001). In WAT, drug treatment did not promote the activation
of fatty acid oxidation-related factors. Thus, it was demonstrated
that the activity of the bile acid-TGR5-cAMP-D2-T3-UCP signal in
BAT (but not in WAT) contributes to a reduction in adiposity. These
findings suggest that the genes involved in the regulation of
energy expenditure are upregulated following ligand binding by bile
acids in BAT.
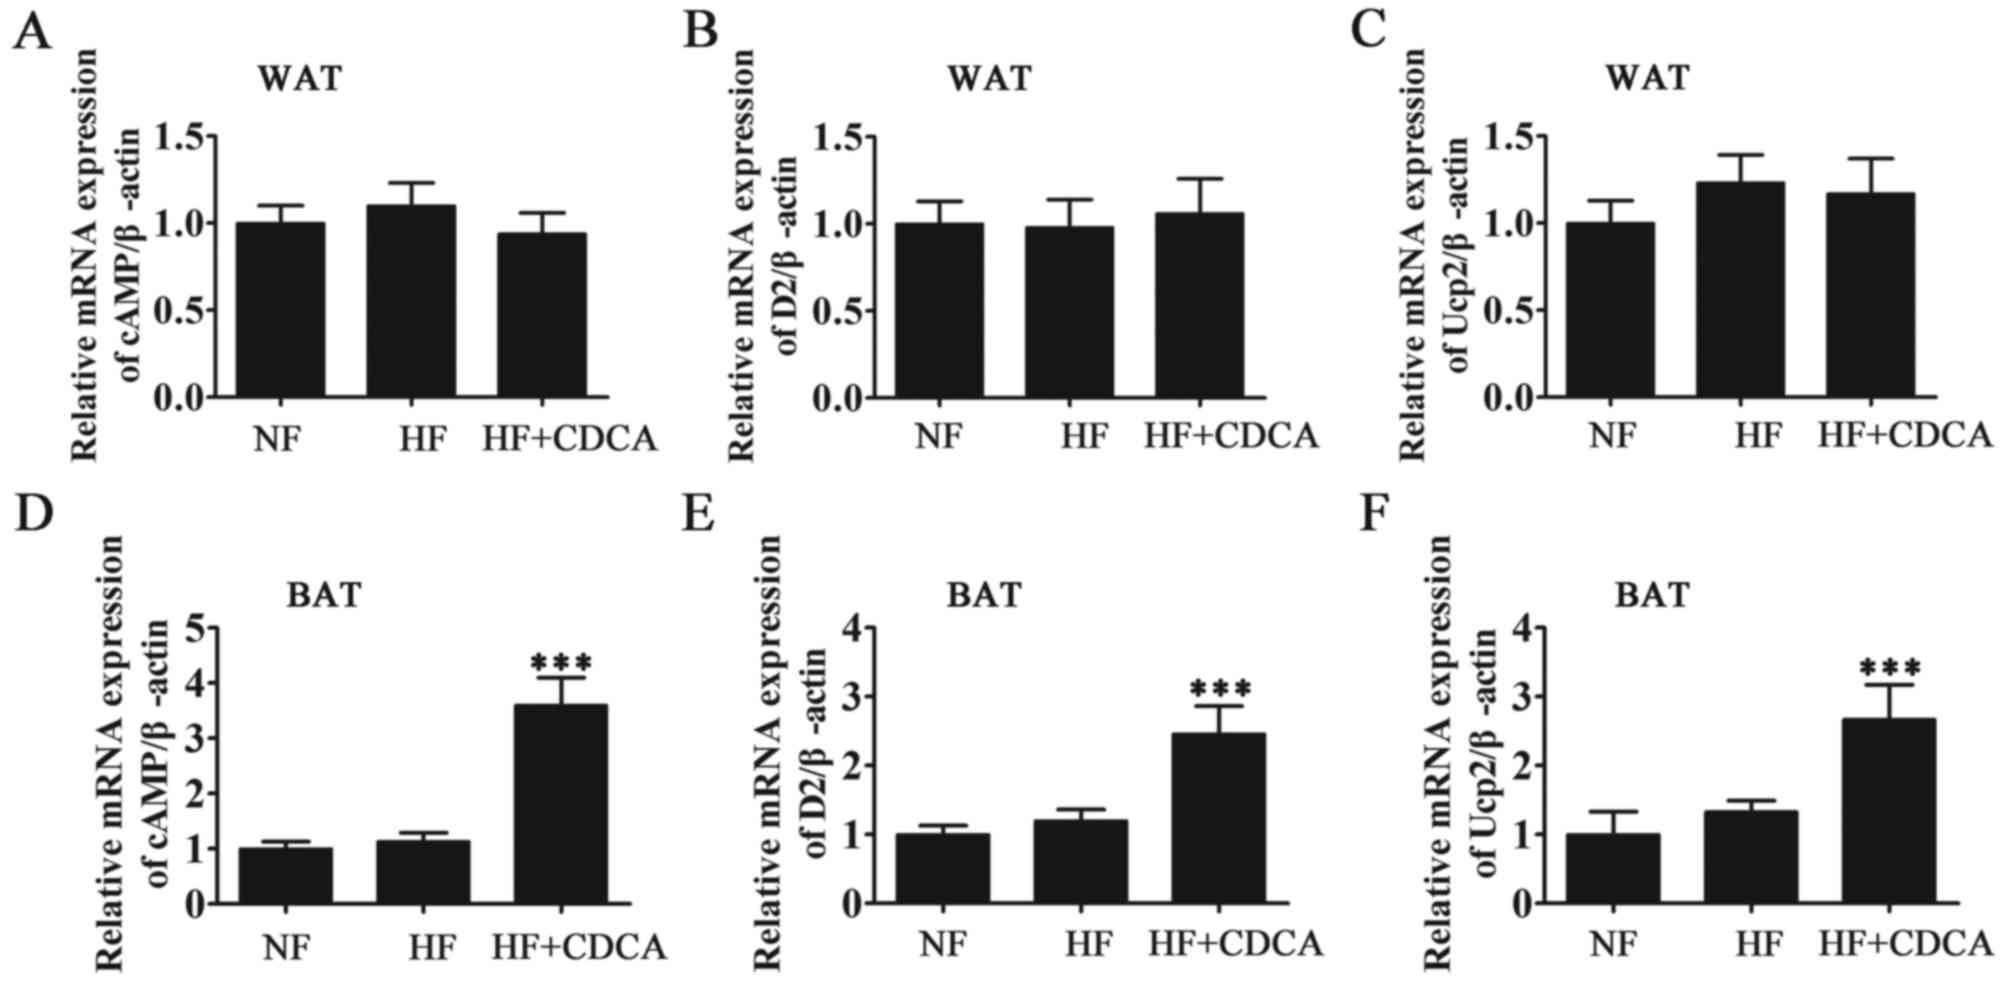 | Figure 3.RT-qPCR analysis of oxidation-related
factors (D2 activation system) from WAT and BAT. The mRNA levels of
fatty acid synthesis and oxidation-related factors cAMP, D2 and
UCP2 from (A-C) WAT and (D-F) BAT were measured by RT-qPCR.
Expression was measured relative to β-actin. Results are presented
as mean ± standard error of the mean (n=5). ***P<0.001 vs. NF.
NF, normal food diet; HF, high-fat diet; CDCA, chenodeoxyclic acid;
WAT, white adipose tissue; BAT, brown adipose tissue; cAMP, cyclic
adenosine monophosphate; D2, 2-iodothyronine deiodinase; UCP2,
uncoupled protein 2; RT-qPCR, reverse transcription-quantitative
polymerase chain reaction. |
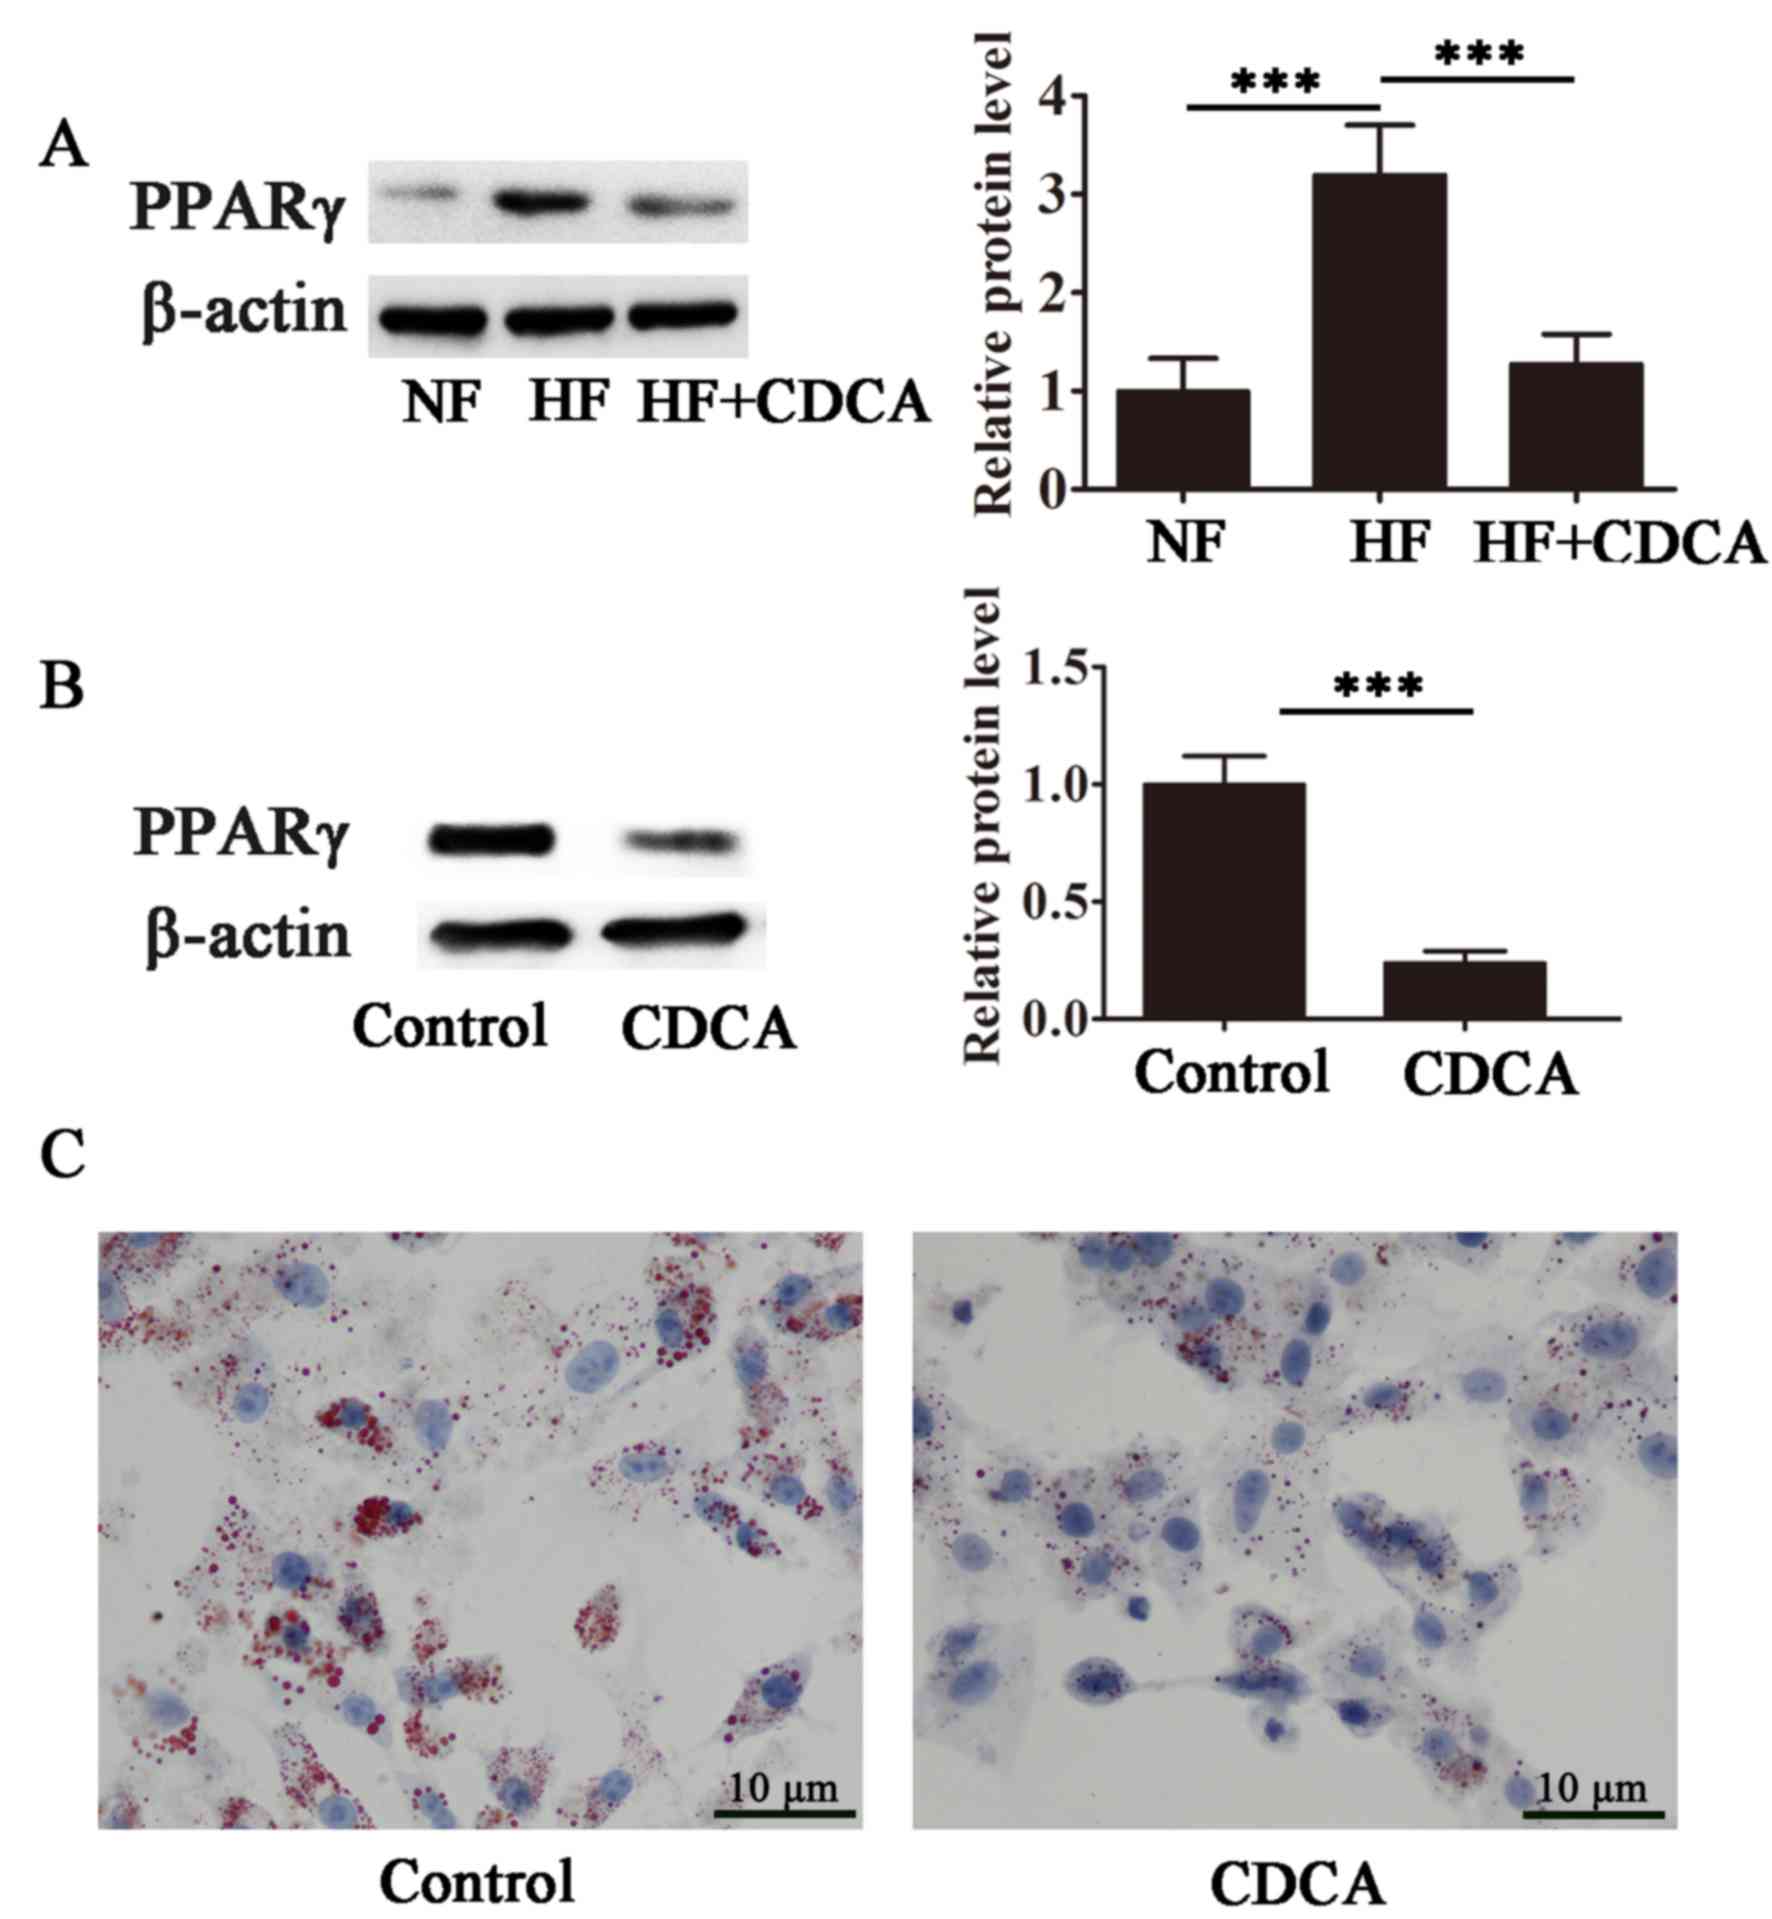
CDCA antagonizes PPARγ and inhibits
lipid accumulation in differentiating adipocytes
The effect of CDCA on the transcriptional activity
of PPARγ, a master regulator of adipogenesis, was evaluated in
differentiating 3T3-L1 cells. As presented in Fig. 4A, high-fat diet-stimulated PPARγ
transcriptional activity was significantly suppressed in the
presence of CDCA (P<0.001), indicating that CDCA antagonized
ligand-stimulated PPARγ activity. Furthermore, CDCA significantly
inhibited lipid accumulation during adipocyte differentiation in
3T3-L1 cells (P<0.001; Fig. 4B and
C). These findings suggest that CDCA inhibits PPARγ activity
and that the antiobesity effects of CDCA may, at least in part, be
due to the antagonism of PPARγ.
Discussion
TGR5 is a membrane receptor that mediates bile acid
signaling. In a previous study by the current authors, it was
reported that TGR5 regulates glucose and energy metabolism and is
therefore a candidate to combat obesity (32). Ligand binding to TGR5 induces
adenylate cyclase, leading to an increase in intracellular cAMP
(23). Elevated levels of cAMP
activate PKA, which phosphorylates the CREB transcription factor,
transactivating its target genes by binding to cAMP response
elements within their promoter sequences (23). In BAT, D2 expression is promoted,
boosting the local production of thyroid hormone and consequently
increasing energy expenditure (23).
Several other genes involved in the regulation of energy
expenditure are upregulated following ligand binding by bile acids
in WAT and BAT, as demonstrated in the current study and a previous
report (23). In the current study,
the mRNA levels of fatty acid synthesis and oxidation-related
factors were increased in BAT but not in WAT. This increase in
energy expenditure and acceleration of metabolism in response to
TGR5 activation leads to decreased body weight via the suppression
of fat deposition. This was demonstrated in the current study using
a mouse model of diet-induced obesity. A significant decrease in
body weight was detected in mice fed an HF diet and treated with
bile acid (CDCA) compared with those fed an HF diet alone.
Furthermore, H&E and oil red O staining determined that CDCA
significantly inhibits the hepatic fat deposition and accumulation
induced by an HF diet. The results of the current study also
suggested that CDCA inhibits adipocyte differentiation in 3T3-L1
cells. This may be explained by the fact that while CDCA stimulates
the transcriptional activity of TGR5, it also antagonizes
ligand-dependent PPARγ transactivation. PPARγ is a master regulator
of adipogenesis (28) and the
antagonistic effect of CDCA on PPARγ may potentially downregulate
the expression of a variety of genes essential for adipocyte
differentiation.
In a previous study by the current authors, it was
hypothesized that different TGR5 ligands may trigger different
downstream pathways and distinct gene expression profiles, leading
to specific functional outcomes (30). It was previously demonstrated that
activation of TGR5 by its ligand in the absence of other
pro-inflammatory stimuli, such as lipopolysaccharide, leads to the
upregulation of interleukin-1β and tumor necrosis factor-α
expression without PKA activation. In this case, cytokine
production is mediated by the activation of c-Jun N-terminal
kinase, which in turn upregulates microRNA-26a expression (30). Therefore, TGR5 mediates its
biological functions via at least two distinct downstream signaling
pathways.
Another effect of TGR5 activation is the stimulation
of glucagon-like peptide 1 (GLP1) secretion (24,32–34).
GLP1 is a member of the incretin family of insulinotropic hormones
secreted from intestinal enteroendocrine cells in response to a
meal and its primary role is regulating insulin secretion (35). In the present study, significantly
lower insulin levels were detected in the serum of mice on a HF
diet treated with CDCA compared with those on a HF diet alone,
indicating that these ligands protect against hyperinsulinemia
induced by a HF diet. As well as regulating insulin levels, TGR5
activation also reduces blood glucose levels in mice fed an HF
diet. In the present study, a significant decrease in blood glucose
levels was observed in mice fed a HF diet and subsequently with
treated with CDCA, compared with those fed an HF diet alone. This
indicates that CDCA decreases blood sugar levels and suggests that
TGR5 enhances glucose tolerance, further confirming its potential
in the treatment of metabolic disorders.
It is imperative that careful consideration is given
to selecting the most suitable TGR5 ligand for drug development to
ensure safety and efficacy. In the present study, the effects of
CDCA was considered for weight reduction. It was determined that
CDCA is effective at reducing weight, however optimizing the safety
of CDCA is essential before it can be considered an anti obesity
drug candidate.
A previous study has investigated the physiological
role of FXR, another bile acid-activated receptor, and FXR agonists
have been investigated for their potential in treating metabolic
disorders (36). However, intrinsic
toxicity has been detected in preclinical trials and variable gene
expression profiles have been reported. This demonstrates the need
for further research to fully elucidate bile acid-activated
signaling networks, in order to develop safe and effective drug
therapies from bile acid ligands. In conclusion, the present
findings indicated that CDCA treatment may effectively suppress
HG-induced obesity.
Acknowledgements
The present study was supported by the National
Natural Science Foundation of China (grant no. 81372092), Fujian
Municipal Natural Science Foundation (grant no. 2011Y0029), Fujian
Health Department Foundation (grant no. 2013-ZQN-ZD-15), Fujian
Finance Department Foundation (grant no. 010110002), Research
Foundation of Fujian Provincial Department of Science &
Technology (grant no. 2016Y4003), Research Foundation of Fujian
Development and Reform Commission (grant no. 201603), Key Program
of National Clinical Specialty Discipline Construction of China and
Key Clinical Specialty Discipline Construction Program of Fujian,
China.
References
|
1
|
Hossain P, Kawar B and El Nahas M: Obesity
and diabetes in the developing world-a growing challenge. N Engl J
Med. 356:213–215. 2007. View Article : Google Scholar : PubMed/NCBI
|
|
2
|
Gesta S, Tseng YH and Kahn CR:
Developmental origin of fat: Tracking obesity to its source. Cell.
131:242–256. 2007. View Article : Google Scholar : PubMed/NCBI
|
|
3
|
Alrushud AS, Rushton AB, Kanavaki AM and
Greig CA: Effect of physical activity and dietary restriction
interventions on weight loss and the musculoskeletal function of
overweight and obese older adults with knee osteoarthritis: A
systematic review and mixed method data synthesis. BMJ Open.
7:e0145372017. View Article : Google Scholar : PubMed/NCBI
|
|
4
|
Onakpoya IJ, Heneghan CJ and Aronson JK:
Post-marketing withdrawal of anti-obesity medicinal products
because of adverse drug reactions: A systematic review. BMC Med.
14:1912016. View Article : Google Scholar : PubMed/NCBI
|
|
5
|
Liu P, Ji Y, Yuen T, Rendina-Ruedy E,
DeMambro VE, Dhawan S, Abu-Amer W, Izadmehr S, Zhou B, Shin AC, et
al: Blocking FSH induces thermogenic adipose tissue and reduces
body fat. Nature. 546:107–112. 2017. View Article : Google Scholar : PubMed/NCBI
|
|
6
|
Townsend K and Tseng YH: Brown adipose
tissue: Recent insights into development, metabolic function and
therapeutic potential. Adipocyte. 1:13–24. 2012. View Article : Google Scholar : PubMed/NCBI
|
|
7
|
Cypess AM and Kahn CR: Brown fat as a
therapy for obesity and diabetes. Curr Opin Endocrinol Diabetes
Obes. 17:143–149. 2010. View Article : Google Scholar : PubMed/NCBI
|
|
8
|
Saito M, Okamatsu-Ogura Y, Matsushita M,
Watanabe K, Yoneshiro T, Nio-Kobayashi J, Iwanaga T, Miyagawa M,
Kameya T, Nakada K, et al: High incidence of metabolically active
brown adipose tissue in healthy adult humans: Effects of cold
exposure and adiposity. Diabetes. 58:1526–1531. 2009. View Article : Google Scholar : PubMed/NCBI
|
|
9
|
van Marken Lichtenbelt WD, Vanhommerig JW,
Smulders NM, Drossaerts JM, Kemerink GJ, Bouvy ND, Schrauwen P and
Teule GJ: Cold-activated brown adipose tissue in healthy men. N
Engl J Med. 360:1500–1508. 2009. View Article : Google Scholar : PubMed/NCBI
|
|
10
|
Virtanen KA, Lidell ME, Orava J, Heglind
M, Westergren R, Niemi T, Taittonen M, Laine J, Savisto NJ,
Enerback S, et al: Functional brown adipose tissue in healthy
adults. N Engl J Med. 360:1518–1525. 2009. View Article : Google Scholar : PubMed/NCBI
|
|
11
|
Zingaretti MC, Crosta F, Vitali A,
Guerrieri M, Frontini A, Cannon B, Nedergaard J and Cinti S: The
presence of UCP1 demonstrates that metabolically active adipose
tissue in the neck of adult humans truly represents brown adipose
tissue. FASEB J. 23:3113–3120. 2009. View Article : Google Scholar : PubMed/NCBI
|
|
12
|
Cannon B and Nedergaard J: Brown adipose
tissue: Function and physiological significance. Physiol Rev.
84:277–359. 2004. View Article : Google Scholar : PubMed/NCBI
|
|
13
|
Beranger GE, Karbiener M, Barquissau V,
Pisani DF, Scheideler M, Langin D and Amri EZ: In vitro brown and
‘brite’/‘beige’ adipogenesis: Human cellular models and molecular
aspects. Biochim Biophys Acta. 1831:905–914. 2013. View Article : Google Scholar : PubMed/NCBI
|
|
14
|
Rubattu S, Stanzione R, Bianchi F, Cotugno
M, Forte M, Della Ragione F, Fioriniello S, D'Esposito M, Marchitti
S, Madonna M, et al: Reduced brain UCP2 expression mediated by
microRNA-503 contributes to increased stroke susceptibility in the
high-salt fed stroke-prone spontaneously hypertensive rat. Cell
Death Dis. 8:e28912017. View Article : Google Scholar : PubMed/NCBI
|
|
15
|
Rothwell NJ and Stock MJ:
Luxuskonsumption, diet-induced thermogenesis and brown fat: The
case in favour. Clin Sci (Lond). 64:19–23. 1983. View Article : Google Scholar : PubMed/NCBI
|
|
16
|
Arch JR: beta(3)-Adrenoceptor agonists:
Potential, pitfalls and progress. Eur J Pharmacol. 440:99–107.
2002. View Article : Google Scholar : PubMed/NCBI
|
|
17
|
Ghorbani M and Himms-Hagen J: Appearance
of brown adipocytes in white adipose tissue during CL 316,
243-induced reversal of obesity and diabetes in Zucker fa/fa rats.
Int J Obes Relat Metab Disord. 21:465–475. 1997. View Article : Google Scholar : PubMed/NCBI
|
|
18
|
Kim H, Pennisi PA, Gavrilova O, Pack S,
Jou W, Setser-Portas J, East-Palmer J, Tang Y, Manganiello VC and
Leroith D: Effect of adipocyte beta3-adrenergic receptor activation
on the type 2 diabetic MKR mice. Am J Physiol Endocrinol Metab.
290:E1227–E1236. 2006. View Article : Google Scholar : PubMed/NCBI
|
|
19
|
Kopecky J, Clarke G, Enerback S,
Spiegelman B and Kozak LP: Expression of the mitochondrial
uncoupling protein gene from the aP2 gene promoter prevents genetic
obesity. J Clin Invest. 96:2914–2923. 1995. View Article : Google Scholar : PubMed/NCBI
|
|
20
|
Nagase I, Yoshida T, Kumamoto K, Umekawa
T, Sakane N, Nikami H, Kawada T and Saito M: Expression of
uncoupling protein in skeletal muscle and white fat of obese mice
treated with thermogenic beta 3-adrenergic agonist. J Clin Invest.
97:2898–2904. 1996. View Article : Google Scholar : PubMed/NCBI
|
|
21
|
Liu X, Zheng Z, Zhu X, Meng M, Li L, Shen
Y, Chi Q, Wang D, Zhang Z, Li C, et al: Brown adipose tissue
transplantation improves whole-body energy metabolism. Cell Res.
23:851–854. 2013. View Article : Google Scholar : PubMed/NCBI
|
|
22
|
Stanford KI, Middelbeek RJ, Townsend KL,
An D, Nygaard EB, Hitchcox KM, Markan KR, Nakano K, Hirshman MF,
Tseng YH, et al: Brown adipose tissue regulates glucose homeostasis
and insulin sensitivity. J Clin Invest. 123:215–223. 2013.
View Article : Google Scholar : PubMed/NCBI
|
|
23
|
Watanabe M, Houten SM, Mataki C,
Christoffolete MA, Kim BW, Sato H, Messaddeq N, Harney JW, Ezaki O,
Kodama T, et al: Bile acids induce energy expenditure by promoting
intracellular thyroid hormone activation. Nature. 439:484–489.
2006. View Article : Google Scholar : PubMed/NCBI
|
|
24
|
Maruyama T, Miyamoto Y, Nakamura T, Tamai
Y, Okada H, Sugiyama E, Nakamura T, Itadani H and Tanaka K:
Identification of membrane-type receptor for bile acids (M-BAR).
Biochem Biophys Res Commun. 298:714–719. 2002. View Article : Google Scholar : PubMed/NCBI
|
|
25
|
Moore DD, Kato S, Xie W, Mangelsdorf DJ,
Schmidt DR, Xiao R and Kliewer SA: International union of
pharmacology. LXII. The NR1H and NR1I receptors: Constitutive
androstane receptor, pregnene X receptor, farnesoid X receptor
alpha, farnesoid X receptor beta, liver X receptor alpha, liver X
receptor beta, and vitamin D receptor. Pharmacol Rev. 58:742–759.
2006. View Article : Google Scholar : PubMed/NCBI
|
|
26
|
Nguyen A and Bouscarel B: Bile acids and
signal transduction: Role in glucose homeostasis. Cell Signal.
20:2180–2197. 2008. View Article : Google Scholar : PubMed/NCBI
|
|
27
|
Broeders EP, Nascimento EB, Havekes B,
Brans B, Roumans KH, Tailleux A, Schaart G, Kouach M, Charton J,
Deprez B, et al: The Bile acid chenodeoxycholic acid increases
human brown adipose tissue activity. Cell Metab. 22:418–426. 2015.
View Article : Google Scholar : PubMed/NCBI
|
|
28
|
Rosen ED, Sarraf P, Troy AE, Bradwin G,
Moore K, Milstone DS, Spiegelman BM and Mortensen RM: PPAR gamma is
required for the differentiation of adipose tissue in vivo and in
vitro. Mol Cell. 4:611–617. 1999. View Article : Google Scholar : PubMed/NCBI
|
|
29
|
Hu E, Kim JB, Sarraf P and Spiegelman BM:
Inhibition of adipogenesis through MAP kinase-mediated
phosphorylation of PPARgamma. Science. 274:2100–2103. 1996.
View Article : Google Scholar : PubMed/NCBI
|
|
30
|
Chen X, Xu H, Ding L, Lou G, Liu Y, Yao Y,
Chen L, Huang W and Fu X: Identification of miR-26a as a target
gene of bile acid receptor GPBAR-1/TGR5. PLoS One. 10:e01312942015.
View Article : Google Scholar : PubMed/NCBI
|
|
31
|
Koopman R, Schaart G and Hesselink MK:
Optimisation of oil red O staining permits combination with
immunofluorescence and automated quantification of lipids.
Histochem Cell Biol. 116:63–68. 2001.PubMed/NCBI
|
|
32
|
Kawamata Y, Fujii R, Hosoya M, Harada M,
Yoshida H, Miwa M, Fukusumi S, Habata Y, Itoh T, Shintani Y, et al:
A G protein-coupled receptor responsive to bile acids. J Biol Chem.
278:9435–9440. 2003. View Article : Google Scholar : PubMed/NCBI
|
|
33
|
Chen X, Lou G, Meng Z and Huang W: TGR5: A
novel target for weight maintenance and glucose metabolism. Exp
Diabetes Res. 2011:8535012011. View Article : Google Scholar : PubMed/NCBI
|
|
34
|
Katsuma S, Hirasawa A and Tsujimoto G:
Bile acids promote glucagon-like peptide-1 secretion through TGR5
in a murine enteroendocrine cell line STC-1. Biochem Biophys Res
Commun. 329:386–390. 2005. View Article : Google Scholar : PubMed/NCBI
|
|
35
|
Sato H, Genet C, Strehle A, Thomas C,
Lobstein A, Wagner A, Mioskowski C, Auwerx J and Saladin R:
Anti-hyperglycemic activity of a TGR5 agonist isolated from Olea
europaea. Biochem Biophys Res Commun. 362:793–798. 2007. View Article : Google Scholar : PubMed/NCBI
|
|
36
|
Ye L, Jiang Y and Zuo X:
Farnesoid-X-receptor expression in monocrotaline-induced pulmonary
arterial hypertension and right heart failure. Biochem Biophys Res
Commun. 467:164–170. 2015. View Article : Google Scholar : PubMed/NCBI
|