Introduction
Sepsis is defined as life-threatening organ
dysfunction arising from a dysregulated host response to infection.
Septic shock is a severe form of sepsis in which circulatory,
cellular and metabolic abnormalities increase the risk of mortality
more than sepsis alone (1). Sepsis
is the primary cause of mortality among critically ill patients in
intensive care units (2) and while
its incidence continues to increase, the understanding of sepsis,
as well as its diagnosis and treatment, remain limited. However, it
has been suggested that immunosuppression serves an important role
in sepsis (3).
Hotchkiss et al (4,5)
demonstrated that early mortality occurs due to an uncontrollable
inflammatory cytokine storm, but if pro-inflammatory and
anti-inflammatory responses are rebalanced, the prognosis of
patients improves, leading to successful recovery. However, if
innate and adaptive immune functions are damaged, delayed mortality
occurs due to persistent immunosuppression and recurrent
infections. The reasons for the different outcomes of sepsis remain
unknown. Previous studies have focused on the cause of mortality in
patients with sepsis and few experiments have assessed those who
survived (2–5). Studying the survivors of sepsis may
explain the varying outcomes and mechanisms of recovery.
Furthermore, establishing natural causes of sepsis may identify the
necessity for intervention in patients with sepsis. Thus,
investigations into the immune response that occurs during the
recovery stage of sepsis are required.
In the current study, a stable and reliable 30-day
sepsis survival model was established in rats. The quality and
quantity of regulatory T cells (Tregs) were observed dynamically to
reflect early, delayed and recovery immune status to improve
understanding of the differences in immune responses during septic
periods. Tregs are specialized immune cells that serve important
roles in the maintenance of immune homeostasis (6). Tregs may contribute to
immunosuppressive conditions during the course of sepsis, however,
their relevance during early, delayed and recovery stages of the
disease remain unclear and the results of previous studies are
contradictory (7–10).
The proteomes of Tregs from the blood and spleens of
rats that survived sepsis were obtained using nano high-performance
liquid chromatography-mass spectrometry (nano HPLC-MS/MS). It was
proposed that differentially-expressed proteins and their
associated signaling pathways may explain the mechanisms of
recovery from sepsis. Differential protein expression was detected
in Tregs from the blood and spleens of rats that survived sepsis
and those who underwent sham surgery and this tissue specificity
may be associated with the pathogenesis of sepsis. The current
study identified the proteins involved in sepsis and may provide
novel approaches for the clinical monitoring and treatment of
patients with sepsis.
Materials and methods
Animal model
A total of 110 male Sprague-Dawley rats (weight,
300–350 g; age, 10 weeks) were purchased from Dalian Medical
University (Dalian, China) for experiments. Rats were divided into
the sham group (n=42) and sepsis group (n=68). Rats were housed in
standard conditions (room temperature 22°C; humidity 50–65%, 12-h
light/dark cycle) and had free access to food and water. Rats were
allowed to acclimate for ≥7 days before experiments began. All
surgical procedures were performed using a small-animal anesthesia
machine (Raymain Instrument, Co., Ltd., Shanghai, China) with 3%
sevoflurane (Abbott Laboratories, Lake Bluff, IL, USA). PE-50
catheters (inner diameter, 0.58 mm; outer diameter, 0.96 mm;
length, 8 cm; Smiths Medical UK, Kent, UK) were inserted into the
right external jugular vein and carotid artery of the rats. Sepsis
was induced via cecal ligation and puncture (CLP) 24 h following
insertion of the catheter. The rats were anesthetized and the
abdominal cavity was opened with a 2 cm midline incision. In the
sepsis group, the cecum was exposed and ligated 2 cm from the blind
end and below the ileocecal valve, and subsequently punctured 3
times using a 21-gauge triangular needle. A total volume of 0.2 ml
fecal material was squeezed from the cecum into the peritoneum. The
sham group underwent laparotomy alone, without surgical
manipulation of the cecum. A 2 ml volume of 0.9% normal saline was
injected intraperitoneally. The abdomen was slowly manipulated so
that the contents were diffused and the intestines were arranged
naturally. Following the suturing of the abdominal cavity, 4 mg/kg
0.125% bupivacaine (Shandong Hualu Pharmaceutical Co., Ltd.,
Laocheng, China) was applied around the incision site for
postoperative analgesia in sepsis and sham rats. Following recovery
from anesthesia, fluid resuscitation consisting of a 1:1 solution
of 6% hetastarch (Eloheas, Fresenius Kabi Asia-Pacific, Ltd.,
Wanchai, Hong Kong) and 5% glucose was administered through the
catheters in the right external jugular vein. A total of 20 ml/kg
liquid was administered every 12 h on the first and second days,
which was then halved until the rats resumed eating (11). All experimental animal protocols were
approved by the Animal Care and Use Committee of Dalian Medical
University.
Sepsis evaluation
All rats were monitored for 30 days. The body weight
of the rats was recorded at the same time each day up until
mortality. Rats were scored as mildly, moderately or severely
affected with regard to appearance, alertness and blood pressure,
24 h following CLP (Table I). Each
rat had to exhibit at least two characteristics in the appearance
and alertness categories to obtain a score for that particular
category. Blood pressure readings were recorded when the line was
clear and the trace was stable for 10 min (12). Rats were anatomized following
mortality or on day 30 when the remaining rats were sacrificed in
the survival and sham groups.
 | Table I.Sepsis scoring rubric. |
Table I.
Sepsis scoring rubric.
| Variable | Mild | Moderate | Severe |
|---|
| Appearance | Hunched | Hunched | Marked
piloerection |
|
| Piloerection | Marked
piloerection | Markedly bloated
abdomen |
|
| No bloating | Bloated abdomen
Sunken eyes | Conjunctival
injection |
| Alertness | Alert | Depressed level of
alertness | Markedly (or
absent) depressed level of alertness |
|
| Occasional interest
in environment | Little interest in
environment | No interest in
environment |
|
| Moves freely | Moves with
difficulty | No movement |
| Mean blood pressure
(mmHg) | >90 | 75–90 | >75 |
Cytokine analysis
Blood samples (1 ml) were collected on days 0, 1, 7,
14, 22 and 30 from 3 rats per group at each time-point and stored
in EDTA in anticoagulation tubes on ice. Plasma was separated and
stored at −80°C prior to analysis. Lymphocytes were isolated and
homogenized in 1 ml 1X PBS and stored overnight at −20°C. Three
freeze-thaw cycles were performed to break down cell membranes and
the resulting homogenates were centrifuged for 5 min at 5,000 × g
at 2–8°C. The supernatant was then removed and stored at −80°C.
Levels of interleukin (IL)-10, transforming growth factor β1
(TGF-β1) and forkhead box p3 (Foxp3) were analyzed using ELISA
kits: Rat IL-10 (cat no. CSB-E04595r), rat TGF-β1 (cat no.
CSB-E04727r) and rat FoxP3 (cat no. CSB-E15075r) (all from Cusabio
Biotech, Co., Ltd., Wuhan, China). The minimum detectable levels of
these proteins are typically <0.78, 1.56 and 7.81 pg/ml,
respectively, according to the manufacturer.
Treg analysis
A total of three rats per group at each time-point
were sacrificed on days 0, 1, 7, 14, 22 and 30. Lymphocytes were
isolated from the blood and spleen samples (rat peripheral
blood/spleen lymphocytes isolation kit, LTS1083/1083PK; Tianjin
Haoyang Biological Manufacture Co., Ltd., Tianjin, China) to
conduct staining and flow cytometry. Anti-rat CD4-fluorescein
isothiocyanate [cat no. 11-0040, 1:200, anti-rat CD25-phycoerythrin
(PE)] (cat no. 12-0390, 1:150) or their isotype control antibodies
(cat no. 11-4724, 1:200; cat no. 12-4724, 1:150) were added to 100
µl cell suspension (106 cells) in the dark for 30 min at
4°C. Cells were then washed twice with staining buffer (cat no.
00-4222). Following fixation/permeabilization (cat no. 00-5523) in
the dark for 30 min at 4°C, anti-mouse/rat Foxp3-PE-cyanine5 (cat
no. 15-5773, 1:10) or its isotype control antibody (cat no.
15-4321, 1:10) were added and incubated in the dark for 30 min at
4°C. Cells were then washed twice with permeabilization buffer (cat
no. 00-5523) and the population of CD4+CD25+
T cells and CD4+CD25+Foxp3+ Tregs
was analyzed using a flow cytometer with FACSDiva 7.0 software (BD
Biosciences, Franklin Lakes, NJ, USA). All antibodies, isotype
control antibodies and buffers were purchased from eBioscience;
Thermo Fisher Scientific, Inc. (Waltham, MA, USA).
Proteomic analysis
A total of 8 rats from the survival group and 8 rats
from the sham group were sacrificed on day 30 and
CD4+CD25+Foxp3+ Tregs were
isolated from the blood and spleen samples using a flow cytometer.
Proteins were denatured with a pH 7.4 extraction buffer consisting
of 8 M guanidine hydrochloride, 2 M urea and a 2% protease
inhibitor cocktail. Cells were disrupted using ultra sonication
with 10 cycles of 5 sec work-time and 10 sec recovery (kHz, w) on
ice. Following incubation for 2 h at 4°C, the supernatant was
collected using centrifugation at 35,000 × g for 45 min at 4°C.
A total of 100 µg protein was reduced with 100 mM
dithiothreitol for 5 min at 95°C and the supernatant was collected
following centrifugation at 20,000 × g for 30 min at room
temperature. Proteins were alkylated with 50 mM iodoacetamide
(Sigma-Aldrich; Merck KGaA, Darmstadt, Germany) for 20 min in the
dark at room temperature and then transferred to an ultrafiltration
membrane (10 kDa; Sartorius AG, Göttingen, Germany) by
centrifugation at 14,000 × g for 20 min at room temperature. The
membrane was incubated with 2 µg trypsin for 12 h in a water bath
at 37°C and then washed with 100 µl 50 mM phosphate buffer (pH 8.5)
and centrifuged three times at 14,000 × g for 20 min at room
temperature.
Peptide samples obtained from Tregs in the
survival-group blood and sham-group spleens were labeled with 16 µl
4% formaldehyde and classified as light label (L), whereas peptide
samples from Tregs in the sham-group blood and survival-group
spleens were labeled with 16 µl 4% deuterated formaldehyde and
classified as heavy label (H). Samples were mixed by vortexing at
1,000 rpm for 3 min and 16 µl sodium cyanoborohydride was added.
Following 1 h agitation at 37°C, the reaction was attenuated with 1
µl 25% ammonia. pH was tested using 1 µl formic acid and the
results indicated that the sample was acidic. The labeled samples
from the survival-group and sham-group blood and spleens were mixed
at a 1:1 ratio prior to nano HPLC-MS/MS.
Nano HPLC-MS/MS
Nano HPLC was performed using an UltiMate 3000
Capillary/Nano LC system equipped with an autosampler (Dionex;
Thermo Fisher Scientific, Inc.) at room temperature. Peptide
separation was performed on a Venusil XBP C18 column (4.6×150 mm, 5
µm, 100 Å; Tianjin Bonna-Agela, Tianjin, China) with buffers as
follows: i) Mobile phase A consisting of 2% volume/volume (v/v)
acetonitrile with 0.1% (v/v) formic acid and ii) mobile phase B
consisting of 98% (v/v) acetonitrile with 1.0% (v/v) formic acid.
Following pretreatment of the analytical column (150 mm, 75 µm
inside diameter) with 98% mobile phase A, 1 µg labeled samples were
loaded onto a trap column using the autosampler at a flow rate of 7
µl/min. The gradients for separation were as follows: 15–100 min,
6–22% mobile phase B; 100–120 min, 22–35% mobile phase B; 120–130
min, 35–8% mobile phase B and 130–140 min, 80% mobile phase B.
The LC eluent was analyzed with positive ion
nanoflow electrospray using a Q Exactive™ Benchtop
Quadrupole-Orbitrap™ mass spectrometer (Thermo Fisher
Scientific, Inc.). The parameters of the first stage mass spectrum
were as follows: The spray voltage of the capillary was 1.6 kV; the
MS mass scan range was 300–1,800 m/sec with a resolution of 70,000;
the ion automatic gain control (AGC) was set to 1e6 and the maximum
time of ion injection was 50 ms. The data-dependent acquisition
parameters of the second stage were as follows: The strongest ten
ions of which the MS spectrum intensity was >1e4 were selected
in a dynamic exclusion; the collision energy was set to 28%; the
resolution was 17,500; the ion AGC was 1e4; the maximum time of ion
injection was 100 ms and selected ions were isolated with 2 m/s. MS
data were collected and recorded using Xcalibur software (version
3.0.63; Thermo Fisher Scientific, Inc.). Nano HPLC-MS/MS analysis
was performed on each sample in triplicate.
Data analysis
The results were analyzed with MaxQuant software
(version 1.5.2.8; Max Planck Institute of Biochemistry, Munich,
Germany) using the SP Rat database (www.uniprot.org). Cysteine residues were given a fixed
modification of +57.0215 Da. The N-terminus Lys was set to +28 Da
and +32 Da dimethylated variable modifications. Peptide retrieval
was performed using trypsin complete digestion and tolerance for up
to two leaky cut sites. The parent ion mass tolerance had a
deviation of 20 ppm and the mass fragment ion tolerance had a
deviation of 0.5 Da. The control of search results on the level of
protein and peptide segments had a false positive rate of <1%.
Proteins were identified using Uniprot Knowledgebase (www.uniprot.org) software for cellular localization
and functional analysis of proteins. Proteins with ≥2 spectral
counts in a technical replicate were considered for further
analysis. Peptides with a relative standard deviation of <50% of
protein ratios were selected. Proteins with average ratios of
<0.67 or >1.5 were differentially expressed in a significant
manner. The identified proteins were analyzed using Ingenuity
Pathway Analysis (IPA; www.ingenuity.com).
Statistical analysis
Data are expressed as the mean ± standard error of
the mean. The differences among groups over time were analyzed
using a repeated measures analysis of variance followed by a post
hoc Fisher's least significant difference test using SPSS 17.0
(SPSS, Inc., Chicago, IL, USA). P<0.05 was determined to
indicate a statistically significant difference. The survival
curves were generated using the Kaplan-Meier method and compared
using the log-rank Mantel-Cox test.
Results
Evaluation of the survival model
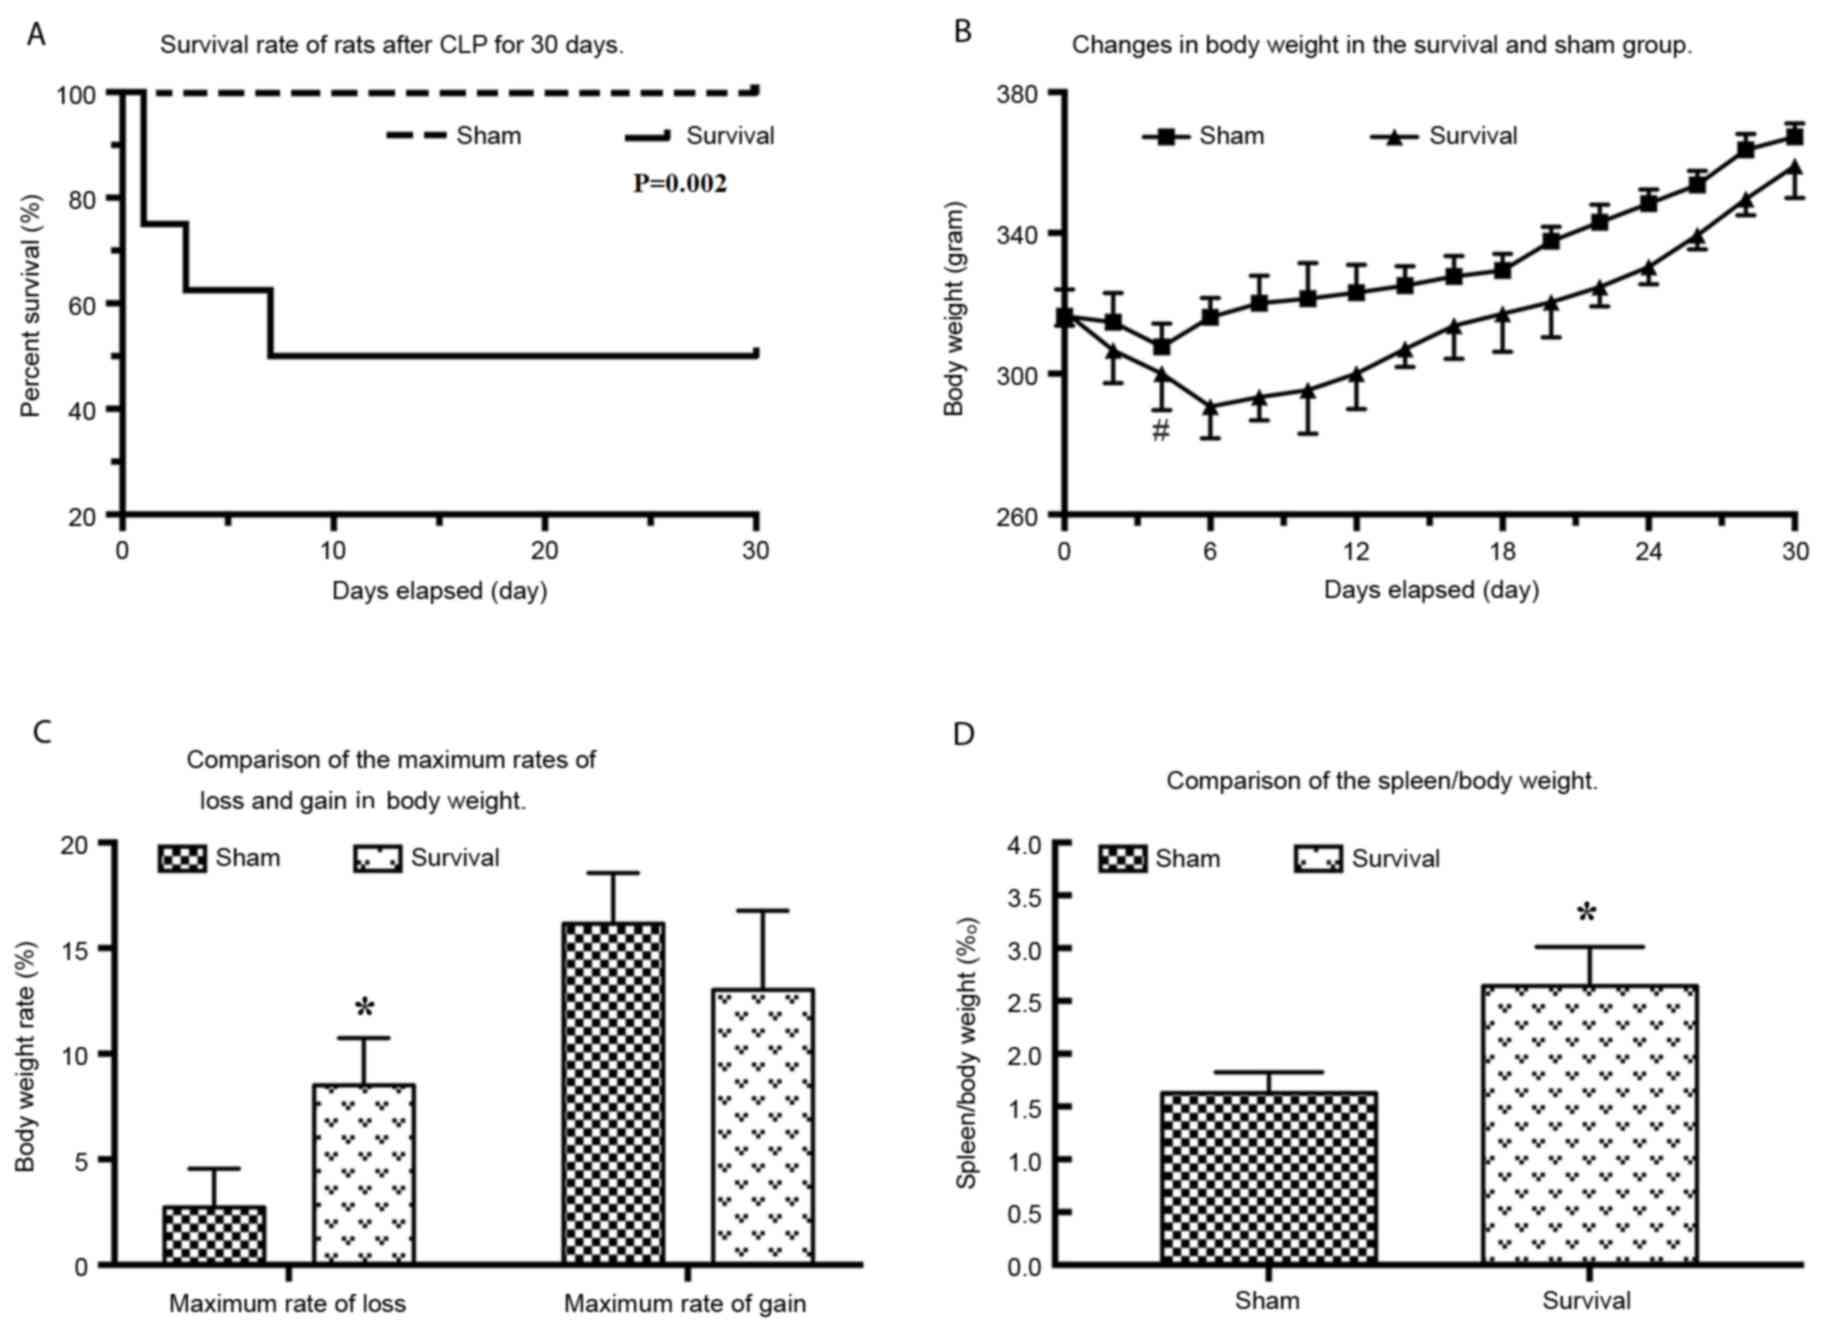
CLP caused sepsis with a medium-severe severity, as
assessed by appearance, alertness and blood pressure defined on the
first day following CLP. The survival rate of rats following CLP
was 75% on day 1, 62.5% on day 3 and 50% on day 7 compared with
100% in the sham group (Fig. 1A).
There was a significant decrease (P=0.017) in weight in the
survival group over the 4 days following CLP, with the minimum
observed on day 6 (Fig. 1B). The
highest body weight loss compared with original weight was
8.51±2.23% and the difference between weight loss observed in the
two groups was significant (P=0.026; Fig. 1C). In the survival group, the anatomy
of the abdomen exhibited adhesions in the abdominal cavity and the
omentum had lost shape and gloss, and trended towards ligation of
the intestine. No encapsulated abscesses were observed in the
survival group. The ratio of spleen weight to total body weight was
2.64±0.37% in the survival group and 1.63±0.20% in the sham group.
The difference between the two groups was significant (P=0.032;
Fig. 1D).
Immune performance of CD4+CD25+Foxp3+
Tregs
The concentration of IL-10 on day 1 was
significantly increased in the survival (P=0.007) and succumbed
(P=0.011) groups compared with the sham group. The difference in
IL-10 concentration between animals that survived and those that
succumbed was also significant (P=0.004) however, IL-10 levels fell
to baseline on day 7 (Fig. 2A). The
concentration of TGF-β1 was significantly increased in the survival
(P=0.004) and succumbed groups on day 1 (P=0.046) compared with the
sham group. However, TGF-β1 levels fell to baseline on day 7
(Fig. 2B). The concentration of
Foxp3 was significantly increased up until day 30 in the survival
group (P=0.024, 0.006, 0.003, 0.002 and 0.004 at day 1, 7, 14 22
and 30, respectively) compared with the sham group (Fig. 2C).
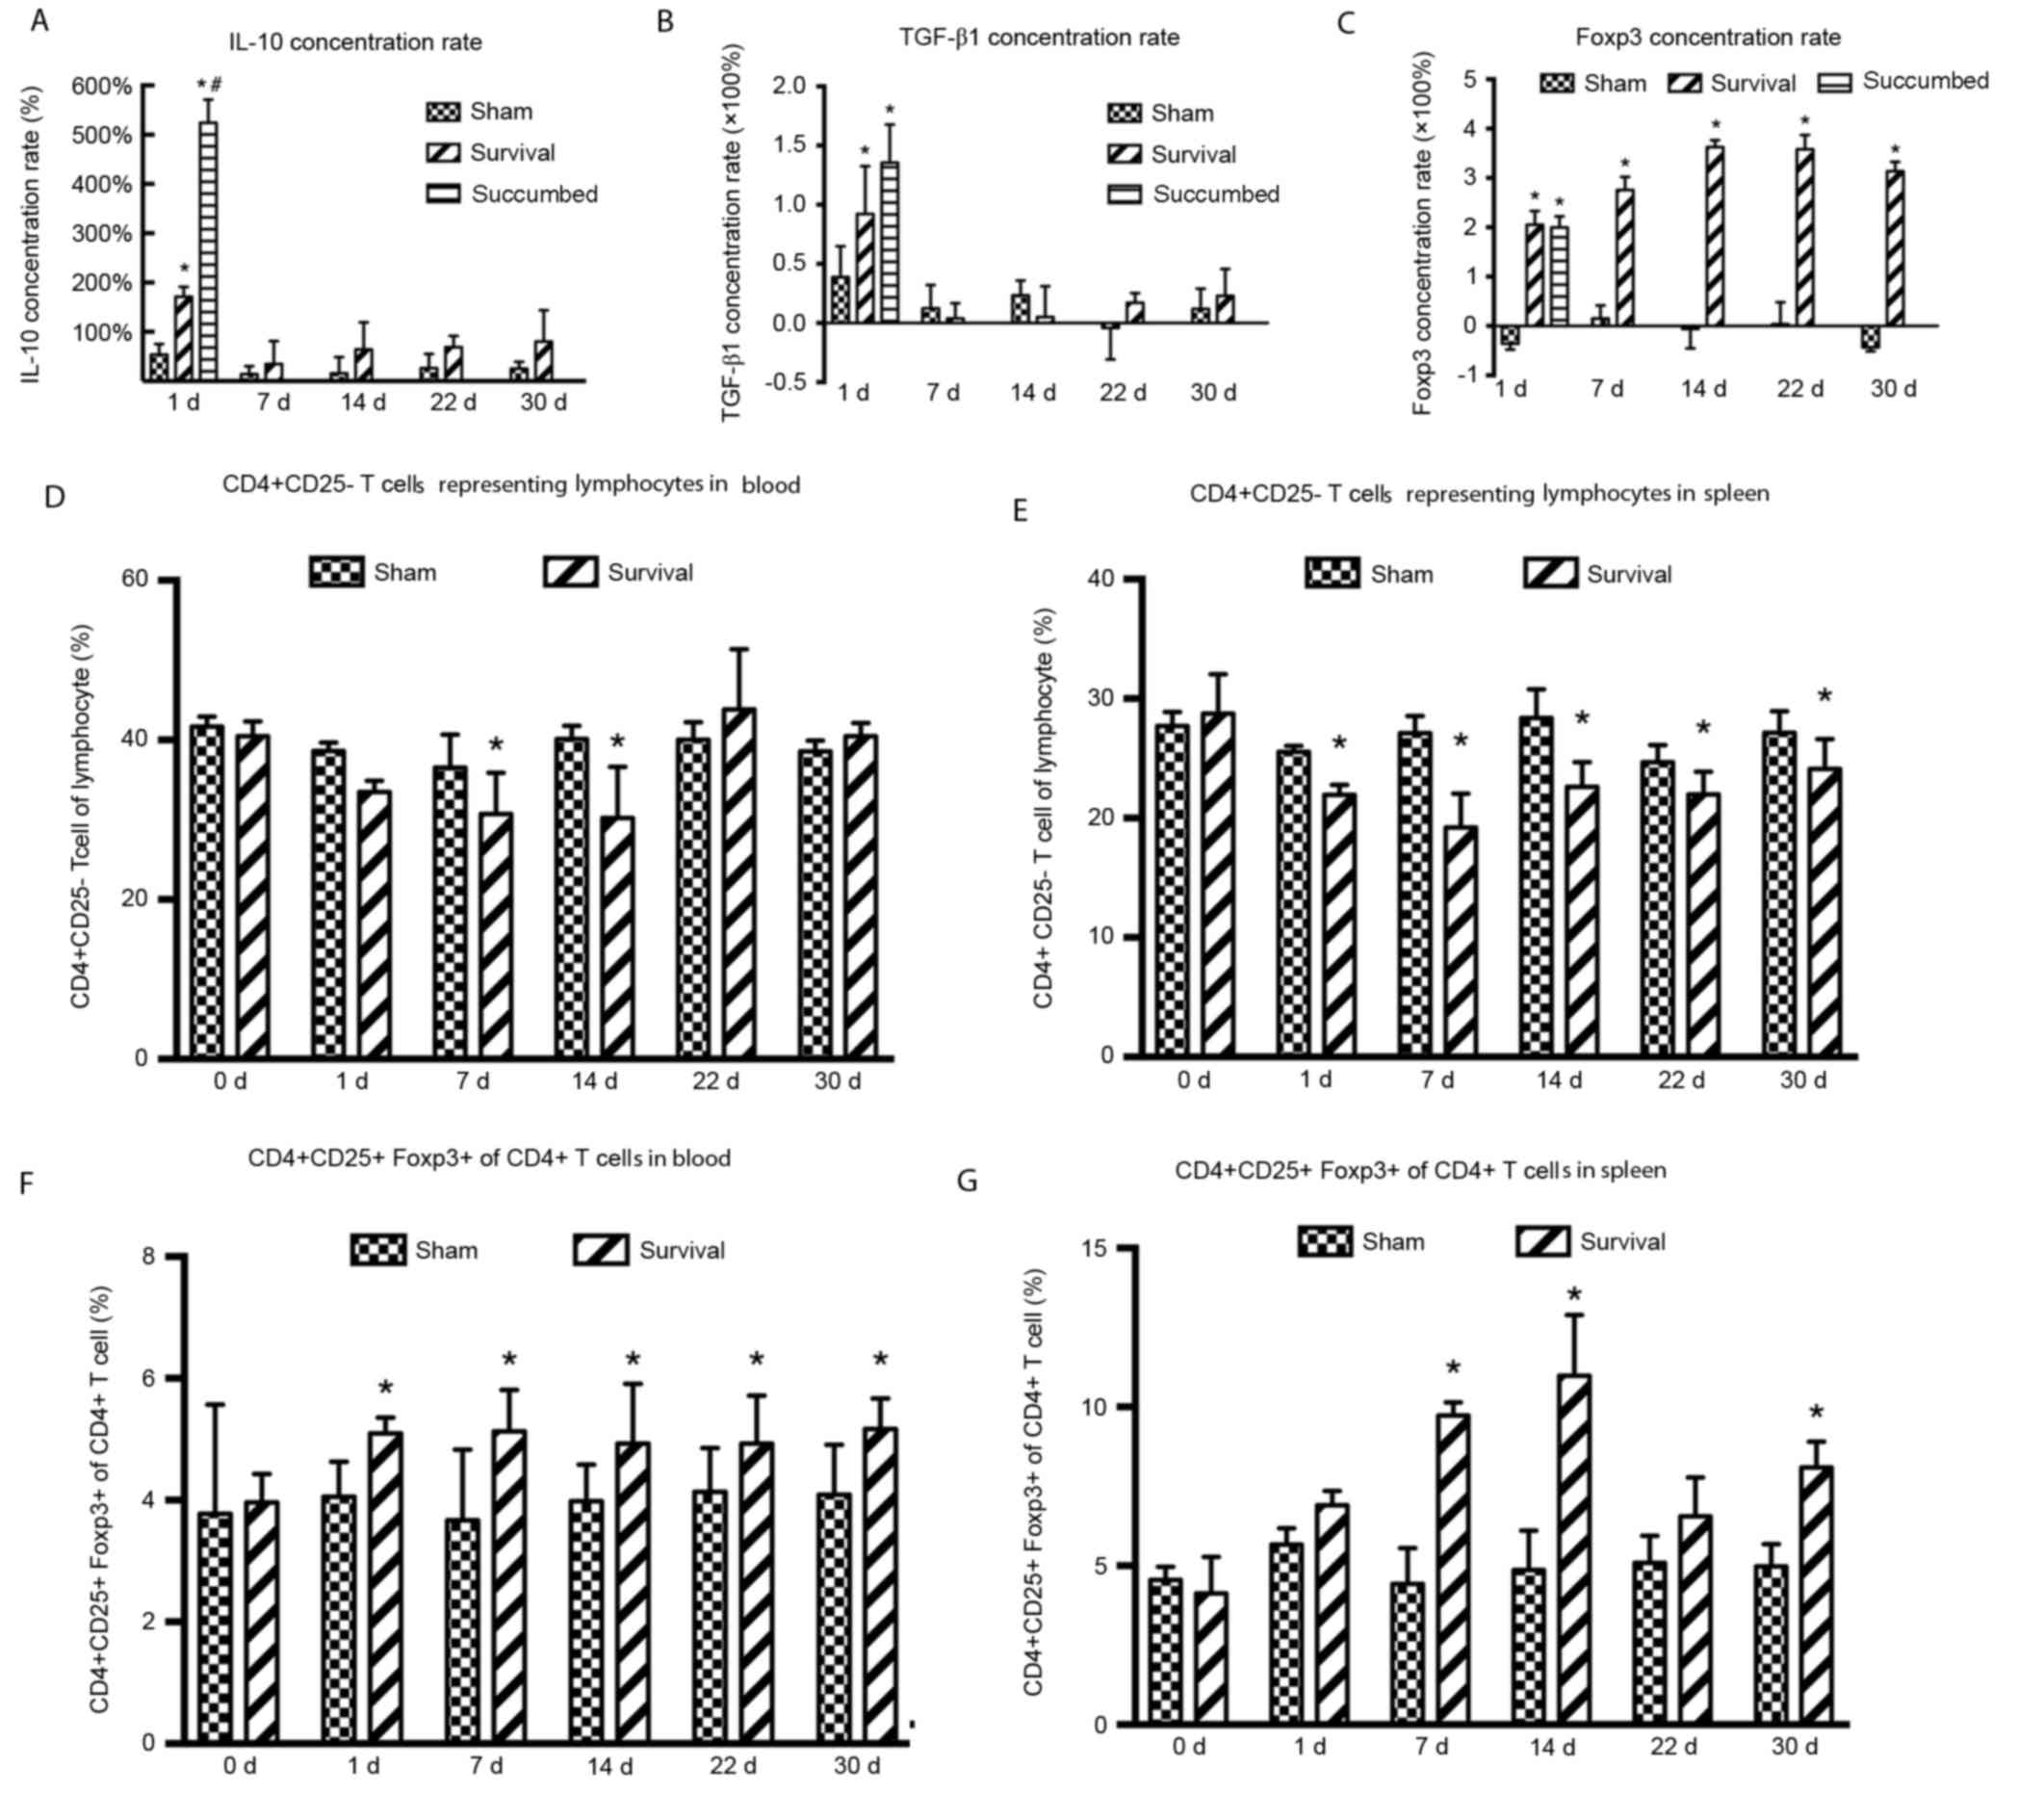 | Figure 2.Immune performance of
CD4+CD25+Foxp3+Tregs. The
concentrations of (A) IL-10, (B) TGF-β1 and (C) Foxp3 were assessed
using ELISA in the survival, sham and succumbed groups (n=8). The
proportion of CD4+ CD25+ T cells within the
lymphocyte gate in the (D) blood and (E) spleen was analyzed using
flow cytometry at days 0, 1, 7, 14, 22 and 30 following CLP or sham
surgery (n=3 in each group at each time-point). The proportion of
CD4+CD25+Foxp3+ Tregs of
CD4+ lymphocytes in the (F) blood and (G) spleen was
analyzed using flow cytometry at days 0, 1, 7, 14, 22 and 30
following CLP or sham surgery (n=3 in each group at each
time-point). Data are expressed as the mean ± standard error of the
mean. *P<0.05 vs. the sham group; #P<0.05 vs. the
survival group. d, day; IL-10, interleukin-10; TGF-β1, transforming
growth factor β1; Foxp3, forkhead box P3; CD, cluster of
differentiation; CLP, cecal ligation and puncture. |
The proportion of CD4+CD25− T
cells, representing lymphocytes in the blood, began to decrease 1
day following CLP and was significantly reduced on days 7 (P=0.026)
and 14 (P=0.030) in the survival group compared with the sham group
(Fig. 2D). These values increased 22
days following CLP and by day 22, the proportion of
CD4+CD25− T cells was not significantly
different in the survival group compared with the sham group
(Fig. 2D). The proportion of
CD4+CD25− T cells representing lymphocytes in
spleen samples also decreased following CLP and were significantly
reduced on days 1–30 (day 1, P=0.060; day 7, P<0.001; day 14,
P=0.004; day 22, P=0.018 and day 30, P=0.048) compared with the
sham group (Fig. 2E). The proportion
of CD4+CD25+Foxp3+ Tregs among
CD4+ T cells in the blood were significantly increased
on days 1–30 in the survival group compared with the sham group
(day 1, P=0.048; day 7, P=0.048; day 14, P=0.049; day 22, P=0.027
and day 30, P=0.043; Fig. 2F). The
proportion of CD4+CD25+Foxp3+
Tregs from CD4+ T cells in the spleen samples were also
increased following CLP on days 7 (P=0.026) and 14 (P=0.030),
followed by a decrease on day 22 in the survival group compared
with the sham group (Fig. 2G).
However, the proportion of
CD4+CD25+Foxp3+ Tregs on day 30
remained significantly higher in the survival group compared with
the sham group (P=0.009; Fig.
2G).
Proteomics of CD4+CD25+Foxp3+
Tregs
Protein ratios of
CD4+CD25+FoxP3+ Tregs were
determined in the spleen and blood of the survival and sham groups.
There were 10 differentially-expressed proteins identified in the
blood and of these, nine were higher and one was lower in the
survival group following CLP compared with the sham group (Table II). There were 18 proteins
differentially expressed in the spleen, 17 of these were lower and
one was higher in the survival group compared with the sham group
(Table III). It was identified
using IPA analysis that 12 biological pathways were associated with
the 10 differentially-expressed proteins in the blood (P<0.05;
Fig. 3A). The pathways exhibiting
the most significant associations included the extracellular
signal-regulated kinase/mitogen-activated protein kinase
(ERK/MAPK), as well as integrin and actin cytoskeletal signaling
pathways (Fig. 3A), in which
Ras-related protein 1b (Rap-1b), talin-1 (Tln1) and filament
protein A (Flna) were associated (Table
II). A total of 25 signaling pathways were identified by IPA in
the spleen group (P<0.05). The pathways exhibiting the most
significant association with the differentially-expressed proteins
included the B-cell translocation gene (BTG) family of proteins
that regulate cell cycle pathways, OX40 signaling, Hippo signaling,
P70-S6 kinase 1 (P70S6K) signaling, biosynthesis of
1,25-dihydroxyvitamin D3 (VD3) and phosphatidylinositol
3-kinase/protein kinase B (PI3K/AKT) signaling (Fig. 3B). Differential factors generating
these results included protein phosphatase 2A activator regulatory
subunit 4 (PPP2R4), protein arginine N-methyltransferase 1 (PRMT1),
T cell surface glycoprotein CD4 (CD4), RT1.A, 14-3-3 protein θ
(Ywhaq) and nicotinamide adenine dinucleotide phosphate
(NADPH)-cytochrome P450 reductase (Table III).
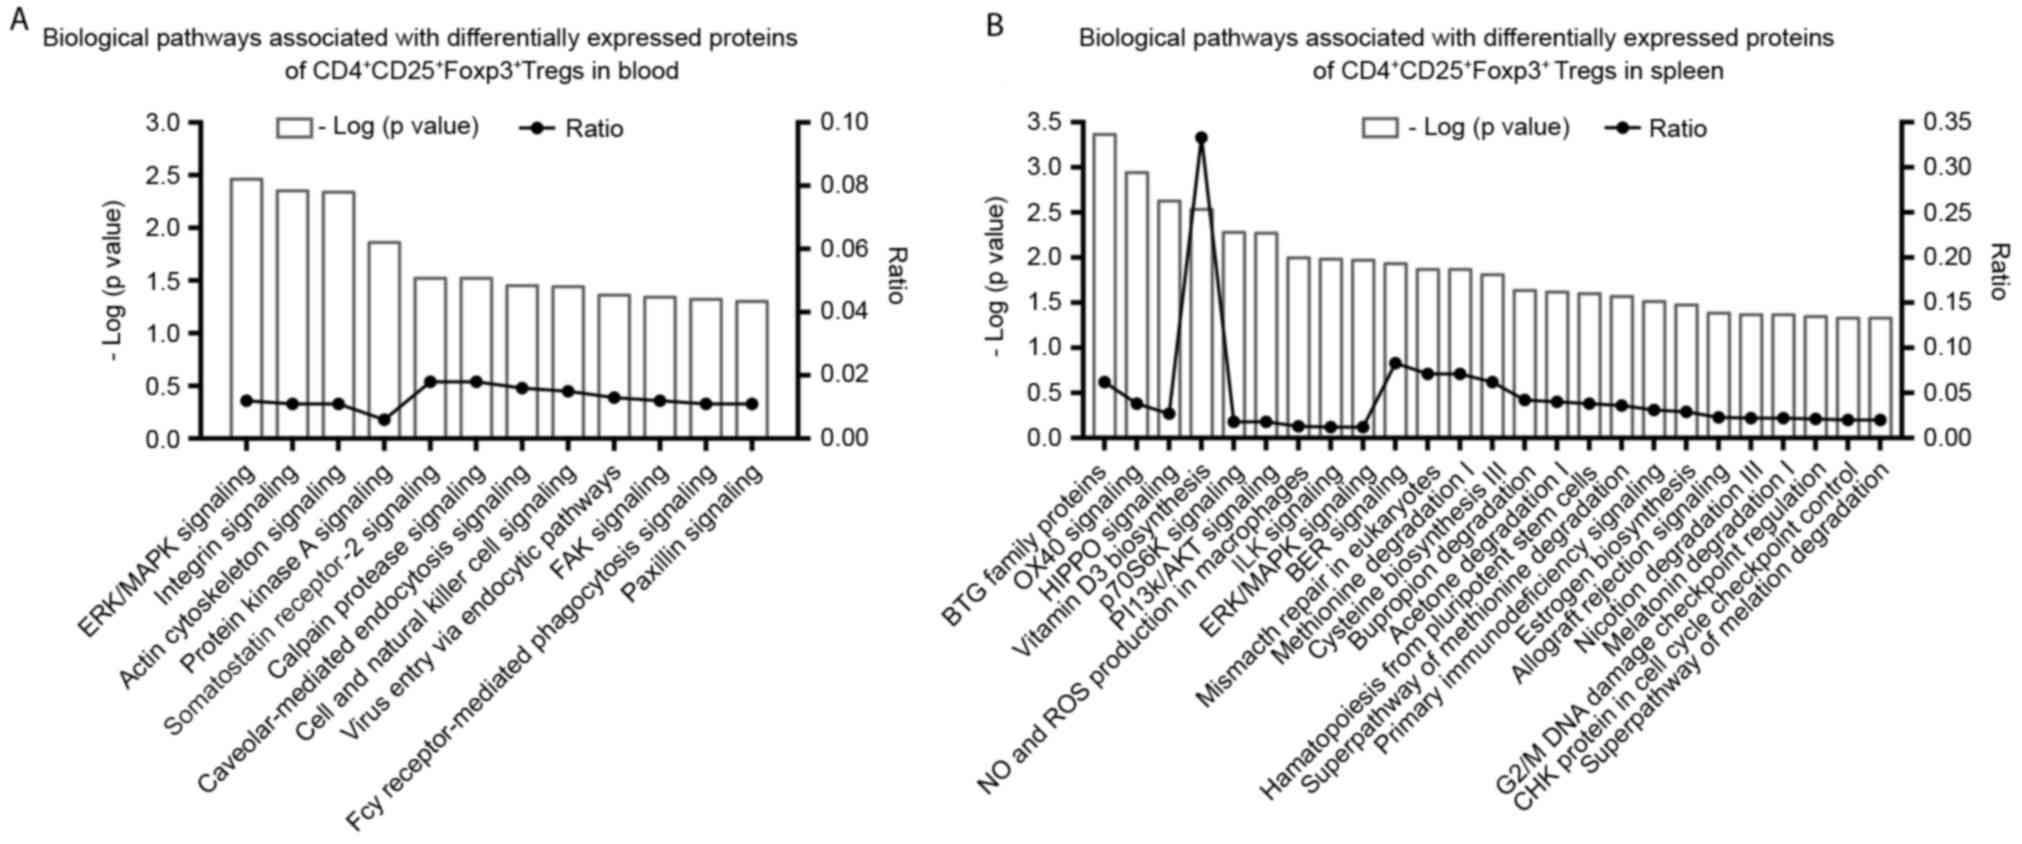 | Figure 3.Significant biological pathways
associated with differentially expressed proteins of
CD4+CD25+Foxp3+ Tregs in the (A)
blood and (B) spleens of the survival group.
P<0.05=−log(P-value)>1.301. Foxp3, forkhead box P3; CD,
cluster of differentiation; ERK/MAPK, extracellular
signal-regulated kinase/mitogen-activated protein kinase; FAK,
focal adhesion kinase; Fcy, purine cytosine permease; BTG, B-cell
translocation gene; p70S6K, P70-S6 kinase 1; PI3K/AKT,
phosphatidylinositol 3-kinase/protein kinase B; NO, nitric oxide;
ROS, reactive oxygen species; ILK, integrin-linked kinase; BER,
base excision repair; CHK, serine/threonine-protein kinase; Treg,
regulatory T-cell. |
| Table II.Proteins identified in blood
CD4+CD25+FoxP3+ Tregs, which are
differently expressed between survival and sham groups. |
Table II.
Proteins identified in blood
CD4+CD25+FoxP3+ Tregs, which are
differently expressed between survival and sham groups.
| Entry name | Gene | Protein | H/L Ratio (mean ±
standard deviation) | Ratio of standard
deviation |
|---|
| Q62636 | RAP1B | Ras-related protein
Rap-1b | 1.52±0.04 | 0.03 |
| C0JPT7 | FLNA | Filamin A | 1.53±0.11 | 0.07 |
| G3V852 | TLN1 | Talin 1 (isoform
CRA_b) | 1.53±0.60 | 0.39 |
| B2GVB9 | FERMT3 | Fermitin family
homolog 3 | 1.66±0.13 | 0.08 |
| P02091 | HBB | Hemoglobin subunit
β-1 | 1.80±0.46 | 0.26 |
| Q566D6 | PSIP1 | PC4 and
SFRS1-interacting protein | 1.88±0.32 | 0.17 |
| B1H216 | HBZ | Hemoglobin subunit
ζ | 1.88±0.51 | 0.27 |
| B2RYQ5 | ERH | Enhancer of
rudimentary homolog | 1.90±0.61 | 0.32 |
| Q63011 | N/A | Zero β-globin
(Fragment) | 2.22±0.17 | 0.08 |
| Q4KLJ1 | SRSF7 | Serin/arginine rich
splicing factor (isoform CRA_a) | 0.54±0.12 | 0.22 |
| Table III.Proteins identified in the spleen
CD4+CD25+FoxP3+ Tregs, which are
differentially expressed between survival and sham groups. |
Table III.
Proteins identified in the spleen
CD4+CD25+FoxP3+ Tregs, which are
differentially expressed between survival and sham groups.
| Entry name | Gene | Protein | H/L ratio (mean ±
standard deviation) | Ratio of standard
deviation |
|---|
| D3ZK97 | H3F3C | Histone H3.3C | 0.12±0.04 | 0.34 |
| F1M2K3 | SUMO2 | Small
ubiquitin-related modifier 2 | 0.13±0.02 | 0.16 |
| A7LNF8 | RT1.A | RT1 class 1, A1
(Fragment) | 0.14±0.05 | 0.37 |
| Q9Z0V5 | PRDX4 |
Peroxiredoxin-4 | 0.18±0.02 | 0.12 |
| Q3KR55 | U2AF1 | Splicing factor
U2AF 35 kDa subunit | 0.20±0.06 | 0.31 |
| Q5XII7 | SNRPB | Small nuclear
ribnucleoprotein-associated proteins B and B' | 0.25±0.05 | 0.20 |
| S5RZM8 | COX2 | Cytochrome c
oxidase subunit 2 | 0.26±0.03 | 0.10 |
| B2RYQ2 | PPP2R4 | Phosphatase 2A
activator regulatory factor 4 | 0.27±0.05 | 0.17 |
| P68255 | YWHAQ | 14-3-3 protein
θ | 0.27±0.01 | 0.03 |
| Q5RKJ9 | RAB10 | Ras-related protein
Rab-10 | 0.34±0.00 | 0.13 |
| Q6PDV1 | LYZ2 | Lysozyme C-2 | 0.35±0.05 | 0.14 |
| P62329 | TMSB4X | Thymosin β-4 | 0.41±0.03 | 0.07 |
| Q63009 | PRMT1 | Protein arginine
N-methyltransferase 1 | 0.41±0.03 | 0.10 |
| F1LVR0 | IGLON5 | IgLON family member
5 | 0.43±0.06 | 0.13 |
| Q6B345 | S100A11 | S100
calcium-binding protein A11 | 0.45±0.05 | 0.10 |
| Q5XIP6 | FEN1 | Flap endonuclease
1 | 0.45±0.11 | 0.23 |
| P00388 | POR | NADPH-cytochrome
P450 reductase | 0.47±0.01 | 0.02 |
| P05540 | CD4 | T-cell surface
glycoprotein CD4 | 2.40±0.30 | 0.13 |
Discussion
A long-term survival model of sepsis was
successfully established in rats using modified CLP procedures,
screening for sepsis manifestation and changes in body weight,
cytokines and anatomy (13,14) to determine the mechanism by which
survivors recover from sepsis without treatment. The current study
investigated the immune status and function of Tregs and
demonstrated that they are different during the early (first 1–3
days), delayed (7 days later) and recovery (day 30) stages of
sepsis (5).
The current study identified 10
differentially-expressed proteins in the blood of the survival/sham
groups and 18 differentially-expressed proteins in the spleen of
the survival/sham groups. The differentially-expressed proteins and
their associated biological pathways differed between Tregs
isolated from the blood and spleen.
The ERK/MAPK signaling pathway serves an important
role in transducing cellular information about meiosis/mitosis,
growth, differentiation and carcinogenesis within a cell.
Membrane-bound receptor tyrosine kinases (RTKs) are growth factor
receptors, which are the starting point of this pathway. Mitogens,
including TGF-β1, epidermal growth factor and insulin, activate the
ERK signaling pathway. Lipopolysaccharide also stimulates the
activation of ERK/MAPK signaling in monocytes/macrophages and
endothelial cells (15–17). Phosphorylated RTKs activate Ras,
which initiates a kinase cascade, beginning with Raf. This then
activates and phosphorylates MAPK, which activates and
phosphorylates ERK. This kinase cascade regulates cell growth,
differentiation, environmental stress, inflammatory responses and
other important cellular physiological/pathological processes
(18–20).
The current study demonstrated that the
Ras-associated protein Rap-1b serves a role in the ERK/MAPK
pathway. Rap-1b is a member of the Ras superfamily, which is a
22-kDa small GTP-binding protein activated by cAMP-dependent
protein kinase. Rap-1b is a key component in the signaling pathway
mediated by RTKs (21). It has been
demonstrated that Rap-1b phosphorylation serves a role in the
biological processes associated with initial cytoskeleton formation
and remodeling (21).
RTK activation of Ras and Raf may occur via
alternate pathways. For example, integrins, which are cell surface
glycoproteins involved in cell-cell and cell-extracellular matrix
interactions, activate ERK via a focal adhesion kinase-mediated
pathway (22,23). These interactions form the basis of
diverse effects including cell migration, anchorage, growth and
differentiation (24). The actin
cytoskeleton serves an important role in many dynamic processes,
including cell motility, axon guidance, cytokinesis and
phagocytosis. These cellular remodeling events require precise
regulation of actin filament assembly/disassembly and organization
(24). Integrin signaling is a
pathway that controls rearrangement of the actin cytoskeleton
(24). It has been suggested that
the actin cytoskeleton may regulate receptor signaling, which is
particularly important for the B-cell receptor and dysregulated
signaling may result in autoimmunity and malignancy (25).
Talin-1 is another differentially-expressed protein,
which was the first cytoskeletal protein identified as binding
directly to integrin (26,27). Talin serves an important role in the
dynamic process of cell adhesion by directly interacting with
integrin and the cytoskeleton (26,27).
Stem cells with disrupted talin genes cannot form focal adhesions
(28). Filamin A was identified in
non-muscle cells as the first actin cross-linking protein and acts
to stabilize the cytoskeleton, transduce biological signals and
also participates in cell dynamics (29–33).
Rap-1b, talin and filamin A are involved in the
ERK/MAPK, integrin and actin cytoskeleton signaling pathways, which
all interact with each other. Elevated levels of these three
proteins suggest that Tregs from the blood continue to proliferate,
aggregate and undergo adhesion and phagocytosis 30 days following
CLP. Furthermore, Tregs may possess strong immunosuppressive
functions. The results of the current study indicated this, as they
identified an increased percentage of Tregs using flow cytometry
and increased FoxP3 concentration using ELISA.
BTG family members containing a specific BTG domain
inhibit cell proliferation (34).
BTG regulates cell cycle progression, inhibits proliferation,
promotes apoptosis and stimulates differentiation in multiple cell
types. The BTG family of proteins inhibit cell proliferation by
methylation. PRMT1 is a differentially-expressed protein that
serves a key role in this process. The BTG family proteins interact
with PRMT1 to increase its methyl-transferase activity (34–36).
PRMT1 activity is essential for growth factor-induced cell
differentiation, whereas blocking PRMT1 with the Box-C domain of
BTG1/2 induces apoptosis (35,36).
OX40 is a T cell activator that may promote the
survival and prolong the immune response of CD4+ T cells
at sites of inflammation. The co-stimulatory OX40 ligand is a
member of the tumor necrosis factor super family and possesses a
transmembrane segment, as well as an extracellular region (37). OX40 signaling synergizes with
Toll-like receptors to inhibit Tregs (37). Vu et al (38) demonstrated that co-stimulation with
OX40 inhibits Tregs.
The RT1 complex is a rat major histocompatibility
(MHC) antigen containing a class of highly polymorphic gene
clusters. Among them, the most typical are the MHC class I (RT1.A)
and class II (RT1.B) antigens. RT1.A is expressed at a high density
on lymphocytes (39,40). Tregs from the spleen of sepsis
survivors expressed CD4 and RT1.A, two proteins involved in the
OX40 signaling pathway, suggesting it may be a key negative
regulator of sepsis.
The Hippo signaling pathway controls tissue growth
and homeostasis and serves an essential role in innate immunity
(41–43). Transcriptional co-activator YAP1
(YAP) is a major downstream effector of this pathway that
translocates into the nucleus upon dephosphorylation, whereby it
induces expression of the genes that promote cell proliferation and
inhibit apoptosis (44,45). It has been demonstrated that YAP is a
functional link between the Hippo signaling pathway and
PI3K-mammalian target of rapamycin (mTOR), providing a molecular
basis for the coordination of the two pathways (46). mTOR is a serine/threonine kinase that
regulates multiple cellular functions in response to amino acids
and growth factors. mTOR regulates mRNA translation and cell cycle
progression via phosphorylation of p70S6K, a serine/threonine
kinase that phosphorylates the ribosomal S6 subunit, a component of
the 40S subunit of eukaryotic ribosomes (47,48).
Additionally, mTOR is a key factor in PI3K/AKT signaling and
activates downstream substrates to regulate cell growth (47,48).
PI3Ks are a family of lipid kinases, which are inositol lipid
products serving an important role in the signal transduction
pathways of cytokines, growth factors and other extracellular
matrix proteins (49). AKT inhibits
apoptosis by phosphorylating the Bad component of the Bad/B-cell
lymphoma-extra large (Bcl-XL) complex, thus facilitating cell
survival. Furthermore, AKT activates IκB kinase, leading to nuclear
factor κB activation and enhancing cell survival (50). AKT is involved in numerous cellular
processes, including energy storage, cell cycle progression,
protein synthesis and angiogenesis (49,50).
Protein phosphatase 2A (PP2A) is a ubiquitous enzyme
that promotes basal phosphatase activity to serve as a negative
regulator of cell growth and division (51,52). The
14-3-3 family of highly conserved proteins bind to phosphorylated
serine or threonine peptides to regulate cell growth and metabolic
processes (53). The present study
demonstrated that Ppp2r4 and Ywhaq were differentially expressed
and this differential expression was associated with upregulation
of the Hippo, P70S6K and PI3K/AKT signaling pathways to balance
cell apoptosis and proliferation.
VD3 is the biologically active form of vitamin D and
is considered to be a hormone. While the classic role of vitamin D
is the regulation of calcium and metabolism in bone, it also
exhibits immunomodulatory effects by targeting various immune
cells, including monocytes, macrophages, dendritic cells and T- and
B-lymphocytes (54,55). As well as being targets, immune cells
express vitamin D-activating enzymes, allowing local conversion of
inactive vitamin D into VD3 within the immune system (56). The identity of the enzyme that
catalyzes the hydroxylation of VD3 at carbon 25 remains unclear.
However, it has been suggested that cytochrome P450 (CYP) is the
rate-limiting enzyme in this pathway and hydroxylates VD3 to
calcidiol (57). Cytochrome P450
oxidoreductase is a differentially-expressed protein and is the
essential electron donor for all CYP enzymes and is responsible for
CYP activation (58,59). In Tregs in the spleen,
antiproliferative pathways, including cell cycle regulation by BTG
family proteins, coexist with proliferative pathways, such as VD3
biosynthesis signaling. This indicates that Tregs in the spleen may
be rebalanced 30 days following CLP. Flow cytometry demonstrated
that the percentage of splenic Tregs recovered to baseline levels
by day 30.
In conclusion, the present study investigated the
quality and quantity of Tregs in a long-term survival model of
sepsis. Surviving rats that appeared to have recovered from sepsis
exhibited a higher level of Tregs based on the results of cytokine
analysis 30 days following CLP. The changes observed in Tregs
harvested from the blood and spleen varied. Several biological
pathways were identified using a proteomics approach. Uncommon
proteins differentially expressed between the blood and spleen
resulted in different pathways being highly expressed. The
ERK/MAPK, integrin and actin cytoskeleton signaling pathways were
upregulated in the blood, whereas signaling pathways associated
with BTG family proteins (cell cycles regulators), OX40, Hippo,
P70S6K, PI3K/AKT and VD3 biosynthesis were upregulated in the
spleen. These results not only explain the mechanism by which Tregs
naturally recover but also indicate that changes in Tregs differ
between the blood and spleen. Differentially-expressed proteins
serving a role in these pathways provide insight into novel targets
for sepsis detection and therapy. Further studies on a larger
sample set are required to verify the results of the current study
and to confirm the roles of individual differentially-expressed
proteins.
Acknowledgements
The current study was performed in the Laboratory of
Molecular Biology of the Second Hospital of Dalian Medical
University and Dalian Institute of Chemical Physics, Chinese
Academy of Sciences (Dalian, China) and was supported by the
National Natural Science Foundation of China (Beijing, China,
awarded to J.X., grant no. 81171791).
References
|
1
|
Singer M, Deutschman CS, Seymour CW,
Shankar-Hari M, Annane D, Bauer M, Bellomo R, Bernard GR, Chiche
JD, Coopersmith CM, et al: The third international consensus
definitions for sepsis and septic shock (Sepsis-3). JAMA.
315:801–810. 2016. View Article : Google Scholar : PubMed/NCBI
|
|
2
|
Stoller J, Halpin L, Weis M, Aplin B, Qu
W, Georgescu C and Nazzal M: Epidemiology of severe sepsis:
2008–2012. J Crit Care. 31:58–62. 2016. View Article : Google Scholar : PubMed/NCBI
|
|
3
|
Yadav H and Cartin-Ceba R: Balance between
Hyperinflammation and Immunosuppression in Sepsis. Semin Respir
Crit Care Med. 37:42–50. 2016. View Article : Google Scholar : PubMed/NCBI
|
|
4
|
Hotchkiss RS, Monneret G and Payen D:
Sepsis-induced immunosuppression: From cellular dysfunctions to
immunotherapy. Nat Rev Immunol. 13:862–874. 2013. View Article : Google Scholar : PubMed/NCBI
|
|
5
|
Hotchkiss RS, Monneret G and Payen D:
Immunosuppression in sepsis: A novel understanding of the disorder
and a new therapeutic approach. Lancet Infect Dis. 13:260–268.
2013. View Article : Google Scholar : PubMed/NCBI
|
|
6
|
Attridge K and Walker LS: Homeostasis and
function of regulatory T cells (Tregs). in vivo: Lessons from
TCR-transgenic Tregs. Immunol Rev. 259:23–39. 2014. View Article : Google Scholar : PubMed/NCBI
|
|
7
|
Guo J and Zhou X: Regulatory T cells turn
pathogenic. Cell Mol Immunol. 12:525–532. 2015. View Article : Google Scholar : PubMed/NCBI
|
|
8
|
Leavy O: Regulatory T Cells: Distinct role
in tissue repair. Nat Rev Immunol. 15:596–597. 2015. View Article : Google Scholar : PubMed/NCBI
|
|
9
|
Cao C, Ma T, Chai YF and Shou ST: The role
of regulatory T cells in immune dysfunction during sepsis. World J
Emerg Med. 6:5–9. 2015. View Article : Google Scholar : PubMed/NCBI
|
|
10
|
Nascimento DC, Alves-Filho JC, Sônego F,
Fukada SY, Pereira MS, Benjamim C, Zamboni DS, Silva JS and Cunha
FQ: Role of regulatory T cells in long-term immune dysfunction
associated with severe sepsis. Crit Care Med. 38:1718–1725. 2010.
View Article : Google Scholar : PubMed/NCBI
|
|
11
|
Rudiger A, Dyson A, Felsmann K, Carré JE,
Taylor V, Hughes S, Clatworthy I, Protti A, Pellerin D, Lemm J, et
al: Early functional and transcriptomic changes in the myocardium
predict outcome in a long-term rat model of sepsis. Clin Sci
(Lond). 124:391–401. 2013. View Article : Google Scholar : PubMed/NCBI
|
|
12
|
Brealey D, Karyampudi S, Jacques TS,
Novelli M, Stidwill R, Taylor V, Smolenski RT and Singer M:
Mitochondrial dysfunction in a long-term rodent model of sepsis and
organ failure. Am J Physiol Regul Integr Comp Physiol.
286:R491–R497. 2004. View Article : Google Scholar : PubMed/NCBI
|
|
13
|
Lilley E, Armstrong R, Clark N, Gray P,
Hawkins P, Mason K, López-Salesansky N, Stark AK, Jackson SK,
Thiemermann C and Nandi M: Refinement of animal models of sepsis
and septic shock. Shock. 43:304–316. 2015. View Article : Google Scholar : PubMed/NCBI
|
|
14
|
Fink MP: Animal models of sepsis.
Virulence. 5:143–153. 2014. View Article : Google Scholar : PubMed/NCBI
|
|
15
|
He X, Wei Z, Zhou E, Chen L, Kou J, Wang J
and Yang Z: Baicalein attenuates inflammatory responses by
suppressing TLR4 mediated NF-κB and MAPK signaling pathways in
LPS-induced mastitis in mice. Int Immunopharmacol. 28:470–476.
2015. View Article : Google Scholar : PubMed/NCBI
|
|
16
|
Kim J, Yang HY and Jang YS: A G
protein-associated ERK pathway is involved in LPS-induced
proliferation and a PTK-associated p38 MAPK pathway is involved in
LPS-induced differentiation in resting B cells. Mol Immunol.
43:1232–1242. 2006. View Article : Google Scholar : PubMed/NCBI
|
|
17
|
Gonzalo S, Grasa L, Arruebo MP, Plaza MÁ
and Murillo MD: Extracellular signal-regulated kinase (ERK) is
involved in LPS-induced disturbances in intestinal motility.
Neurogastroenterol Motil. 23:e80–e90. 2011. View Article : Google Scholar : PubMed/NCBI
|
|
18
|
Asati V, Mahapatra DK and Bharti SK:
PI3K/Akt/mTOR and Ras/Raf/MEK/ERK signaling pathways inhibitors as
anticancer agents: Structural and pharmacological perspectives. Eur
J Med Chem. 109:314–341. 2016. View Article : Google Scholar : PubMed/NCBI
|
|
19
|
Yamashita M, Shinnakasu R, Asou H, Kimura
M, Hasegawa A, Hashimoto K, Hatano N, Ogata M and Nakayama T:
Ras-ERK MAPK cascade regulates GATA3 stability and Th2
differentiation through ubiquitin-proteasome pathway. J Biol Chem.
280:29409–29419. 2005. View Article : Google Scholar : PubMed/NCBI
|
|
20
|
Knight T and Irving JA: Ras/Raf/MEK/ERK
pathway activation in childhood acute lymphoblastic leukemia and
its therapeutic targeting. Front Oncol. 4:1602014. View Article : Google Scholar : PubMed/NCBI
|
|
21
|
Fischer TH, Gatling MN, McCormick F, Duffy
CM and White GC II: Incorporation of Rap 1b into the platelet
cytoskeleton is dependent on thrombin activation and extracellular
calcium. J Biol Chem. 269:17257–17261. 1994.PubMed/NCBI
|
|
22
|
Naci D and Aoudjit F: Alpha2beta1 integrin
promotes T cell survival and migration through the concomitant
activation of ERK/Mcl-1 and p38 MAPK pathways. Cell Signal.
26:2008–2015. 2014. View Article : Google Scholar : PubMed/NCBI
|
|
23
|
Gendron S, Couture J and Aoudjit F:
Integrin alpha2beta1 inhibits Fas-mediated apoptosis in T
lymphocytes by protein phosphatase 2A-dependent activation of the
MAPK/ERK pathway. J Biol Chem. 278:48633–48643. 2003. View Article : Google Scholar : PubMed/NCBI
|
|
24
|
Iwamoto DV and Calderwood DA: Regulation
of integrin-mediated adhesions. Curr Opin Cell Biol. 36:41–47.
2015. View Article : Google Scholar : PubMed/NCBI
|
|
25
|
Mattila PK, Batista FD and Treanor B:
Dynamics of the actin cytoskeleton mediates receptor cross talk: An
emerging concept in tuning receptor signaling. J Cell Biol.
212:267–280. 2016. View Article : Google Scholar : PubMed/NCBI
|
|
26
|
Hirata H, Chiam KH, Lim CT and Sokabe M:
Actin flow and talin dynamics govern rigidity sensing in
actin-integrin linkage through talin extension. J R Soc Interface.
11:pii: 20140734. 2014. View Article : Google Scholar : PubMed/NCBI
|
|
27
|
Critchley DR and Gingras AR: Talin at a
glance. J Cell Sci. 121:1345–1347. 2008. View Article : Google Scholar : PubMed/NCBI
|
|
28
|
Priddle H, Hemmings L, Monkley S, Woods A,
Patel B, Sutton D, Dunn GA, Zicha D and Critchley DR: Disruption of
the talin gene compromises focal adhesion assembly in
undifferentiated but not differentiated embryonic stem cells. J
Cell Biol. 142:1121–1133. 1998. View Article : Google Scholar : PubMed/NCBI
|
|
29
|
Zhao P, Ma W, Hu Z, Zang L, Tian Z and
Zhang K: Filamin A (FLNA) modulates chemosensitivity to docetaxel
in triple-negative breast cancer through the MAPK/ERK pathway.
Tumour Biol. 37:5107–5115. 2016. View Article : Google Scholar : PubMed/NCBI
|
|
30
|
Shao QQ, Zhang TP, Zhao WJ, Liu ZW, You L,
Zhou L, Guo JC and Zhao YP: Filamin A: Insights into its Exact Role
in Cancers. Pathol Oncol Res. 22:245–252. 2016. View Article : Google Scholar : PubMed/NCBI
|
|
31
|
Truong T, Shams H and Mofrad MR:
Mechanisms of integrin and filamin binding and their interplay with
talin during early focal adhesion formation. Integr Biol (Camb).
7:1285–1296. 2015. View Article : Google Scholar : PubMed/NCBI
|
|
32
|
De Franceschi N and Ivaska J: Integrin
bondage: Filamin takes control. Nat Struct Mol Biol. 22:355–357.
2015. View Article : Google Scholar : PubMed/NCBI
|
|
33
|
Modarres HP and Mofradt MR: Filamin: A
structural and functional biomolecule with important roles in cell
biology, signaling and mechanics. Mol Cell Biomech. 11:39–65.
2014.PubMed/NCBI
|
|
34
|
Winkler GS: The mammalian
anti-proliferative BTG/Tob protein family. J Cell Physiol.
222:66–72. 2010. View Article : Google Scholar : PubMed/NCBI
|
|
35
|
Berthet C, Guéhenneux F, Revol V, Samarut
C, Lukaszewicz A, Dehay C, Dumontet C, Magaud JP and Rouault JP:
Interaction of PRMT1 with BTG/TOB proteins in cell signalling:
Molecular analysis and functional aspects. Genes Cells. 7:29–39.
2002. View Article : Google Scholar : PubMed/NCBI
|
|
36
|
Liu C, Tao T, Xu B, Lu K, Zhang L, Jiang
L, Chen S, Liu D, Zhang X, Cao N and Chen M: BTG1 potentiates
apoptosis and suppresses proliferation in renal cell carcinoma by
interacting with PRMT1. Oncol Lett. 10:619–624. 2015.PubMed/NCBI
|
|
37
|
Voo KS, Foglietta M, Percivalle E, Chu F,
Nattamai D, Harline M, Lee ST, Bover L, Lin HY, Baladandayuthapani
V, et al: Selective targeting of Toll-like receptors and OX40
inhibit regulatory T-cell function in follicular lymphoma. Int J
Cancer. 135:2834–2846. 2014. View Article : Google Scholar : PubMed/NCBI
|
|
38
|
Vu MD, Xiao X, Gao W, Degauque N, Chen M,
Kroemer A, Killeen N, Ishii N and Li XC: OX40 costimulation turns
off Foxp3+ Tregs. Blood. 110:2501–2510. 2007. View Article : Google Scholar : PubMed/NCBI
|
|
39
|
Hawse WF, Gloor BE, Ayres CM, Kho K, Nuter
E and Baker BM: Peptide modulation of class I major
histocompatibility complex protein molecular flexibility and the
implications for immune recognition. J Biol Chem. 288:24372–24381.
2013. View Article : Google Scholar : PubMed/NCBI
|
|
40
|
Rudolph MG, Stanfield RL and Wilson IA:
How TCRs bind MHCs, peptides and coreceptors. Annu Rev Immunol.
24:419–466. 2006. View Article : Google Scholar : PubMed/NCBI
|
|
41
|
Liu B, Zheng Y, Yin F, Yu J, Silverman N
and Pan D: Toll receptor-mediated hippo signaling controls innate
immunity in drosophila. Cell. 164:406–419. 2016. View Article : Google Scholar : PubMed/NCBI
|
|
42
|
Ye S and Eisinger-Mathason TS: Targeting
the Hippo pathway: Clinical implications and therapeutics.
Pharmacol Res. 103:270–278. 2016. View Article : Google Scholar : PubMed/NCBI
|
|
43
|
Mo JS, Park HW and Guan KL: The Hippo
signaling pathway in stem cell biology and cancer. EMBO Rep.
15:642–656. 2014.PubMed/NCBI
|
|
44
|
Pan D: The hippo signaling pathway in
development and cancer. Dev Cell. 19:491–505. 2010. View Article : Google Scholar : PubMed/NCBI
|
|
45
|
Yu FX and Guan KL: The Hippo pathway:
Regulators and regulations. Genes Dev. 27:355–371. 2013. View Article : Google Scholar : PubMed/NCBI
|
|
46
|
Tumaneng K, Schlegelmilch K, Russell RC,
Yimlamai D, Basnet H, Mahadevan N, Fitamant J, Bardeesy N, Camargo
FD and Guan KL: YAP mediates crosstalk between the Hippo and
PI(3)K-TOR pathways by suppressing PTEN via miR-29. Nat Cell Biol.
14:1322–1329. 2012. View Article : Google Scholar : PubMed/NCBI
|
|
47
|
Liko D and Hall MN: mTOR in health and in
sickness. J Mol Med (Berl). 93:1061–1073. 2015. View Article : Google Scholar : PubMed/NCBI
|
|
48
|
Sandilands E, Schoenherr C and Frame MC:
p70S6K is regulated by focal adhesion kinase and is required for
Src-selective autophagy. Cell Signal. 27:1816–1823. 2015.
View Article : Google Scholar : PubMed/NCBI
|
|
49
|
Tabe Y, Jin L, Konopleva M, Shikami M,
Kimura S, Andreeff M, Raffeld M and Miida T: Class IA PI3K
inhibition inhibits cell growth and proliferation in mantlecell
lymphoma. Acta Haematol. 131:59–69. 2014. View Article : Google Scholar : PubMed/NCBI
|
|
50
|
Vivanco I and Sawyers CL: The
phosphatidylinositol 3-kinase AKT pathway in human cancer. Nat Rev
Cancer. 2:489–501. 2002. View
Article : Google Scholar : PubMed/NCBI
|
|
51
|
Ribeiro PS, Josué F, Wepf A, Wehr MC,
Rinner O, Kelly G, Tapon N and Gstaiger M: Combined functional
genomic and proteomic approaches identify a PP2A complex as a
negative regulator of Hippo signaling. Mol Cell. 39:521–534. 2010.
View Article : Google Scholar : PubMed/NCBI
|
|
52
|
Zeng Q, Zhang H, Qin J, Xu Z, Gui L, Liu
B, Liu C, Xu C, Liu W, Zhang S, et al: Rapamycin inhibits
BAFF-stimulated cell proliferation and survival by suppressing
mTOR-mediated PP2A-Erk1/2 signaling pathway in normal and
neoplastic B-lymphoid cells. Cell Mol Life Sci. 72:4867–4884. 2015.
View Article : Google Scholar : PubMed/NCBI
|
|
53
|
Li Z, Tang J and Guo F: Identification of
14-3-3 proteins phosphopeptide-binding specificity using an
affinity-based computational approach. PLoS One.
11:e1474672016.
|
|
54
|
Bikle D: Nonclassic actions of vitamin D.
J Clin Endocrinol Metab. 94:26–34. 2009. View Article : Google Scholar : PubMed/NCBI
|
|
55
|
Verstuyf A, Carmeliet G, Bouillon R and
Mathieu C: Vitamin D: A pleiotropic hormone. Kidney Int.
78:140–145. 2010. View Article : Google Scholar : PubMed/NCBI
|
|
56
|
Baeke F, Takiishi T, Korf H, Gysemans C
and Mathieu C: Vitamin D: Modulator of the immune system. Curr Opin
Pharmacol. 10:482–496. 2010. View Article : Google Scholar : PubMed/NCBI
|
|
57
|
Cheng JB, Levine MA, Bell NH, Mangelsdorf
DJ and Russell DW: Genetic evidence that the human CYP2R1 enzyme is
a key vitamin D 25-hydroxylase. Proc Natl Acad Sci USA. 101:pp.
7711–7715. 2004, View Article : Google Scholar : PubMed/NCBI
|
|
58
|
Zawaira A, Gallotta M, Beeton-Kempen N,
Coulson L, Marais P, Kuttel M and Blackburn J: Exhaustive
computational search of ionic-charge clusters that mediate
interactions between mammalian cytochrome P450 (CYP) and
P450-oxidoreductase (POR) proteins. Comput Biol Chem. 34:42–52.
2010. View Article : Google Scholar : PubMed/NCBI
|
|
59
|
Gocek E, Marchwicka A, Bujko K and
Marcinkowska E: NADPH-cytochrome P450 reductase is regulated by
all-trans retinoic acid and by 1,25-dihydroxyvitamin D3 in human
acute myeloid leukemia cells. PLoS One. 9:e917522014. View Article : Google Scholar : PubMed/NCBI
|