Introduction
The introduction of stent by Puel and Sigwart in
clinical practice marked a new era in operational cardiology
(1). Bare-metal stents (BMS) or
drug-eluting stents (DES) are frequently used in medicine, with
millions of patients treated worldwide (2,3). The use
of DES has been shown more effective than BMS in the reduction of
restenosis (4). In particular,
paclitaxel-eluting stent (PES) has been shown remarkably effective
compared with BMS. PES has been approved by the US Food and Drug
Administration for treating coronary artery disease (CAD) (5), although it is now rarely used in the US
and Europe due to the superiority of second-generation stents
(zotarolimus and everolimus-eluting stents) (6). The purpose of this study was to compare
the putative molecular mechanism induced by PES and BES in denuded
human left internal mammary arteries (LIMA).
Network biology has been applied to study
cardiovascular diseases, such as coronary heart disease (7) atherosclerosis (8) and heart failure (9). Understanding the molecular networks may
provide important insights into the effect of PES and BMS in LIMA.
Several methods have been developed to construct gene regulator
networks or modules, including Bayesian probabilistic network
method (10), Genetic Network
Expansion SYStem (11) and Minreg
method (12). The iMDM algorithm is
another method to identify both unique and shared gene modules
across multiple differential co-expression networks (DCNs)
(13). This method showed higher
accuracy in inferring genes and modules compared with other method.
In multiple conditions, the multiple differential modules (M-DMs)
algorithm revealed dynamic changes in both gene activity and
connectivity (13).
To date, microarrays have been a powerful tool to
analyze gene expression levels and gene functions (14). MicroRNA microarrays have been used to
explore the role of miRNA in different pathophysiological states.
miRNA expression was first used to construct networks to identify
important miRNA cliques (15).
Besides, miRNA microarray can be used to investigate functional
links between miRNAs by analyzing conserved miRNA co-expression
relationships (16).
In the present study, we applied iMDM algorithm to
analyze microarray data to compare molecular mechanism in LIMA
induced by PES and BMS. We constructed DCNs by mapping genes to
protein-protein interaction (PPI) data. The iMDM algorithm was used
to identify differential modules. The Gene Ontology (GO) and
pathway were applied for enrichment analysis. This method may
provide new insights to the comparison of BMS and PES in LIMA.
Materials and methods
Datasets
Gene expression data
Microarray gene expression data of E-GEOD-19136 was
obtained from ArrayExpress database. The data indicated gene
expression response to the implantation of drug
(paclitaxel)-eluting or BMS in denuded human LIMA. Human LIMA was
divided into three segments and two of the segments were fitted
with either a PES or a BMS. The data includes three groups, control
(n=4), PES (n=4), and BMS (n=4).
Gene expression profiling was generated from the
platform of (HG-U133_Plus_2) Affymetrix Human Genome U133 Plus 2.0
Array. The title was ‘Gene expression response to implanted drug
(paclitaxel)-eluting or BMS in denuded human LIMA’.
All the referred experiment samples were obtained
with informed consent of the patients and verified by the Ethics
Committee of the First Hospital of Zibo (Shandong, China).
Data preprocessing
To eliminate influences of nonspecific
hybridization, background was corrected with RMA (17). After data were normalized with
‘quantiles’ (18), PM/MM correction
was conducted with MAS method (19),
and medianpolish was conducted for summarizing data (20).
According to the platform annotation files, probes
were mapped to gene symbols. If more than one probe was mapped to a
single gene, the mean level of probes was calculated as the final
gene expression level. In total, 20,545 genes were obtained.
PPI network construction
PPI data were obtained from Search Tool for the
Retrieval of Interacting Genes/Proteins database (http://string-db.org/) (21), including 15,186 genes and 181,789
interactions. We selected the PPI which contains the same genes
with the microarray data for further analysis. In total, 14,194
genes and 166,370 PPI were obtained. After all the interactions
were performed Pearson's correlation analysis, the edge with an
absolute value more than δ (δ=0.95) was selected, including 16,813
edges and 4,504 nodes. These edges were used to construct DCNs.
Thus, two modules were obtained, module 1 indicating PES and 2
indicating BMS group. They had the same genes in the networks.
Each gene in the DCN was analyzed using one-sided
t-test in the baseline and disease conditions. The weight was
calculated using the following formula,
wi,j={(logpi+logpj)1/2(2*maxl∈v|logpl)1/2,ifcor(i,j)≥δ0,ifcor(i,j)<δ
where V indicates the node set in the network,
pi and pj are P-values of differential
expression for genes i and j.
Identification of multiple
differential modules
To identify M-DM, we adapted the recently developed
M-module algorithm (13) to analyze
genes in each DCN. It was generally divided in three steps, as
described in the following.
Seed prioritization
For each network G = (V, E) (1≤k≤M) with an
adjacency matrix A= (aij)nxn, we applied a
function to calculate the importance of gene i in the corresponding
network,
g(i)=∑j∈N(i)Aij′g(j)g(i)=z–score
where N(i) denotes the set of neighbors of gene i in
G; A′ denotes the degree normalized weighted adjacency matrix
A′=D−1/2AD1/2 where D is the diagonal matrix
of A.
For each gene in DCN, after ranking genes according
to the mean value of z-score, we selected the top 1% genes as the
seed genes. Finally, 45 seed genes were obtained.
Module search by seed expansion
For an indicated gene v ∊ V, it was considered as a
differential module C. The neighbors of gene i in the network was
added to the module, generating a new module C′. Then we calculated
the entropy for the connectivity of vertex i to C using the
formula,
Hk(Ci)=–pi[k]logpi[k]–(1–pi[k])log(1–pi[k])
pi[k]=Lk(i)/(L¯k(i)+Lk(i))Lk(i)=∑j≠i,j∈Caijk
where Lk(i) denotes total weight between
gene i and other gene in the module C of network Gk.
LK(i) denotes the weight between gene i and genes
outside of module C.
Hk(C)=∑i∈CH(Ci)
The entropy for C across all networks and normalized
for the size of C is
H(C)=(∑k=1MHk(C))/|c|
The connectivity variability between moule C and C′
was calculated according to H (C′,C)=H(C′)-H(C).
If H (C′,C)>0, the gene u increased connectivity
of module C.
Then the neighbor genes which may increase H were
added to the module C.
Refinement of candidate modules
The M-modules with a size less than five were
removed.
Overlapping M-modules with a Jaccard index more than
0.5 were merged to one module.
Finally, 38 candidate modules were identified.
Statistical significance of M-DMs
The statistical significance test was performed
using the null score distribution of M-DMs. Randomly selected
16,813 from 166,370 edges and constructed a random network. After
100 times random construction, 5,154 modules were obtained. The
empirical P-value of an M-DM was defined as the probability of the
module having the observed score or smaller by chance. After
corrected by Benjamini and Hochberg (22), an adjusted P-value <0.05 was
considered to indicate a statistically significant difference.
In total, 17 modules with P<0.05 were identified
as significant differential modules in each group.
Quantification of connectivity
dynamics of shared M-DMs
Each M-DM with M >2 has multiple component
modules from different DCNs. The Module Connectivity Dynamic Score
(MCDS) was applied to quantify the change in the connectivity of
component modules.
For a given M-DM C whose adjacent matrices are
denoted as
ΔAi,i+1C=‖AiC–Ai+1C‖2/|C|τ(AC)=∑i=1M–1ΔAi,i+1C/(M–1)
where ||·||2 is the matrix L2 norm.
τ(AC) denotes the overall MCDS of an M-DM.
The statistical analysis is computed in similar way
with that in M-DMs in Procedure 2.4. An adjusted P-value <0.05
was considered to indicate a statistically significant
difference.
Enrichment analysis of M-DMs
Gene Ontology enrichment analysis
GO is a useful tool for collecting a large number
of gene annotation terms (23).
P=0.01 was considered as a threshold value. Genes in M-DMs were
enriched to GO category according to Biological Process function.
After enrichment analysis, two significant modules were obtained,
module 1 indicating PES and module 2 indicating BMS group.
Pathway enrichment analysis
Pathways were obtained from Kyoto Encyclopedia of
Genes and Genomes (KEGG) pathway database (http://www.genome.jp/kegg/). Fisher's exact test was
applied to identify pathways in the differential modules. The
pathways with adjusted P<0.05 were considered the enriched
pathways in differential modules.
Results
DCNs construction
With the PPI data and microarray data, we selected
the intersection set to construct DCNs using the edges at the
criteria of Pearson's correlation coefficient >0.95. Two DCNs
were obtained, with the same node set but different edge set,
module 1 indicating PES and module 2 indicating BMS group.
M-DM construction
Genes were calculated for the importance in DCNs.
Based on the average of z-scores, the top 1% genes were selected as
seed genes, in total 45 seed genes, of which eight genes were found
with average scores >400, as shown in Table I.
 | Table I.Seed genes were identified with
average z-score >400. |
Table I.
Seed genes were identified with
average z-score >400.
| Node | z-score 1 | z-score 2 | Average |
|---|
| CUL3 | 1069.576 | 978.9798 | 1024.278 |
| APP | 851.2247 | 829.1976 | 840.2112 |
| STAU1 | 588.7511 | 609.4044 | 599.0777 |
| SYNCRIP | 619.3264 | 523.9833 | 571.6549 |
| CUL7 | 395.7259 | 648.4051 | 522.0655 |
| CUL4B | 401.4574 | 602.1461 | 501.8017 |
| HNRNPR | 470.2798 | 346.0184 | 408.1491 |
| HSPA9 | 405.5541 | 407.5701 | 406.5621 |
With these seed genes, we performed module search
and refinement, generating 38 modules. After statistical analysis,
17 candidate differential modules were obtained with adjusted
P<0.05. Then connectivity dynamics of M-DMs were quantified
using MCDS. At an MCDS P-value cut-off of 0.05, two M-DMs were
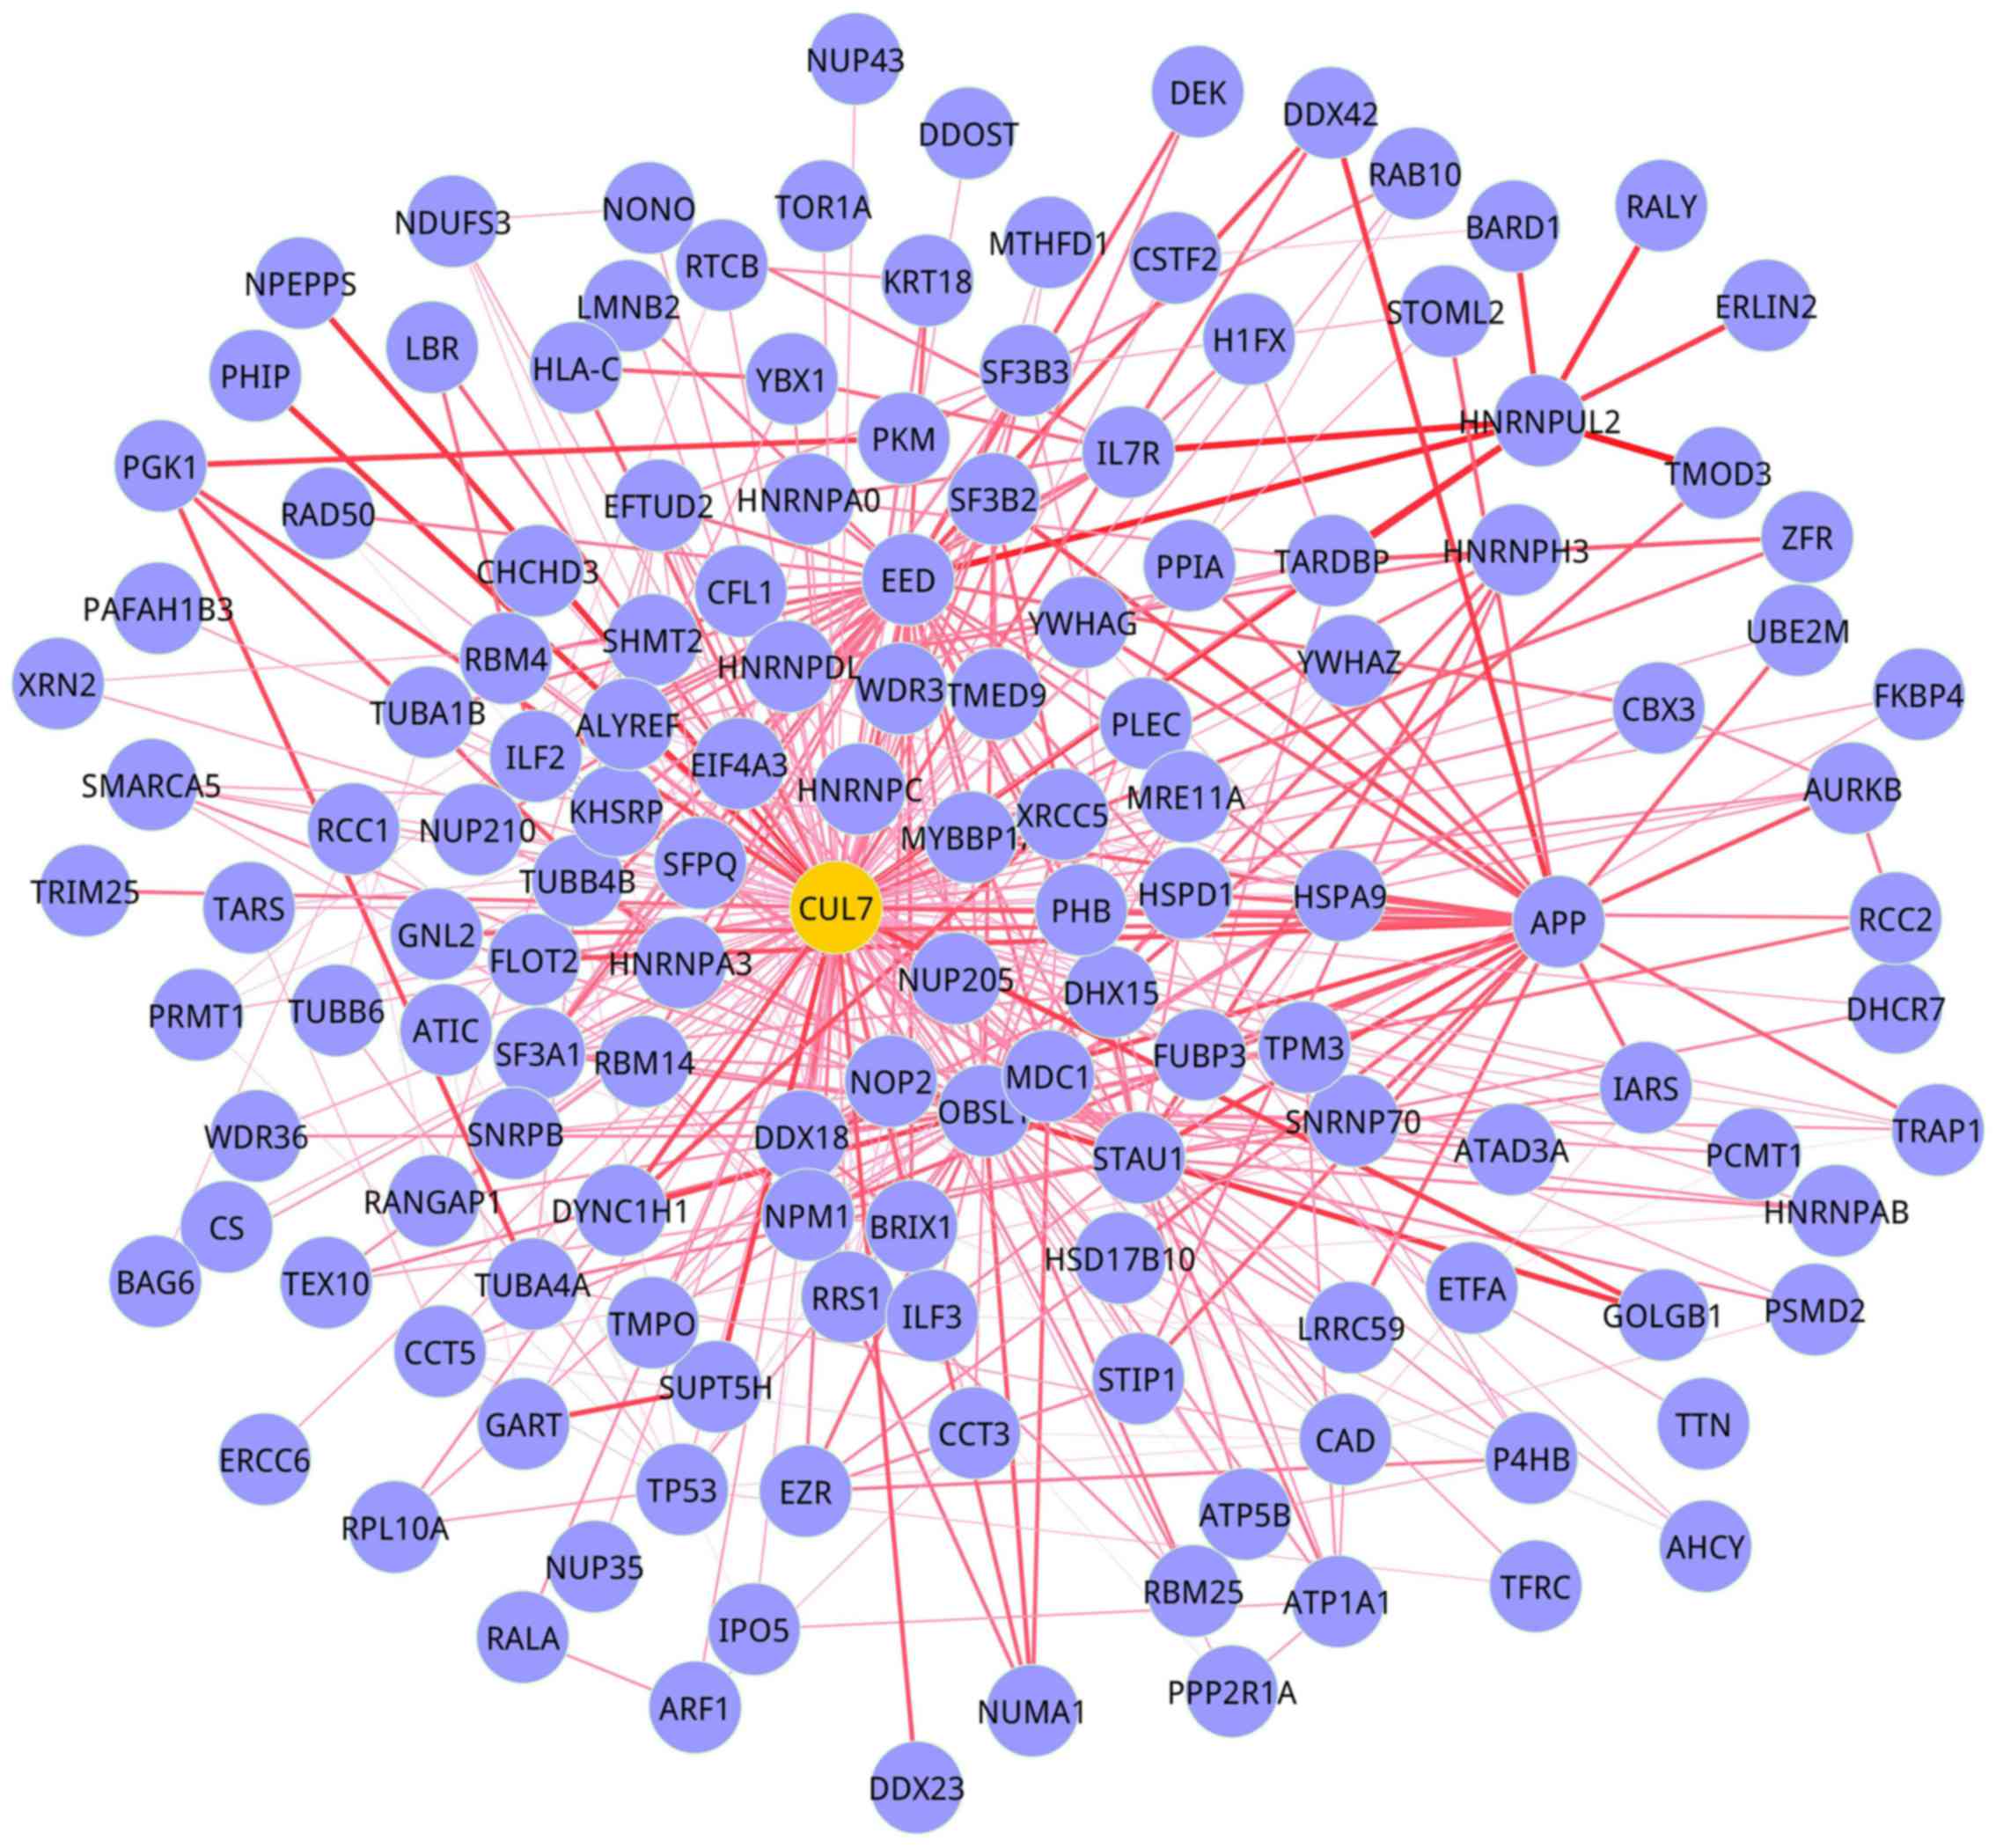
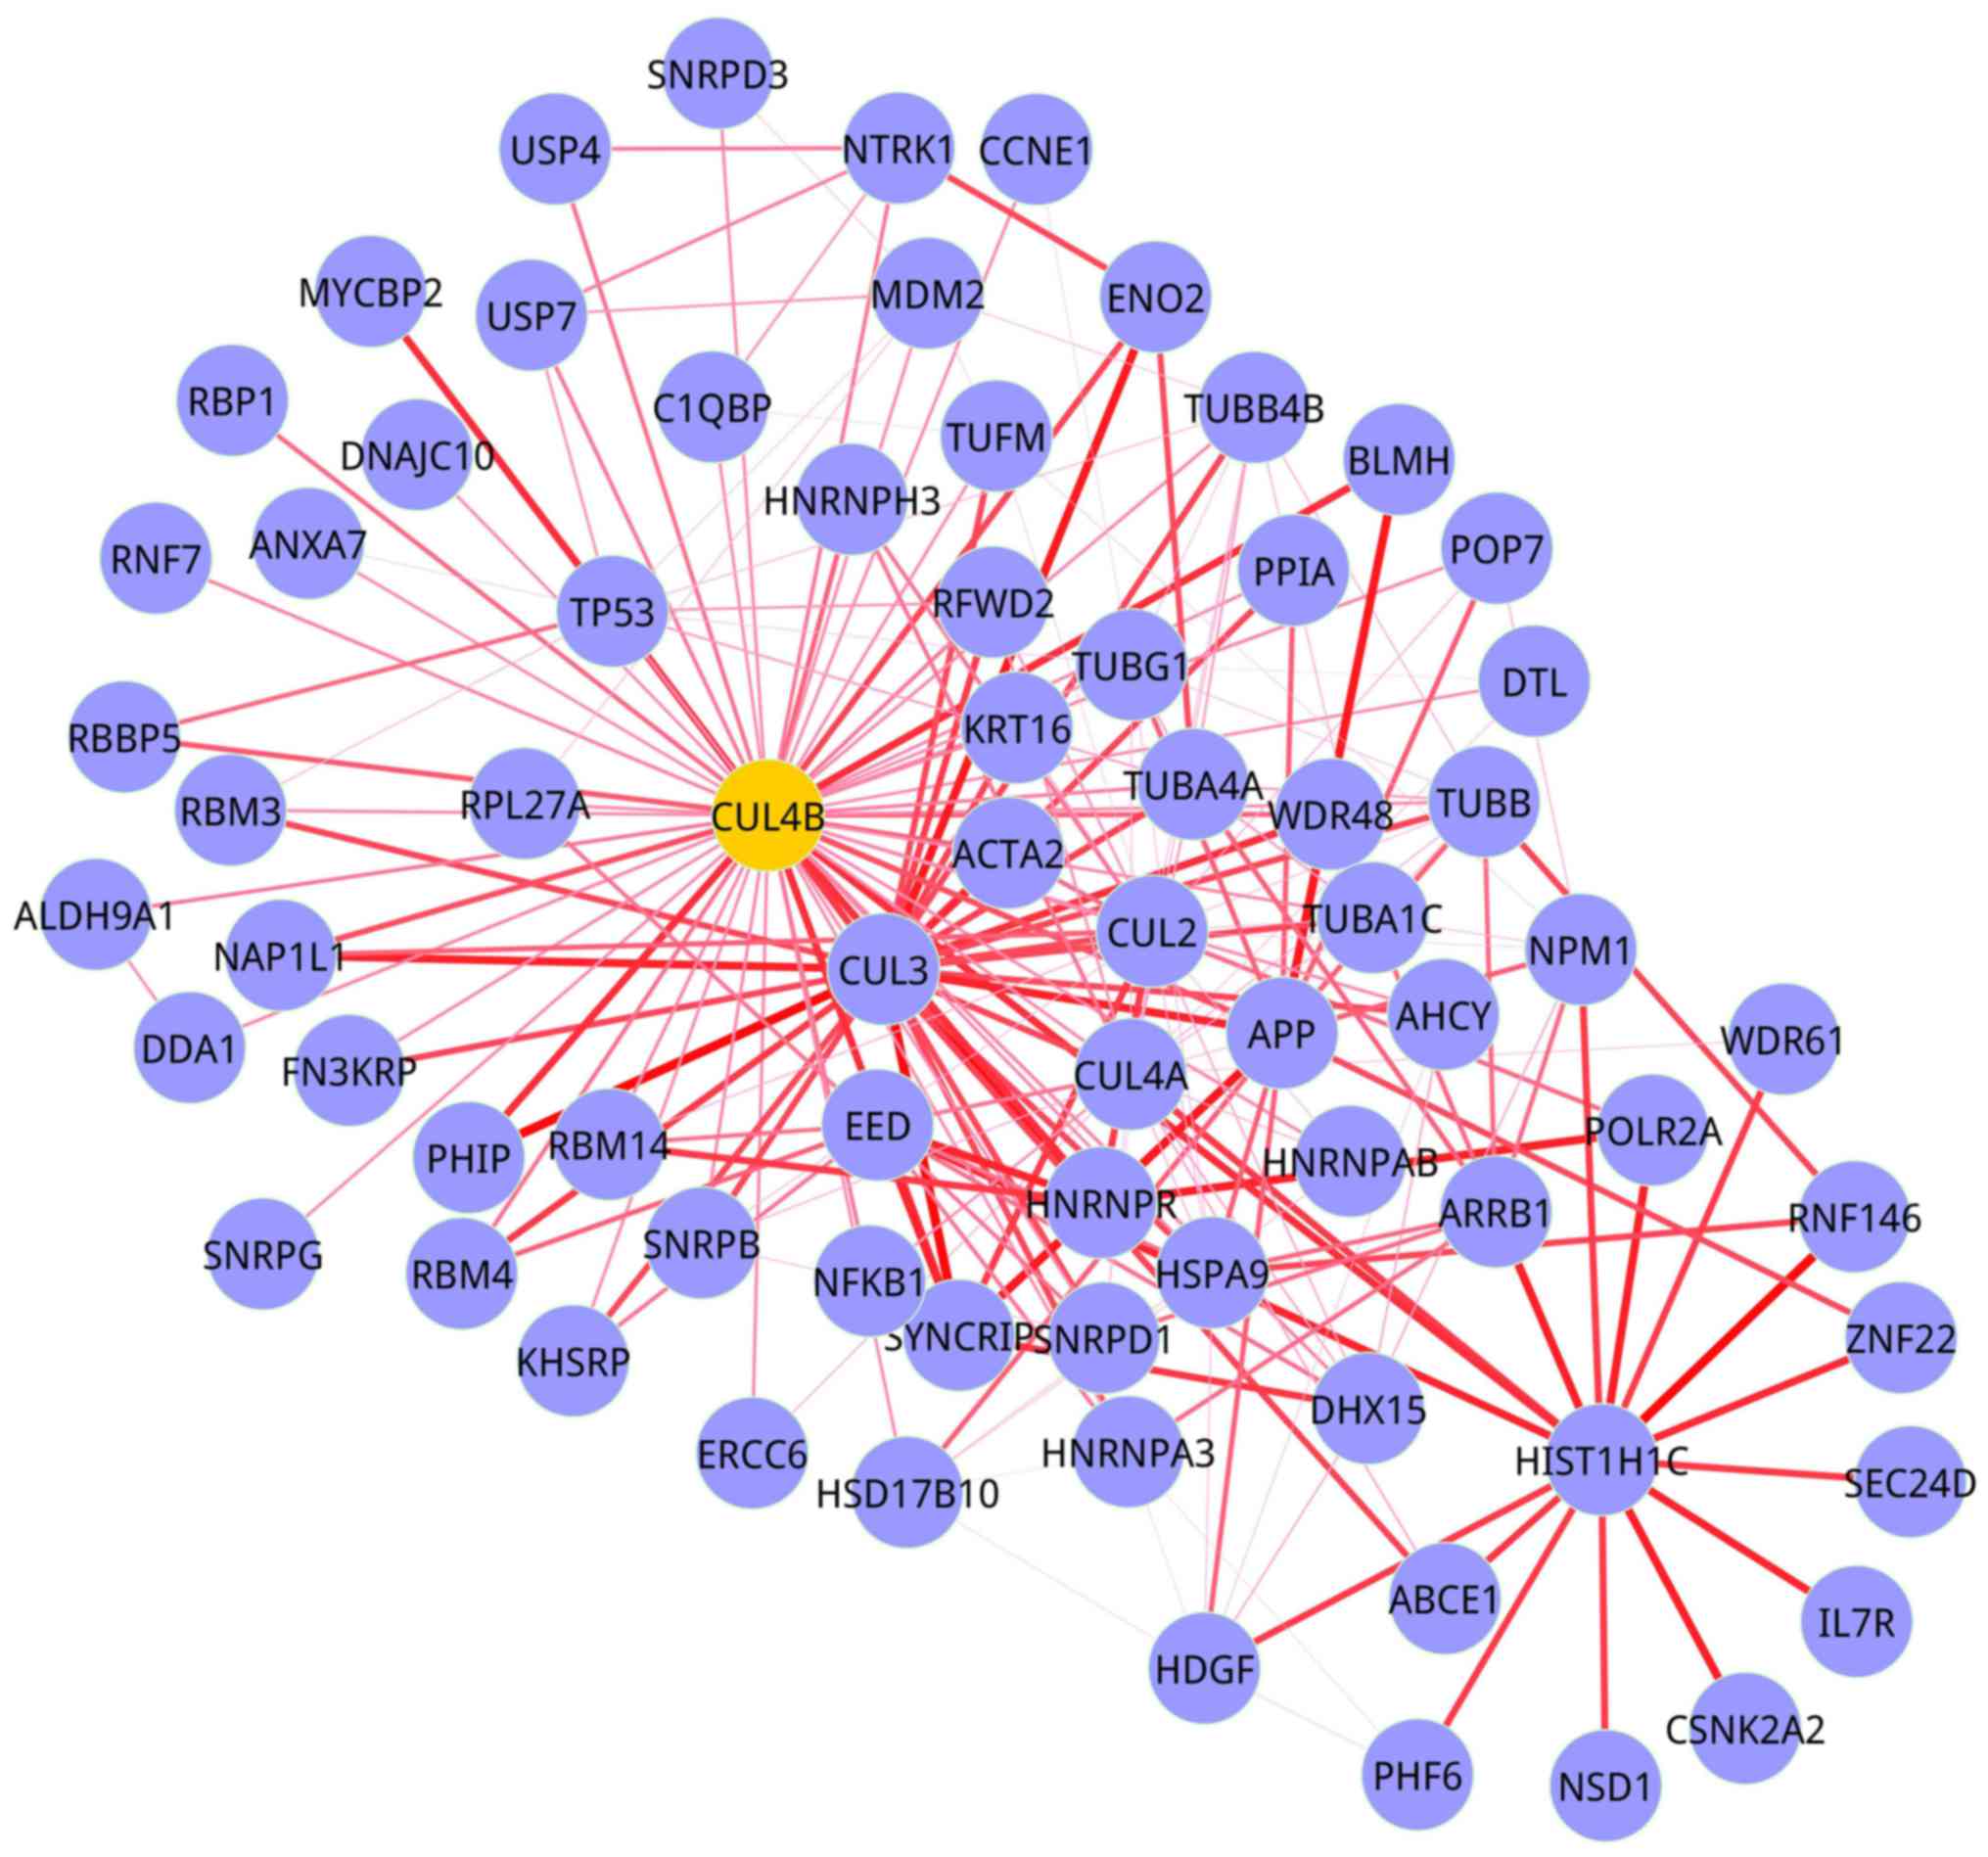
identified with a major change of connectivity (Table II). In module 1 (PES group), there
were 142 nodes and 460 edges (Fig.
1). In module 2 (BMS group), there were 73 nodes and 222 edges
(Fig. 2).
| Table II.Two M-DMs were identified with a
major change of connectivity. |
Table II.
Two M-DMs were identified with a
major change of connectivity.
|
|
|
|
| Adjusted
P-value |
|---|
|
|
|
|
|
|
|---|
| Module | Seed gene | Entropy | MCDS | Entropy | MCDS |
|---|
| 1 | CUL7 | 0.766905 | 0.207211 | 0 | 0.034 |
| 2 | CUL4B | 0.743426 | 0.277968 | 0 | 0.0069 |
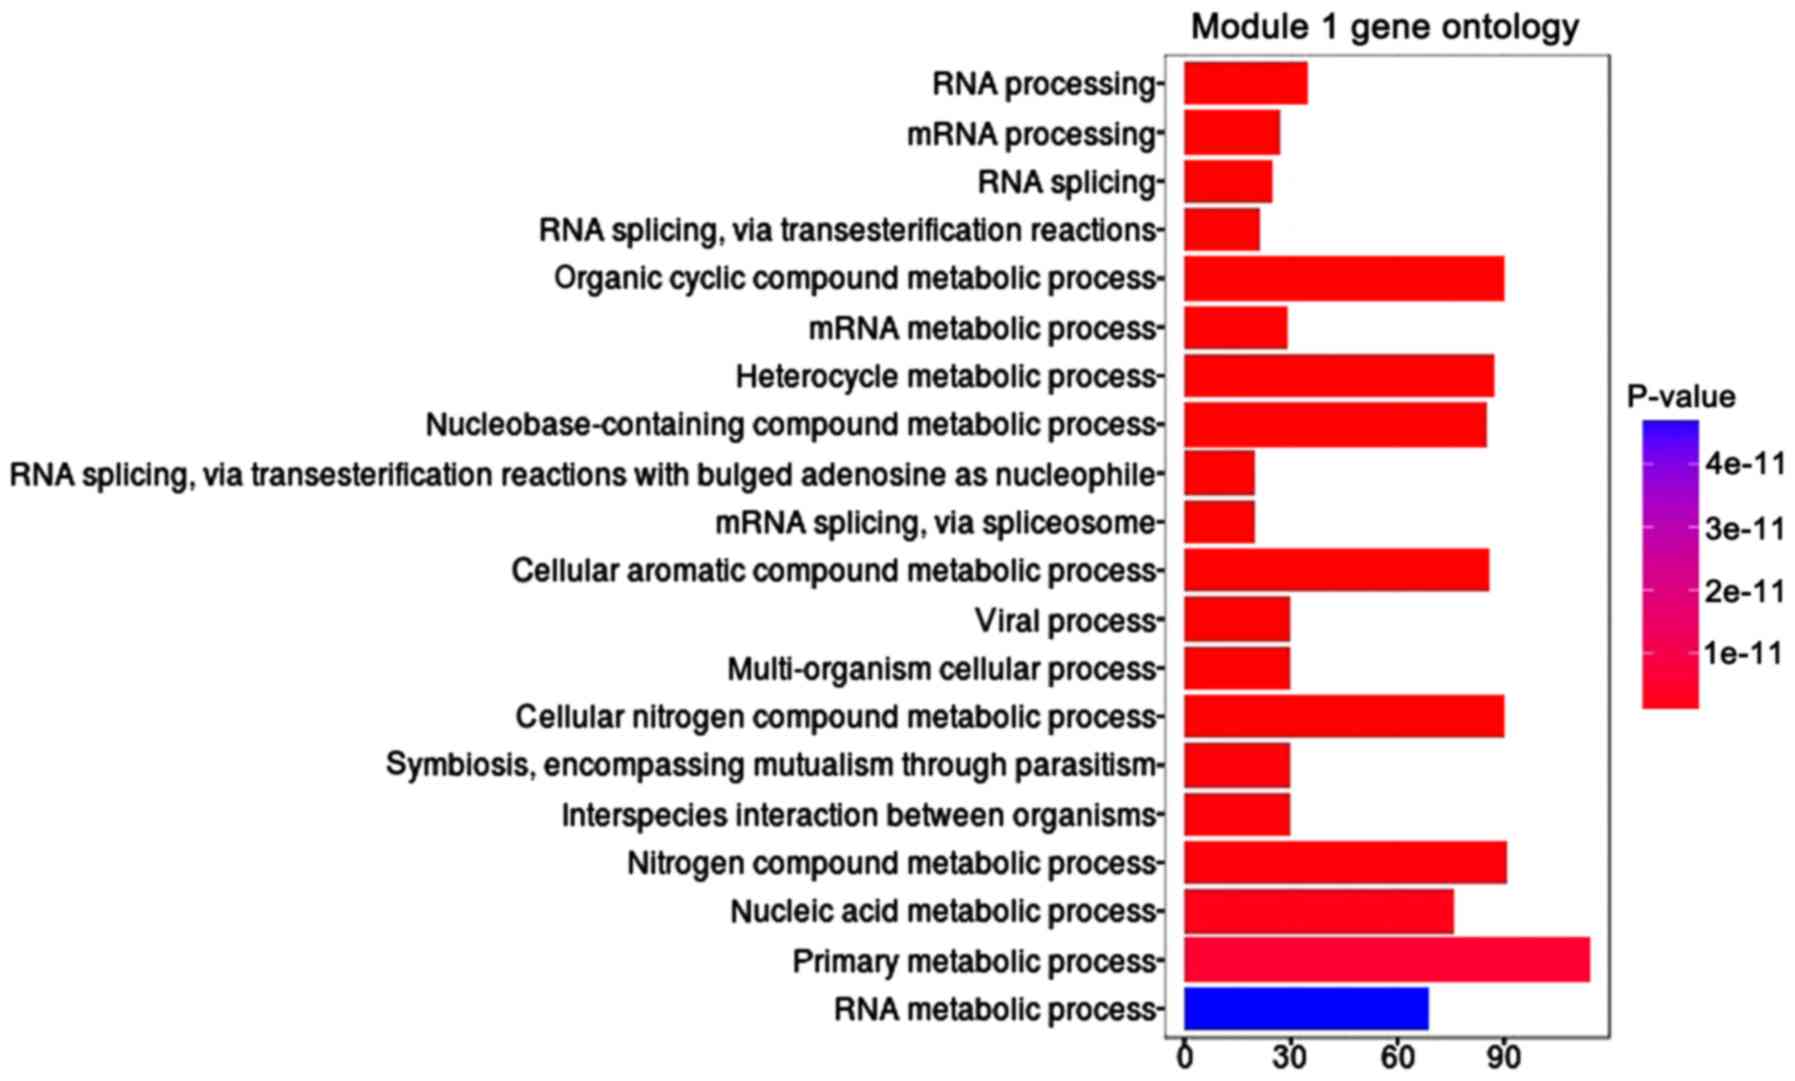
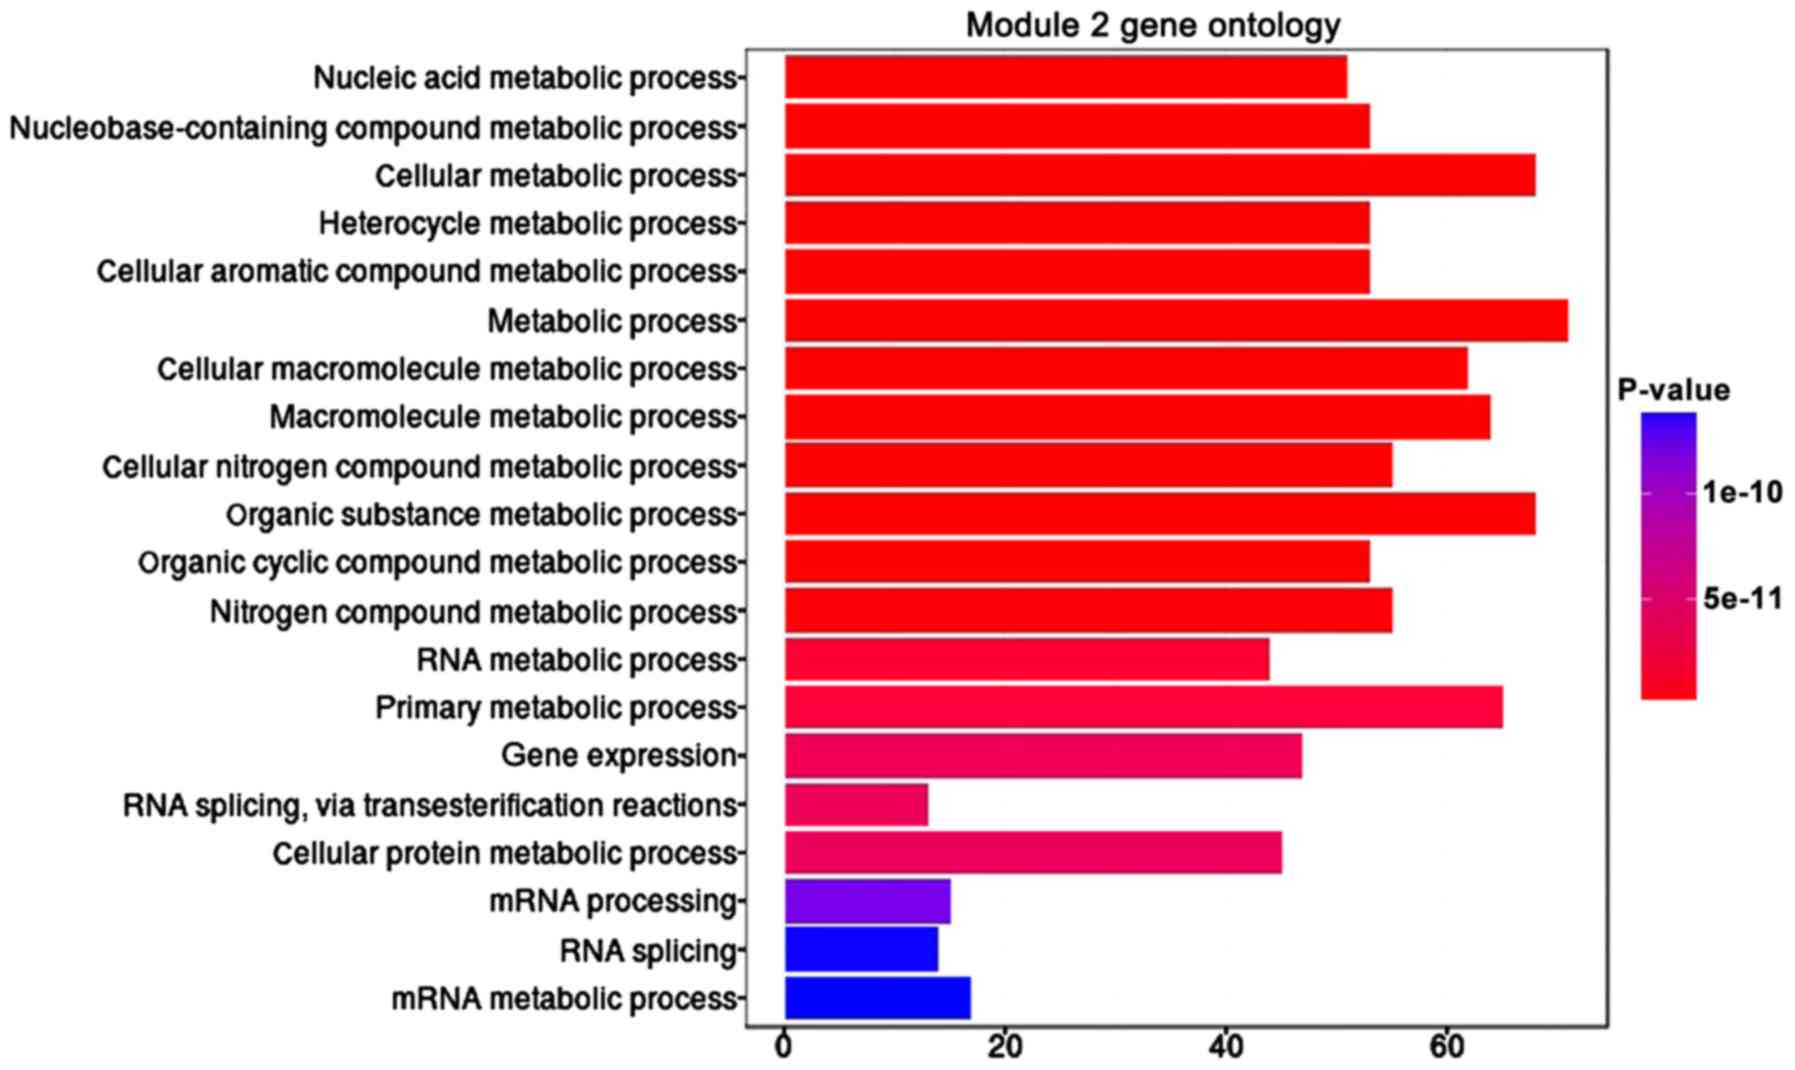
GO enrichment analysis
At the P-value cut-off of 0.05, the enrichment of
M-DMs genes in the GO biological process was obtained. In module 1,
the top 20 significant biological processes are presented in
Fig. 3, of which RNA processing was
the most significant enrichment of biological process and primary
metabolic process was the highest enrichment of biological process.
In module 2, the top 20 significant biological processes were
presented in Fig. 4, of which
nucleic acid metabolic was the most significant enrichment of
biological and metabolic was the highest enrichment of biological
process.
Pathway enrichment analysis
Following the KEGG pathway enrichment analysis for
genes from M-DMs, significant KEGG terms were collected. In module
1, five significant pathways are identified, and Spliceosome
pathway was the most significant enrichment of genes (Table III). In module 2, nine pathways
were identified with adjusted P<0.05, and Ubiquitin mediated
proteolysis pathway was the most significant enrichment of genes
(Table IV).
| Table III.KEGG pathway enrichment in module
1. |
Table III.
KEGG pathway enrichment in module
1.
| Pathways | P-value | Adjusted
P-value | Genes |
|---|
| Spliceosome (PATH:
hsa03040) | 1.84E-10 | 2.50E-08 | ALYREF, DDX42,
HNRNPA3, DHX15, EFTUD2, EIF4A3, HNRNPC, SF3A1, SF3B2, SF3B3, DDX23
SNRNP70, RBM25, SNRPB |
| Pathogenic
Escherichia coli infection (PATH: hsa05130) | 2.53E-06 | 0.000171848 | EZR, KRT18, TUBA1B,
TUBA4A, TUBB6 TUBB4B, YWHAZ, |
| One carbon pool by
folate (PATH: hsa00670) | 6.64E-05 | 0.003011209 | ATIC, GART, MTHFD1,
SHMT2 |
| Non-homologous
end-joining (PATH: hsa03450) | 0.000377529 | 0.012835974 | MRE11A, RAD50,
XRCC5 |
| Phagosome | 0.001790718 | 0.048707539 | DYNC1H1, HLA-C,
TFRC, TUBB6 |
| (PATH:
hsa04145) |
|
| TUBA1B, TUBA4A,
TUBB4B |
| Table IV.KEGG pathway enrichment analysis in
module 2. |
Table IV.
KEGG pathway enrichment analysis in
module 2.
| Pathways | P-value | Adjusted
P-value | Genes |
|---|
| Ubiquitin mediated
proteolysis (PATH: hsa04120) | 1.55E-05 | 0.001720119 | CUL2, CUL3, CUL4A,
CUL4B, MDM2, RFWD2, RNF7 |
| Spliceosome (PATH:
hsa03040) | 0.000128525 | 0.00713315 | DHX15, HNRNPA3,
SNRPB, SNRPD1, SNRPD3, SNRPG |
| Pathogenic
Escherichia coli infection (PATH: hsa05130) | 0.000319891 | 0.011835952 | TUBA1C, TUBA4A,
TUBB, TUBB4B |
| p53 signaling
pathway (PATH: hsa04115) | 0.000721488 | 0.017621689 | CCNE1, MDM2, RFWD2,
TP53 |
| Herpes simplex
infection (PATH: hsa05168) | 0.00079377 | 0.017621689 | C1QBP, CSNK2A2,
TP53, POLR2A, NFKB1, USP7 |
| Epstein-Barr virus
infection (PATH: hsa05169) | 0.001254944 | 0.023216458 | CSNK2A2, MDM2,
TP53, POLR2A, NFKB1, USP7 |
| Gap junction (PATH:
hsa04540) | 0.001972915 | 0.0273742 | TUBA1C, TUBA4A,
TUBB, TUBB4B |
| Prostate cancer
(PATH: hsa05215) | 0.001972915 | 0.0273742 | CCNE1, MDM2, TP53,
NFKB1 |
| Nucleotide excision
repair (PATH: hsa03420) | 0.002802581 | 0.034565169 | CUL4A, CUL4B,
ERCC6 |
Discussion
BMS and DES are frequently used in medicine
(2). The use of DES has been shown
more effective than BMS in the reduction of restenosis (4). In the present study, we aimed to
compare the putative molecular mechanism induced by PES and BES in
denuded human LIMA arteries. We applied M-module algorithm to
identify differential modules. Compared with control samples, in
each stent group, one differential module was identified, named as
module 1 (PES) and module 2 (BES). The modules shared the same
genes but with different interactions. After GO enrichment
analysis, RNA processing was the most significant enrichment of
biological process in module 1 and nucleic acid metabolic process
was the most significant enrichment of biological process in module
2. Following the KEGG pathway enrichment analysis, five significant
pathways were identified in module 1 and nine significant pathways
were identified in 2. These identified significant modules and
pathways may reveal potential molecular mechanisms between PES and
BES in denuded human LIMA arteries.
In the coronary artery lesions, DES have
successfully decreased the rate of in-stent restenosis and target
lesion revascularization compared with BMS (4,24). The
amount of NIH at 6 months after stent implantation was
significantly smaller in the PES than that identified than in the
BMS group (25). While in the
present study, we tried to explore the molecular differences
between the two groups by identifying differential co-expressed
networks.
Changes in the structure and activity of gene
network play a critical role in the disease progression. In the
present study, we applied iMDM algorithm to explore differential
co-expressed modules. This iMDM algorithm has been used in the
time-course RNA-Seq dataset generated using a murine heart failure
model generated on two genotypes (13), which achieved higher accuracy in
inferring gene modules compared to using single or multiple
co-expression networks. This method showed better performance in
quantifying genes and edges in a module compared with traditional
studies, such as hub genes, which only focused on highly connected
genes in a pathway (26,27). With this method, two modules were
identified after comparing stent-treatment samples to control
samples. Different significant biological processes and KEGG
pathways were found in these modules, indicating that PES and BMS
induced different molecular changes in human LIMA arteries.
There are some limitations in this study. The
number of samples were too small in the study. That is not
sufficient to obtain a conclusion. Still, the PES is rarely used in
US due to the superiority of second-generation stents (zotarolimus-
and everolimus-eluting stents), thus we will perform further
analysis of second-generation stents.
In conclusion, each stent-treated group was
identified with a module, and different significant biological
processes and different significant pathways were mediated by the
two stent types. Thus through these modules, we revealed the
potential molecular changes induced by PES and BMS, which provide
new insights into the underlying mechanisms in human LIMA arteries
after inserted with a stent.
Acknowledgements
Not applicable.
Funding
No funding was received.
Availability of data and materials
The datasets used and/or analyzed during the
current study are available from the corresponding author on
reasonable request.
Authors' contributions
ZT as the first and corresponding author
contributed to the conception and design of the study; JG as the
second author contributed significantly to analysis and manuscript
preparation; PS as the third author performed the data analyses and
wrote the manuscript; JZ and YZ as the fourth and fifth authors
helped perform the analysis with constructive discussions. All
authors read and approved the final manuscript.
Ethics approval and consent to
participate
The Ethics Committee of The First Hospital of Zibo
approved the research, and written informed consent was given by
all participants.
Consent for publication
Not applicable.
Competing interests
The authors declare that they have no competing
interests.
Glossary
Abbreviations
Abbreviations:
|
BMS
|
bare-metal stents
|
|
PES
|
paclitaxel-eluting stent
|
|
LIMA
|
left internal mammary artery
|
|
M-DM
|
multiple differential modules
|
|
DES
|
drug-eluting stents
|
|
FDR
|
Food and Drug Administration
|
|
CAD
|
coronary artery disease
|
|
DCNs
|
differential co-expression
networks
|
|
GO
|
gene ontology
|
|
RMA
|
robust multichip average
|
|
PM
|
perfect match
|
|
MM
|
mismatch
|
|
KEGG
|
Kyoto Encyclopedia of Genes and
Genomes
|
References
|
1
|
Ruygrok PN and Serruys PW: Intracoronary
stenting. From concept to custom. Circulation. 94:882–890. 1996.
View Article : Google Scholar : PubMed/NCBI
|
|
2
|
Bønaa KH, Mannsverk J, Wiseth R, Aaberge
L, Myreng Y, Nygård O, Nilsen DW, Kløw NE, Uchto M, Trovik T, et al
NORSTENT Investigators, : Drug-eluting or bare-metal stents for
coronary artery disease. N Engl J Med. 375:1242–1252. 2016.
View Article : Google Scholar : PubMed/NCBI
|
|
3
|
Serruys PW, Kutryk MJ and Ong AT:
Coronary-artery stents. N Engl J Med. 354:483–495. 2006. View Article : Google Scholar : PubMed/NCBI
|
|
4
|
Moses JW, Leon MB, Popma JJ, Fitzgerald
PJ, Holmes DR, O'Shaughnessy C, Caputo RP, Kereiakes DJ, Williams
DO, Teirstein PS, et al SIRIUS Investigators, : Sirolimus-eluting
stents versus standard stents in patients with stenosis in a native
coronary artery. N Engl J Med. 349:1315–1323. 2003. View Article : Google Scholar : PubMed/NCBI
|
|
5
|
Laarman GJ, Suttorp MJ, Dirksen MT, van
Heerebeek L, Kiemeneij F, Slagboom T, van der Wieken LR, Tijssen
JG, Rensing BJ and Patterson M: Paclitaxel-eluting versus uncoated
stents in primary percutaneous coronary intervention. N Engl J Med.
355:1105–1113. 2006. View Article : Google Scholar : PubMed/NCBI
|
|
6
|
Authors/Task Force M, ; Windecker S, Kolh
P, Alfonso F, Collet JP, Cremer J, Falk V, Filippatos G, Hamm C,
Head SJ, et al: 2014 ESC/EACTS Guidelines on myocardial
revascularization: The Task Force on Myocardial Revascularization
of the European Society of Cardiology (ESC) and the European
Association for Cardio-Thoracic Surgery (EACTS)Developed with the
special contribution of the European Association of Percutaneous
Cardiovascular Interventions (EAPCI). Eur Heart J. 35:2541–2619.
2014. View Article : Google Scholar : PubMed/NCBI
|
|
7
|
Huan T, Zhang B, Wang Z, Joehanes R, Zhu
J, Johnson AD, Ying S, Munson PJ, Raghavachari N, Wang R, et al
Coronary artery disease genome wide replication and meta-analysis
(CARDIoGRAM) consortium, International Consortium for Blood
Pressure GWAS (ICBP), : A systems biology framework identifies
molecular underpinnings of coronary heart disease. Arterioscler
Thromb Vasc Biol. 33:1427–1434. 2013. View Article : Google Scholar : PubMed/NCBI
|
|
8
|
Gargalovic PS, Imura M, Zhang B, Gharavi
NM, Clark MJ, Pagnon J, Yang WP, He A, Truong A, Patel S, et al:
Identification of inflammatory gene modules based on variations of
human endothelial cell responses to oxidized lipids. Proc Natl Acad
Sci USA. 103:pp. 12741–12746. 2006; View Article : Google Scholar : PubMed/NCBI
|
|
9
|
Akavia UD and Benayahu D: Meta-analysis
and profiling of cardiac expression modules. Physiol Genomics.
35:305–315. 2008. View Article : Google Scholar : PubMed/NCBI
|
|
10
|
Segal E, Shapira M, Regev A, Pe'er D,
Botstein D, Koller D and Friedman N: Module networks: Identifying
regulatory modules and their condition-specific regulators from
gene expression data. Nat Genet. 34:166–176. 2003. View Article : Google Scholar : PubMed/NCBI
|
|
11
|
Tanay A and Shamir R: Computational
expansion of genetic networks. Bioinformatics. 17 Suppl
1:S270–S278. 2001. View Article : Google Scholar : PubMed/NCBI
|
|
12
|
Pe'er D, Regev A and Tanay A: Minreg:
Inferring an active regulator set. Bioinformatics. 18 Suppl
1:S258–S267. 2002. View Article : Google Scholar : PubMed/NCBI
|
|
13
|
Ma X, Gao L, Karamanlidis G, Gao P, Lee
CF, Garcia-Menendez L, Tian R and Tan K: Revealing pathway dynamics
in heart diseases by analyzing multiple differential networks. PLOS
Comput Biol. 11:e10043322015. View Article : Google Scholar : PubMed/NCBI
|
|
14
|
Nayak RR, Kearns M, Spielman RS and Cheung
VG: Coexpression network based on natural variation in human gene
expression reveals gene interactions and functions. Genome Res.
19:1953–1962. 2009. View Article : Google Scholar : PubMed/NCBI
|
|
15
|
Vizeacoumar FJ, van Dyk N, Vizeacoumar F
S, Cheung V, Li J, Sydorskyy Y, Case N, Li Z, Datti A, Nislow C, et
al: Integrating high-throughput genetic interaction mapping and
high-content screening to explore yeast spindle morphogenesis. J
Cell Biol. 188:69–81. 2010. View Article : Google Scholar : PubMed/NCBI
|
|
16
|
Xiao Y, Xu C, Guan J, Ping Y, Fan H, Li Y,
Zhao H and Li X: Discovering dysfunction of multiple microRNAs
cooperation in disease by a conserved microRNA co-expression
network. PLoS One. 7:e322012012. View Article : Google Scholar : PubMed/NCBI
|
|
17
|
Ma L, Robinson LN and Towle HC: ChREBP*Mlx
is the principal mediator of glucose-induced gene expression in the
liver. J Biol Chem. 281:28721–28730. 2006. View Article : Google Scholar : PubMed/NCBI
|
|
18
|
Rifai N and Ridker PM: Proposed
cardiovascular risk assessment algorithm using high-sensitivity
C-reactive protein and lipid screening. Clin Chem. 47:28–30.
2001.PubMed/NCBI
|
|
19
|
Bolstad BM, Irizarry RA, Astrand M and
Speed TP: A comparison of normalization methods for high density
oligonucleotide array data based on variance and bias.
Bioinformatics. 19:185–193. 2003. View Article : Google Scholar : PubMed/NCBI
|
|
20
|
Irizarry RA, Bolstad BM, Collin F, Cope
LM, Hobbs B and Speed TP: Summaries of affymetrix genechip probe
level data. Nucleic Acids Res. 31:e152003. View Article : Google Scholar : PubMed/NCBI
|
|
21
|
Szklarczyk D, Franceschini A, Kuhn M,
Simonovic M, Roth A, Minguez P, Doerks T, Stark M, Muller J, Bork
P, et al: The STRING database in 2011: Functional interaction
networks of proteins, globally integrated and scored. Nucleic Acids
Res. 39(Database): D561–D568. 2011. View Article : Google Scholar : PubMed/NCBI
|
|
22
|
Benjamini Y and Hochberg Y: Controlling
the false discovery rate: A practical and powerful approach to
multiple testing. J R Stat Soc B. 57:289–300. 1995.
|
|
23
|
Ashburner M, Ball CA, Blake JA, Botstein
D, Butler H, Cherry JM, Davis AP, Dolinski K, Dwight SS, Eppig JT,
et al The Gene Ontology Consortium, : Gene ontology: Tool for the
unification of biology. Nat Genet. 25:25–29. 2000. View Article : Google Scholar : PubMed/NCBI
|
|
24
|
Stettler C, Wandel S, Allemann S, Kastrati
A, Morice MC, Schömig A, Pfisterer ME, Stone GW, Leon MB, de Lezo
JS, et al: Outcomes associated with drug-eluting and bare-metal
stents: A collaborative network meta-analysis. Lancet. 370:937–948.
2007. View Article : Google Scholar : PubMed/NCBI
|
|
25
|
Miki K, Fujii K, Kawasaki D, Fukunaga M,
Nishimura M, Horimatsu T, Saita T, Tamaru H, Imanaka T, Shibuya M,
et al: Effect of bare-metal nitinol stent implantation and
paclitaxel-eluting nitinol stent implantation on vascular response
in the superficial femoral artery lesion assessed on intravascular
ultrasound. Circ J. 78:1451–1458. 2014. View Article : Google Scholar : PubMed/NCBI
|
|
26
|
Taylor IW, Linding R, Warde-Farley D, Liu
Y, Pesquita C, Faria D, Bull S, Pawson T, Morris Q and Wrana JL:
Dynamic modularity in protein interaction networks predicts breast
cancer outcome. Nat Biotechnol. 27:199–204. 2009. View Article : Google Scholar : PubMed/NCBI
|
|
27
|
Pujana MA, Han JD, Starita LM, Stevens KN,
Tewari M, Ahn JS, Rennert G, Moreno V, Kirchhoff T, Gold B, et al:
Network modeling links breast cancer susceptibility and centrosome
dysfunction. Nat Genet. 39:1338–1349. 2007. View Article : Google Scholar : PubMed/NCBI
|