Introduction
With the development of high-throughput drug
screening, a tremendous amount of genome-wide drug interaction data
has been generated. Although valid, most of this information is of
lesser value to drug discovery. Due to the sheer immensity of these
results, computational approaches are required to parse this data,
and discover underlying patterns and networks of activity. Chemical
similarities between drug and ligand sets often predict thousands
of unanticipated associations, suggesting that a drug may have more
than one target, unintentional side effects, or making it a
candidate for drug repositioning (1). Having multiple targets is not uncommon:
Numerous approved drugs appear to work by modulating multiple
genes, including unknown genes (2).
In the clinic, numerous mono-therapies have been demonstrated to
have limited effects due to gene function redundancy (3). As such, network pharmacology, the study
of drug effects on protein-protein interactions, represents the
next paradigm in drug discovery (4).
One of the largest pharmacological databases is
provided by the Broad Institute of the Massachusetts Institute of
Technology and Harvard-the Connectivity Map (CMap), comprising
genome-wide gene expression profiles (from microarrays) for three
human cell lines in response to cule treatments (5,6).
However, the reductionist methods in pharmacology focus only on the
tip of an iceberg. Therefore, there is a requirement to re-analyze
genome-wide pharmacological data with approaches from systems or
networks (7).
Numerous studies have mined CMap to identify
potential drugs with a desired action via ‘signature genes’
(8). For instance, Functional Module
CMap used multiple functional gene modules to query the CMap and
screen candidate drugs (9). The CMap
tool has been used to retrieve candidate drugs via signature genes
and a rank-based pattern-matching strategy (10). Iskar et al (11) identified conservative transcriptional
modules between human cell lines and rat liver by analyzing CMap
and DrugMatrix. Raghavan et al (12) performed a search of the CMap database
to identify novel drugs for ovarian cancer based on recurrent gene
signatures. Cheng et al (13)
compared three CMap-based methods regarding their prediction
performance against a curated dataset of 890 true drug-indication
pairs and identified that XSum, which is also based on disease
signatures, performs best. Thus, the premise of most CMap studies
is that disease may be characterized by certain important signature
genes. However, many studies have relied on its accuracy and
predictive value to an unreasonable extent. First, the parameters
for ‘signature genes’ may be influenced by population size, the
cell line being studied, disease severity or differential gene
expression methods (14).
Furthermore, gene expression signatures are defined as an
alteration in the expression of a gene (or genes) with validated
specificity in terms of diagnosis, prognosis or prediction of
therapeutic response, ignoring the possibility of gene interactions
(15). The definition just focuses
on the quantitative gene expression alteration, but ignores the
interconnections between genes. Signature genes may be expressed
with high correlation. Finally, gene function is not considered by
a ‘signature genes’ approach, due to the possibility of redundant
gene activity (16). These issues
may be resolved by network biology methods, which consider not only
the expression but also the modular function of genes.
To address these issues, the present study applied a
method termed Weighted Gene Co-expression Network Analysis (WGCNA)
to CMap and identified co-expressed gene sets (modules) with
functional annotations. Although the CMap has been extensively
analyzed, the common traits among these drugs are often neglected.
The present analysis revealed common targets for chemical drugs
among transcriptional networks, and is intended to serve as an
outline for a module-based method for drug repositioning
studies.
Materials and methods
Data acquisition
The microarray dataset was downloaded from the CMap
server (https://portals.broadinstitute.org/cmap/cel_file_chunks.jsp).
After excluding chips that were not from the Affymetrix HT_HG-U133A
platform and disrupted files, 5,195 gene expression profiles from 3
cell lines (MCF7, breast cancer epithelial cells; PC3, human
prostate cancer cells; HL60, human promyeloblasts) treated with
1,219 drug-like compounds were analyzed. All of these samples were
pooled together for use in WGCNA algorithms to identify common
modules (data not shown).
Microarray data analysis
Microarray data analysis was performed by using the
Affymetrix Expression Console software (v1.4.1.46; Affymetrix Inc.,
Santa Clara, CA, USA) and the MAS5 normalization method. WGCNA was
performed according to the manual (17). Signed co-expression networks were
constructed on the genome-wide 22,215 probes using the WGCNA
package (v1.51; R Foundation for Statistical Computing, Vienna,
Austria; available from https://cran.r-project.org/src/contrib/WGCNA_1.51.tar.gz)
(17) in R (v3.2; R Foundation for
Statistical Computing; available from https://www.R-project.org) with the following
parameters: Power, 6; minModuleSize, 30; deepSplit, 4; neworkType,
‘signed’. In brief, for each pair of probes, a Pearson correlation
coefficient matrix was calculated and the adjacency matrix was then
computed by raising the correlation matrix to the power of β,
[connection strength=(0.5 + 0.5 × correlation)β]
(17). The power of 6 was chosen
using the scale-free topology criterion. The weighted network was
converted into a network of topological overlap (TO)-an advanced
co-expression measurement that considers not only the correlation
of two probes with each other, but also the extent of their shared
correlations across the weighted network (17). Probes were hierarchically clustered
on the basis of their distance as measured by 1-TO. Finally,
modules were identified on the dendrogram using the Dynamic Tree
Cut algorithm with a height cutoff at 0.995 (18). Highly similar modules were identified
by clustering and merged together. Each module was summarized using
singular value decomposition so that each module eigengene (ME)
represented the first principal component of the module's
expression profiles (17). Thus, the
ME explains the maximum amount of variation of expression levels
within a module, and is considered the most representative gene
expression in a module. The ME value was used for downstream
analysis.
Functional annotation of the
modules
Gene ontology (GO) enrichment analyses for
identified modules were performed in the Database for Annotation,
Visualization and Integrated Discovery (DAVID) (19).
Clustering of compounds
Based on the ME value, the Euclidean distance was
used to cluster compounds. The hierarchical clustering was
performed by average linkage clustering. The heatmap was plotted
using Genesis software (v1.7.5; Thallinger Lab, Graz, Austria;
available from https://genome.tugraz.at/genesisclient/genesisclient_documentation.shtml).
Drug repositioning
The CMap was projected to a nonalcoholic
steatohepatitis (NASH) dataset, which was downloaded from the
ArrayExpress database (accession no. E-MEXP-3291; available from
www.ebi.ac.uk/arrayexpress) and resulted
in an ME matrix. The compound ME value was ranked in sequential
order. In general, the drug with the highest or lowest ME may be
efficient against the selected disease.
Statistical analysis
The correlation between the original module and the
sampled module data was calculated by ‘cor’ function in R. In
DAVID, the overrepresentation of a term is defined as a modified
Fisher's exact P-value with an adjustment for multiple tests using
the Benjamini-Hochberg method.
Results
A gene co-expression network for CMap
reveals common features of drug pathways
The first task of the present study was to organize
and compartmentalize a selection from the CMap database into
distinct activity profiles, or modules, which represent widespread
gene activation as a result of exposure to drugs. The CMap gene
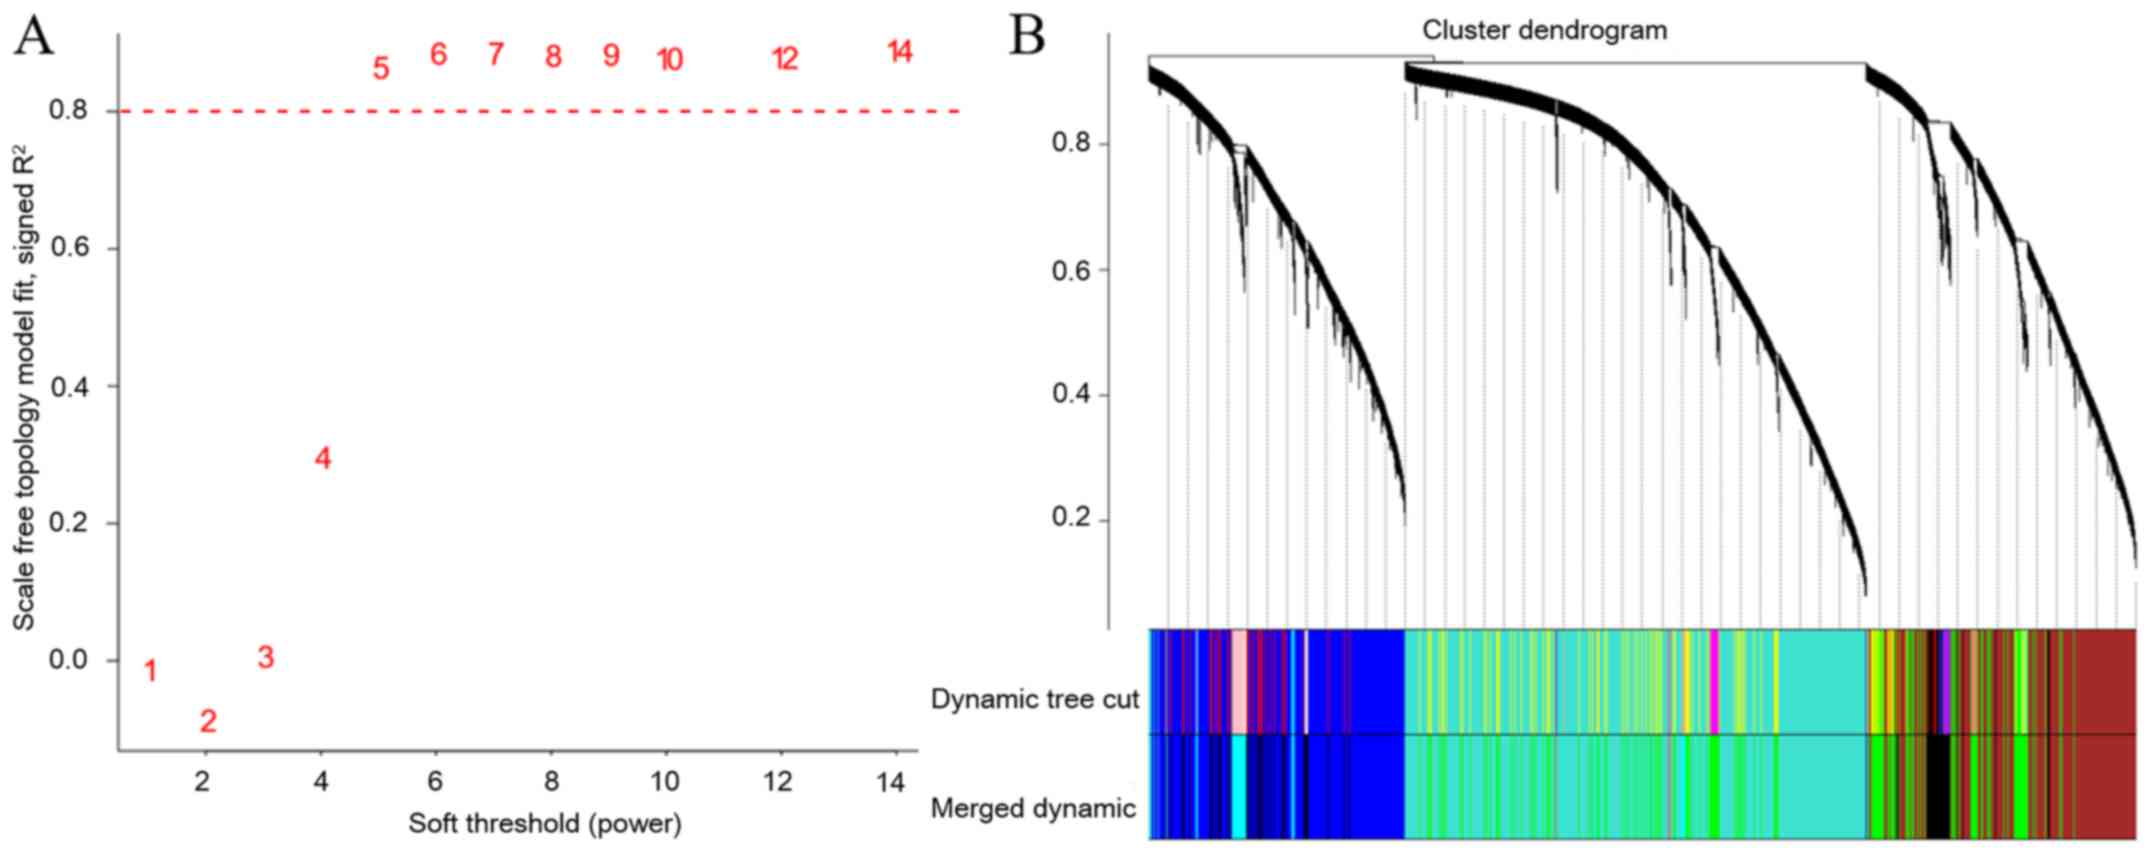
expression profiles were reanalyzed using the WGCNA algorithm. To
obtain a scale-free network, a power of 6 was chosen (Fig. 1A). Seven gene co-expression modules
were identified (Fig. 1B), and the
stability of these modules was verified by sampling a random
selection of half of the data in each module 1,000 times and
comparing it to the whole module to verify that interconnected gene
activities are truly linked-an approach which has been performed
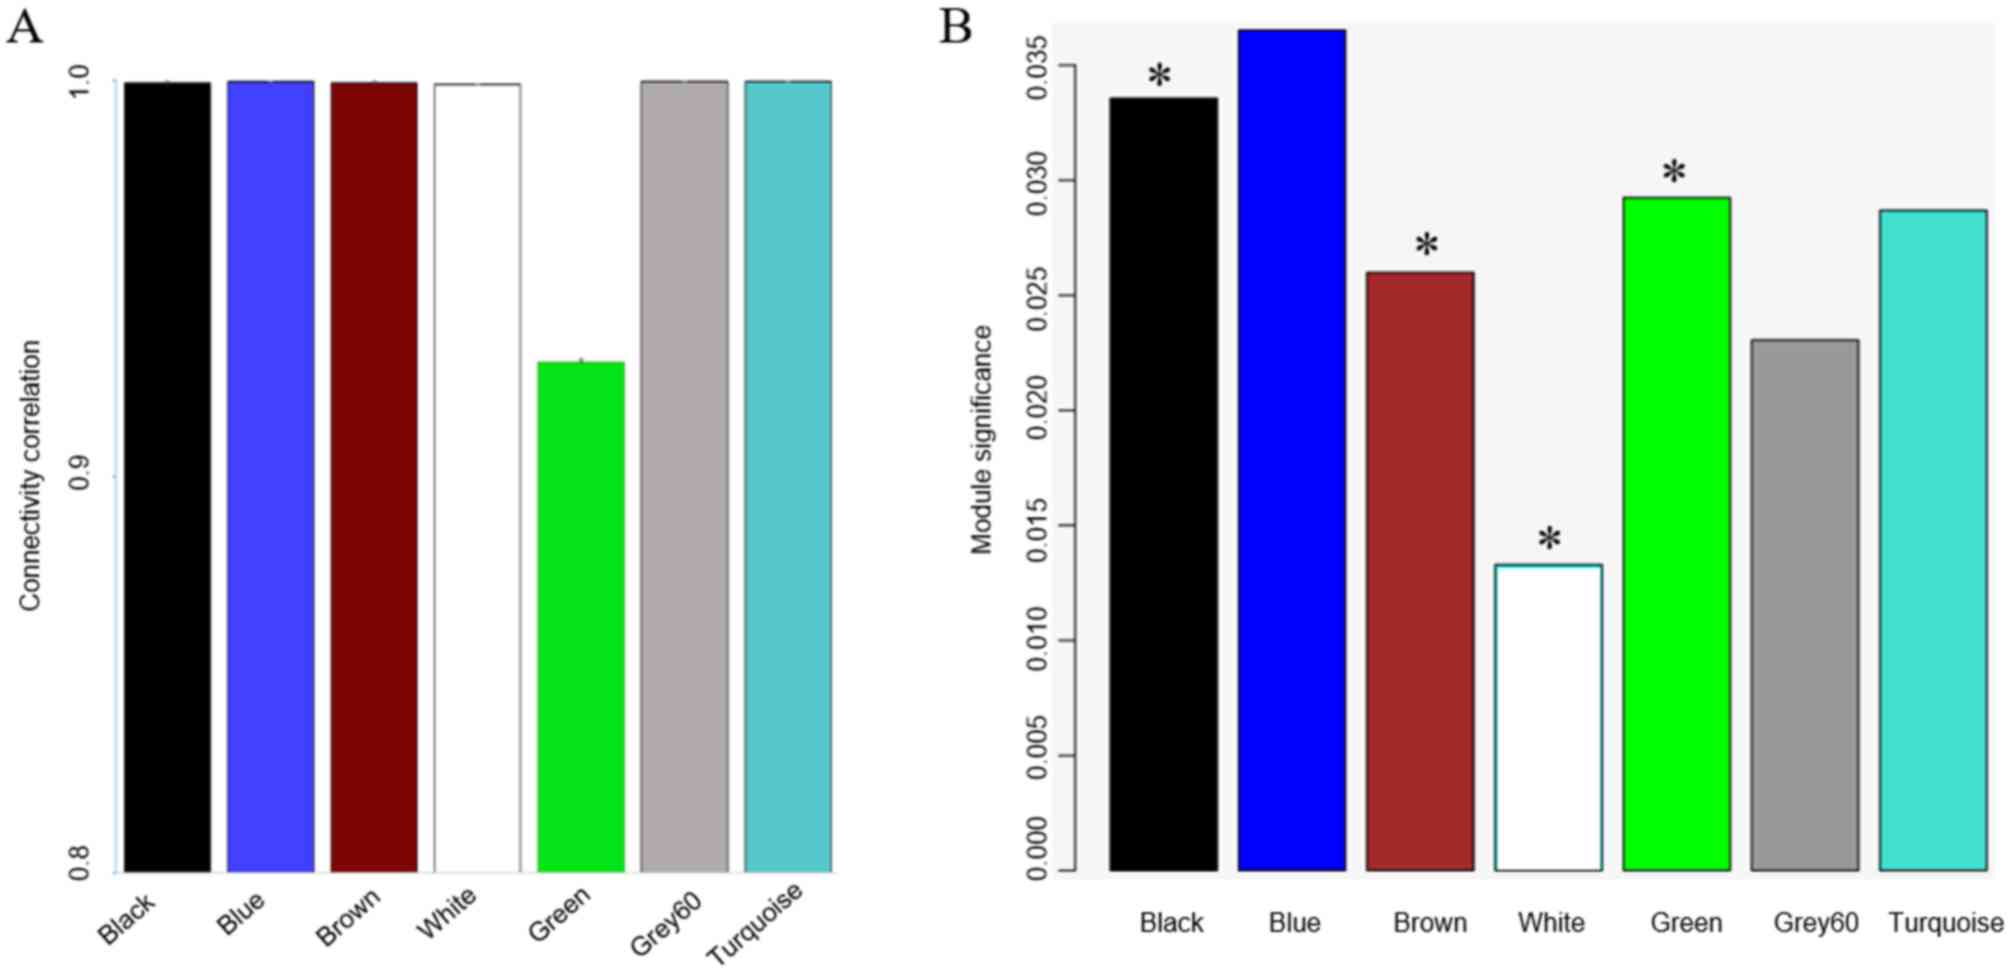
previously (20). Each module's
stability was expressed as the intra-module connectivity
correlation (on a scale from 0 to 1) between the original one and
the half-sampled one (Fig. 2A). The
module green was the least stable module. The module significance
was calculated for each module as the average gene significance of
the genes within the module. Four modules had a significant
association with drug concentration (Fig. 2B).
To characterize these modules, GO enrichment
analysis in the following categories was performed: Biological
Process, Cellular Component and Molecular Function. Modules
associated with these terms (each assigned a color for simplicity
in visual mapping and naming: blue, black, brown, white, green,
grey60 and turquoise) were linked to a limited range of molecular
functions, which mainly comprised protein, RNA and ATP binding
(Table I). Overall, modules that
matched these keywords were associated with cell adhesion,
extracellular matrix organization, mRNA splicing and translational
initiation. Two transcriptionally distinct modules, the blue and
black modules, were significantly overrepresentative of cell-cell
adhesion genes, although the blue module was highly enriched in
nucleoplasm protein-encoding genes and the black module was more
enriched with cytosolic genes. Of note, these results suggested
that most drugs examined within these modules act through protein
binding.
 | Table I.GO annotation of the 7 gene
co-expression modules identified in Connectivity Map. |
Table I.
GO annotation of the 7 gene
co-expression modules identified in Connectivity Map.
|
| GO term
(Benjamini-adjusted P-value) |
|
|---|
|
|
|
|
|---|
| Module (number of
probes) | Biological
process | Cellular
component | Molecular
function | Chromosome
(Benjamini-adjusted P-value) |
|---|
| Blue (4338) | Cell-cell adhesion
(6.29×10⁻⁷) | Nucleoplasm
(4.29×10⁻²⁸) | Protein binding
(3.09×10⁻²⁹) | 16
(2.9×10−44) |
|
| Viral process
(6.19×10⁻⁶) | Cytosol
(3.89×10⁻¹⁷) | Cadherin binding
involved in cell-cell adhesion (3.09×10⁻²⁹) |
|
| Black (1407) | Cell-cell adhesion
(3.59×10⁻⁵) | Cytosol
(4.09×10⁻²⁰) | Protein binding
(1.69×10⁻¹⁴) | 20
(9.8×10⁻¹⁰) |
| Brown (3583) | Extracellular
matrix organization (1.69×10⁻⁸) | Cytosol
(3.19×10⁻¹⁹) | Protein binding
(1.29×10⁻²⁰) | 20
(1.1×10⁻³) |
|
| Angiogenesis
(1.99×10⁻⁷) | Extracellular
exosome (7.29×10⁻¹⁷) | Integrin binding
(7.59×10⁻⁸) |
|
| White (575) | mRNA splicing, via
spliceosome (4.19×10⁻⁶) | Nucleoplasm
(2.89×10⁻²⁰) | Protein binding
(2.39×10⁻¹⁵) |
|
|
| Termination of RNA
polymerase | Nucleus
(1.19×10⁻¹¹) | Poly(A) RNA binding
(6.29×10⁻¹¹) | 16
(8.4×10⁻⁴) |
|
| II transcription
(3.39×10⁻⁴) |
|
|
|
| Green (3324) |
| Membrane
(4.59×10⁻¹⁰) | Protein binding
(8.29×10⁻¹⁵) | 1
(3.3×10⁻⁵) |
|
|
| Cytosol
(2.89×10⁻⁸) | ATP binding
(5.09×10⁻⁶) |
|
| Grey60 (124) | SRP-dependent
cotranslational protein | Ribosome
(2.29×10−51) |
| 3
(2.9×10⁻⁵) |
|
| targeting to
membrane (3.59×10−62) | Cytosolic large
ribosomal |
|
|
|
| Translational
initiation (1.5×10−60) | subunit
(9.19×10⁻³⁵) |
|
|
| Turquoise
(8864) | Signal transduction
(5.59×10⁻¹⁹) | Integral component
of plasma | Protein binding
(4.59×10⁻²⁰) | 19
(1.5×10⁻⁵) |
|
| Immune response
(7.29×10⁻¹⁶) | membrane
(1.79×10⁻³³) | Receptor activity
(3.19×10⁻¹⁰) |
|
|
|
| Extracellular space
(4.39×10⁻¹⁵) |
|
|
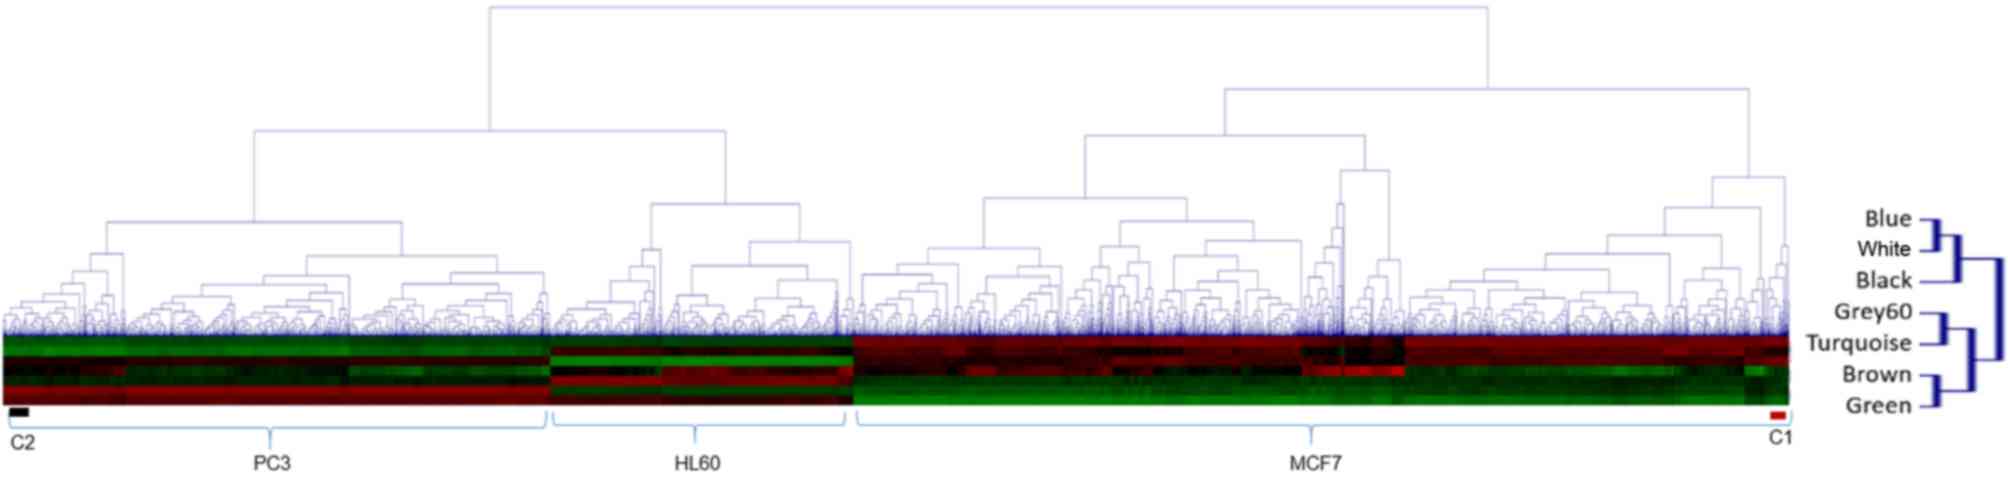
Furthermore, samples were clustered based on ME, and
three distinct clusters corresponding to three cell lines used were
identified in the CMap, indicating that the cell line contributes
more to gene expression than drug treatment (Fig. 3).
Computational drug clustering suggests
similar mechanisms of action (MoAs)
In the present study, it was hypothesized that
compounds clustered together may trigger similar genes and
pathways, which may point to similar MoAs. If correct, a
computational approach to determine a drug's MoA based on this
premise may provide critical information for determining potential
side-effects and repositioning. To further examine the similarity
between clustered drugs by ME regarding their MoA, a recently
developed computational tool, Drug-Set Enrichment Analysis
(21), was used to check for common
pathways shared among clustered drugs (Table II). Of note, all 50 drugs that made
up Cluster 1 (C1) appeared to operate via upregulation of pathways
involved in programmed cell death (data not shown). Another 54-drug
cluster (C2), which was the most distant cluster from C1, appeared
to be involved in the negative regulation of mesenchymal cell
apoptotic processes (P=1.21×10⁻⁴). Several drugs from
the C2 cluster were antibiotics (data not shown). One of the drugs
from the C2 cluster, astemizole, has been reported to be associated
with enhanced melanoma growth in mice (22), while another study suggests potential
anticancer effects (23). The use of
certain antibiotics has already been reported to be associated with
increased risk of the incidence and fatality of breast cancer
(24), and further studies should
therefore be performed to ensure the safety of these drugs.
| Table II.The top-ranking Gene Ontology
Biological Processes for clusters C1 and C2 determined with the
DSEA tool. |
Table II.
The top-ranking Gene Ontology
Biological Processes for clusters C1 and C2 determined with the
DSEA tool.
| Cluster | Rank | Pathway name | Escore | P-value |
|---|
| C1 | 1 | Programmed cell
death | 0.39 |
3.42×10⁻⁶ |
|
| 2 | Positive regulation
of transcription elongation from RNA polymerase II promoter | 0.39 |
4.77×10⁻⁶ |
|
| 3 | Viral life
cycle | −0.38 |
5.65×10⁻⁶ |
| C2 | 1 | Proton
transport | 0.33 |
6.56×10⁻⁵ |
|
| 2 | Pathogen-associated
molecular pattern dependent induction by symbiont of host innate
immune response | 0.32 |
1.21×10⁻⁴ |
|
| 3 | Negative regulation
of mesenchymal cell apoptotic process | 0.32 |
1.45×10⁻⁴ |
In addition, certain drugs of the C2 module were
reported as anticancer agents (data not shown), including estradiol
as a treatment for aggressive breast cancer (25) and acetylsalicylic as a preventative
cancer treatment (26). However,
other studies have provided contradictory reports demonstrating
their carcinogenic potential; for instance, astemizole and
chloramphenicol have been reported to be anticancer agents and
carcinogens (27,28). It is possible that some anti-cancer
drugs are DNA alkylating agents and may therefore cause mutations
or secondary cancers. These results, while promising, hint at the
complexity in the clinically repositioning these drugs, and warrant
further investigation.
Module-based analysis for drug
repositioning
To provide an example for network-based drug
repositioning, a previously reported network of cancer cell lines
was used (20). In the present
study, a module involved in the cell cycle (red module) was
determined to be associated with breast cancer patient survival.
The CMap microarray data were projected onto the red module, and
the ME was calculated for the 1,219 drug molecules. 8-Azaguanine
was identified as the top molecules for cell cycle modulation. In
line with these computational predictions, 8-azaguanine has
previously been reported to produce marked and reversible growth
inhibition, and is clinically used as an anticancer agent (29,30).
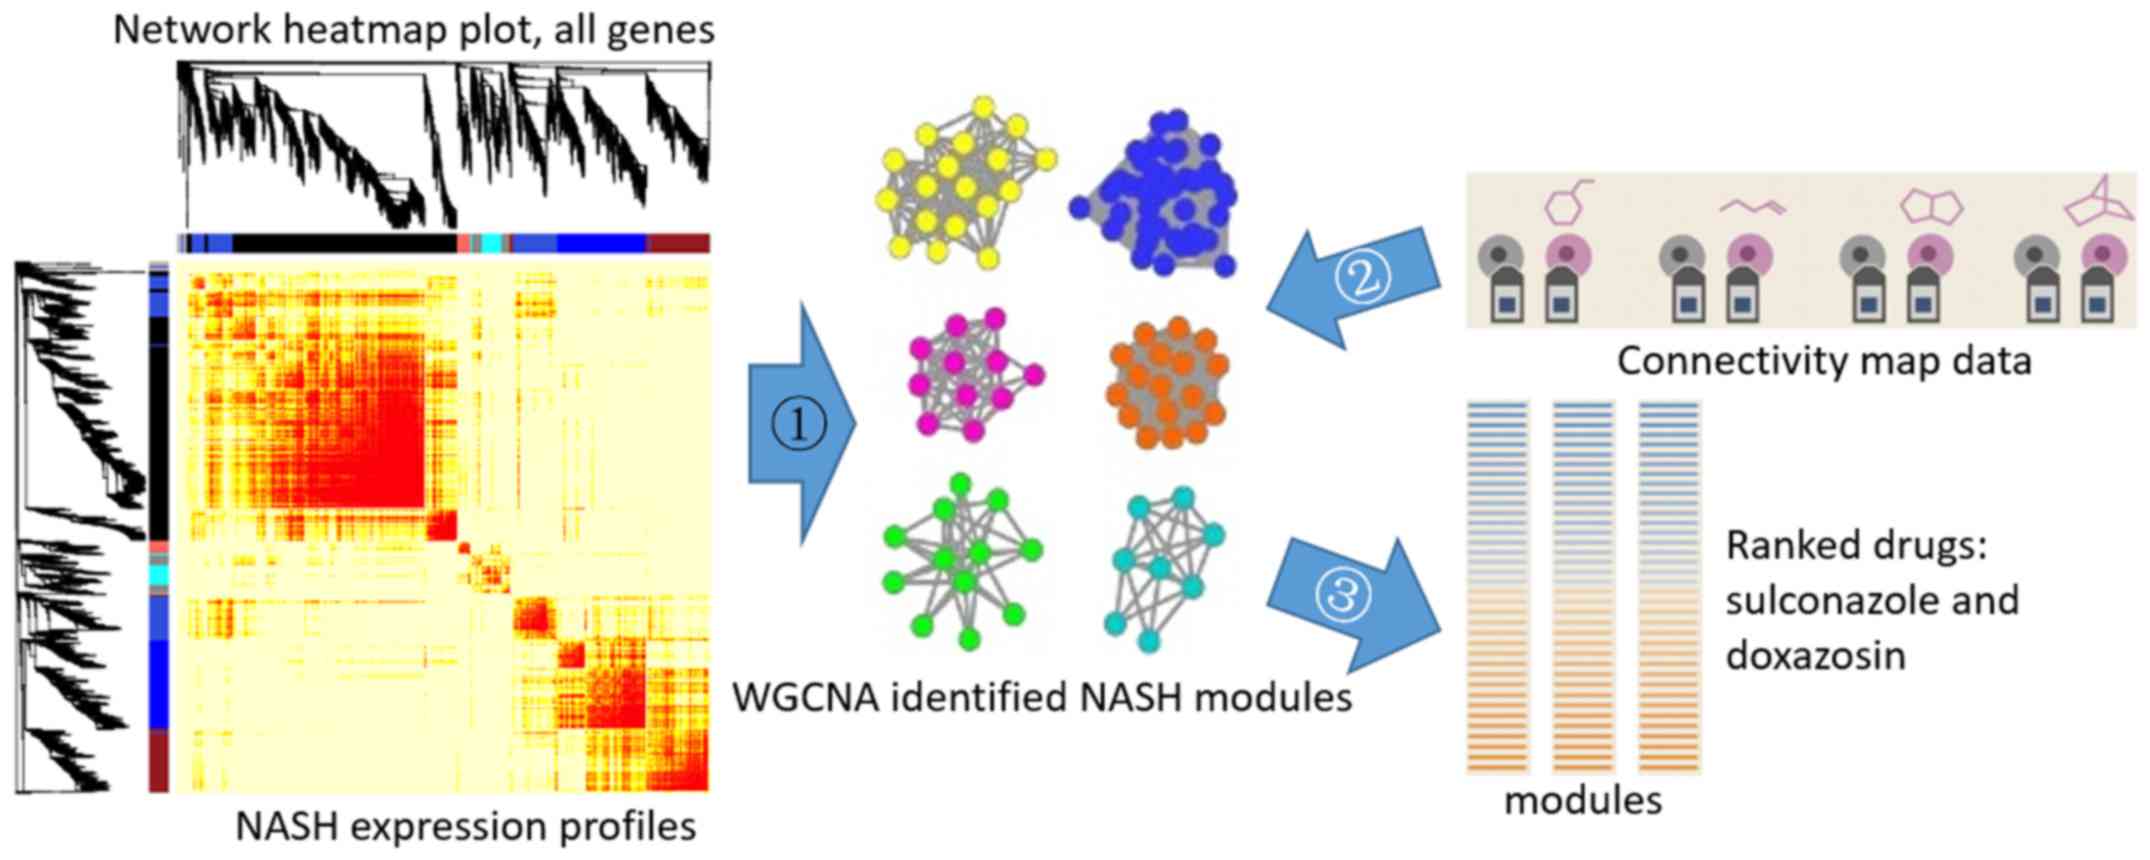
This method was also used to screen for genes
associated with non-alcoholic fatty liver disease (NAFLD) (Fig. 4). A previous study by our group
explored the potential drugs that may be efficient in treating
NAFLD using CMap (31). The
transcriptome data for NASH were used to construct a network and
identify significant gene modules by WGCNA. Modules M4 and M8 were
identified as significant modules. They were associated with
proteasomal protein degradation (M4) and extracellular matrix (M8).
The CMap data were then projected onto the NASH network, and each
ME was calculated for the 1,219 chemical molecules. A total of 2
top molecules with the highest MEs were identified for M4 and M8,
sulconazole and doxazosin, respectively. Of note, it has been
reported that the applications of doxazosin not only include the
treatment of hypertension but also the prevention of hepatic
steatosis, and even the alleviation of insulin resistance (32). Doxazosin is an antihypertensives
drug, but studies on its effects in NASH are currently limited to
animal models (32). Sulconazole is
an antifungal medication, which is used to treat skin infections
(33). Its role in reducing lipid
storage (patent no. US9393221; https://google.com/patents/US9393221) and
anti-inflammatory (patent no. US5208015 (https://www.google.com/patents/US5208015) has been
reported in two US patents. Thus, the promising roles of these
drugs in NASH require verification in future clinical studies.
Discussion
CMap is a commonly used database in pharmacology,
which has been utilized to identify novel drugs or MoAs. However,
most recent studies focus on individual differentially expressed
genes or gene signatures, ignoring the gene function redundancy and
gene-gene interactions. A disease is thought to rarely be a
consequence of an abnormality in a single gene, but is rather
reflected by a disruption of a complex gene network (34). The present study re-analyzed the CMap
microarray dataset by employing WGCNA, separating drugs and
expression profiles into usable modules that may help to predict
drug behaviors as well as identify MoAs. In contrast to
differential expression analyses, which are based on gene signature
methods, the WGCNA method analyzes whole gene clusters involved in
similar biological functions. WGCNA ‘modules’ are more stable units
than redundant individual signature genes, which may be easily
influenced by screening thresholds. In addition, WGCNA may be used
to take a deeper look at microarray data, revealing common
mechanisms and modes of interaction among drug sets. Of note, this
analysis is based upon cellular expression profiles, not the
original treatment scope of a drug, meaning that this method also
provides a novel opportunity for drug repositioning.
By employing WGCNA methodology, the present study
identified 7 biologically meaningful modules associated with
cell-cell adhesion, extracellular matrix organization, mRNA
splicing, translational initiation and signal transduction. These
observed modules demonstrate the activity association of the
screened drugs with each other. Clustering based on the ME value
may then be performed in order to identify drugs with a similar
MoA. Build upon.
Previously, network based techniques have been used
for drug repositioning (35). Park
et al (36) proposed a
network mirroring method, assuming that if two diseases are
similar, then a drug for one disease can be effective against the
other disease too. Gottlieb et al (37) depended on the observation that
similar drugs are indicated for similar diseases to compare
multiple drug-drug and disease-disease similarity measures for drug
repositioning. Chen et al (38) used bipartite network topology to
prioritize the potentially indicated diseases that a drug treats.
Luo et al (39) integrated
diverse information, including DrugBank database, HPRD database and
Comparative Toxicogenomics database, and developed a computational
pipeline, called DTINet, to predict novel drug-target interactions
from a constructed heterogeneous network. The limitations of these
methods include the lack of negative samples and known drug-disease
association information. The method in the present study only
required the disease and drug gene expression profiles regardless
of prior knowledge including protein-protein interactions,
drug-disease associations or other sources of information.
Personalized medicine at the molecular level is a
useful method to identify drugs tailored to a specific disorder
(40). In theory, CMap-based
techniques may be used to identify dysfunctional gene expression
modules in an affected patient, guiding the clinician to identify
drugs that specifically target the dysfunctional gene expression
underlying that patient's disorder. Based on this premise, the
present study demonstrated how a gene expression phenotype
associated with cellular dysregulation may be selected (breast
cancer cell cycle), how feature modules of interest associated with
that phenotype may be identified and how drugs may be projected
onto these modules to identify novel drugs worthy of further
investigation and for application to a specific patient's
condition.
Based upon this rationale, the present study
provided a novel drug discovery/repositioning system. To identify
novel treatments for specific diseases or disease subtypes, WGCNA
may be used to identify the dysregulated gene expression modules
and cross-reference the CMap drug data to the dysregulated modules.
The drugs identified may then be ranked according their ME values,
and drugs may be screened simply according to their ME.
Acknowledgements
Not applicable.
Funding
This work was supported in part by the National
Natural Science Foundation of China (grant nos. 31270454 and
81502091). The authors apologize that not all insightful
CMap-associated studies were cited due to lack of space.
Availability of data and materials
The datasets used and/or analyzed during the current
study are available from the corresponding author on reasonable
request.
Authors' contributions
HH and HT designed the study. SW and LingL collected
the data, YL and LiL analyzed the CMap and NAFLD data, WL and WT
analyzed the results and drafted the manuscript.
Ethics approval and consent to
participate
Not applicable.
Consent for publication
Not applicable.
Competing interests
The authors declare that they have no competing
interests.
References
|
1
|
Keiser MJ, Setola V, Irwin JJ, Laggner C,
Abbas AI, Hufeisen SJ, Jensen NH, Kuijer MB, Matos RC, Tran TB, et
al: Predicting new molecular targets for known drugs. Nature.
462:175–181. 2009. View Article : Google Scholar : PubMed/NCBI
|
|
2
|
Kibble M, Saarinen N, Tang J, Wennerberg
K, Mäkelä S and Aittokallio T: Network pharmacology applications to
map the unexplored target space and therapeutic potential of
natural products. Nat Prod Rep. 32:1249–1266. 2015. View Article : Google Scholar : PubMed/NCBI
|
|
3
|
Lin J, Wu L, Bai X, Xie Y, Wang A, Zhang
H, Yang X, Wan X, Lu X, Sang X and Zhao H: Combination treatment
including targeted therapy for advanced hepatocellular carcinoma.
Oncotarget. 7:71036–71051. 2016. View Article : Google Scholar : PubMed/NCBI
|
|
4
|
Hopkins AL: Network pharmacology: The next
paradigm in drug discovery. Nat Chem Biol. 4:682–690. 2008.
View Article : Google Scholar : PubMed/NCBI
|
|
5
|
Lamb J, Crawford ED, Peck D, Modell JW,
Blat IC, Wrobel MJ, Lerner J, Brunet JP, Subramanian A, Ross KN, et
al: The Connectivity Map: Using gene-expression signatures to
connect small molecules, genes, and disease. Science.
313:1929–1935. 2006. View Article : Google Scholar : PubMed/NCBI
|
|
6
|
Qu XA and Rajpal DK: Applications of
Connectivity Map in drug discovery and development. Drug Discov
Today. 17:1289–1298. 2012. View Article : Google Scholar : PubMed/NCBI
|
|
7
|
Leung EL, Cao ZW, Jiang ZH, Zhou H and Liu
L: Network-based drug discovery by integrating systems biology and
computational technologies. Brief Bioinform. 14:491–505. 2013.
View Article : Google Scholar : PubMed/NCBI
|
|
8
|
Zhang QY, Chu XY, Jiang LH, Liu MY, Mei ZL
and Zhang HY: Identification of non-electrophilic Nrf2 activators
from approved drugs. Molecules. 22:pii: E883. 2017.
|
|
9
|
Chung FH, Chiang YR, Tseng AL, Sung YC, Lu
J, Huang MC, Ma N and Lee HC: Functional module Connectivity Map
(FMCM): A framework for searching repurposed drug compounds for
systems treatment of cancer and an application to colorectal
adenocarcinoma. PLoS One. 9:e862992014. View Article : Google Scholar : PubMed/NCBI
|
|
10
|
Zhou W, Ma CX, Xing YZ and Yan ZY:
Identification of candidate target genes of pituitary adenomas
based on the DNA microarray. Mol Med Rep. 13:2182–2186. 2016.
View Article : Google Scholar : PubMed/NCBI
|
|
11
|
Iskar M, Zeller G, Blattmann P, Campillos
M, Kuhn M, Kaminska KH, Runz H, Gavin AC, Pepperkok R, van Noort V
and Bork P: Characterization of drug-induced transcriptional
modules: Towards drug repositioning and functional understanding.
Mol Syst Biol. 9:6622013. View Article : Google Scholar : PubMed/NCBI
|
|
12
|
Raghavan R, Hyter S, Pathak HB, Godwin AK,
Konecny G, Wang C, Goode EL and Fridley BL: Drug discovery using
clinical outcome-based Connectivity Mapping: Application to ovarian
cancer. BMC Genomics. 17:8112016. View Article : Google Scholar : PubMed/NCBI
|
|
13
|
Cheng J, Yang L, Kumar V and Agarwal P:
Systematic evaluation of Connectivity Map for disease indications.
Genome Med. 6:5402014. View Article : Google Scholar : PubMed/NCBI
|
|
14
|
Patil P, Bachant-Winner PO, Haibe-Kains B
and Leek JT: Test set bias affects reproducibility of gene
signatures. Bioinformatics. 31:2318–2323. 2015. View Article : Google Scholar : PubMed/NCBI
|
|
15
|
Chibon F: Cancer gene expression
signatures-the rise and fall? Eur J Cancer. 49:2000–2009. 2013.
View Article : Google Scholar : PubMed/NCBI
|
|
16
|
Ivliev AE, t Hoen PA and Sergeeva MG:
Coexpression network analysis identifies transcriptional modules
related to proastrocytic differentiation and sprouty signaling in
glioma. Cancer Res. 70:10060–10070. 2010. View Article : Google Scholar : PubMed/NCBI
|
|
17
|
Zhang B and Horvath S: A general framework
for weighted gene co-expression network analysis. Stat Appl Genet
Mol Biol. 4:Article172005. View Article : Google Scholar : PubMed/NCBI
|
|
18
|
Langfelder P, Zhang B and Horvath S:
Defining clusters from a hierarchical cluster tree: The dynamic
tree cut package for R. Bioinformatics. 24:719–720. 2008.
View Article : Google Scholar : PubMed/NCBI
|
|
19
|
da Huang W, Sherman BT and Lempicki RA:
Bioinformatics enrichment tools: Paths toward the comprehensive
functional analysis of large gene lists. Nucleic Acids Res.
37:1–13. 2009. View Article : Google Scholar : PubMed/NCBI
|
|
20
|
Liu W, Li L and Li W: Gene co-expression
analysis identifies common modules related to prognosis and drug
resistance in cancer cell lines. Int J Cancer. 135:2795–2803. 2014.
View Article : Google Scholar : PubMed/NCBI
|
|
21
|
Napolitano F, Sirci F, Carrella D and di
Bernardo D: Drug-set enrichment analysis: A novel tool to
investigate drug mode of action. Bioinformatics. 32:235–241.
2016.PubMed/NCBI
|
|
22
|
Brandes LJ, Warrington RC, Arron RJ,
Bogdanovic RP, Fang W, Queen GM, Stein DA, Tong J, Zaborniak CL and
LaBella FS: Enhanced cancer growth in mice administered daily
human-equivalent doses of some H1-antihistamines: predictive in
vitro correlates. J Natl Cancer Inst. 86:770–775. 1994. View Article : Google Scholar : PubMed/NCBI
|
|
23
|
de Guadalupe Chávez-López M,
Hernández-Gallegos E, Vázquez-Sánchez AY, Gariglio P and Camacho J:
Antiproliferative and proapoptotic effects of astemizole on
cervical cancer cells. Int J Gynecol Cancer. 24:824–828. 2014.
View Article : Google Scholar : PubMed/NCBI
|
|
24
|
Velicer CM, Heckbert SR, Lampe JW, Potter
JD, Robertson CA and Taplin SH: Antibiotic use in relation to the
risk of breast cancer. JAMA. 291:827–835. 2004. View Article : Google Scholar : PubMed/NCBI
|
|
25
|
Hwang KA, Park MA, Kang NH, Yi BR, Hyun
SH, Jeung EB and Choi KC: Anticancer effect of genistein on BG-1
ovarian cancer growth induced by 17 β-estradiol or bisphenol A via
the suppression of the crosstalk between estrogen receptor α and
insulin-like growth factor-1 receptor signaling pathways. Toxicol
Appl Pharmacol. 272:637–646. 2013. View Article : Google Scholar : PubMed/NCBI
|
|
26
|
Dubé C, Rostom A, Lewin G, Tsertsvadze A,
Barrowman N, Code C, Sampson M and Moher D: U.S. Preventive
Services Task Force: The use of aspirin for primary prevention of
colorectal cancer: a systematic review prepared for the U.S.
preventive services task force. Ann Intern Med. 146:365–375. 2007.
View Article : Google Scholar : PubMed/NCBI
|
|
27
|
Brambilla G, Mattioli F, Robbiano L and
Martelli A: Studies on genotoxicity and carcinogenicity of
antibacterial, antiviral, antimalarial and antifungal drugs.
Mutagenesis. 27:387–413. 2012. View Article : Google Scholar : PubMed/NCBI
|
|
28
|
Weisburger JH, Shirasu Y, Grantham PH and
Weisburger EK: Chloramphenicol, protein synthesis, and the
metabolism of the carcinogen N-2-fluorenyldiacetamide in rats.
Inhibition by chloramphenicol of carcinogen binding. J Biol Chem.
242:372–378. 1967.PubMed/NCBI
|
|
29
|
Kidder GW, Dewey VC and Parks RE Jr:
Effect of lowered essential metabolites on 8-azaguanine inhibition.
J Biol Chem. 197:193–198. 1952.PubMed/NCBI
|
|
30
|
Sugiura K, Hitchings GH, Cavalieri LF and
Stock CC: The effect of 8-azaguanine on the growth of carcinoma,
sarcoma, osteogenic sarcoma, lymphosarcoma and melanoma in animals.
Cancer Res. 10:178–185. 1950.PubMed/NCBI
|
|
31
|
Ye H and Liu W: Transcriptional networks
implicated in human nonalcoholic fatty liver disease. Mol Genet
Genomics. 290:1793–1804. 2015. View Article : Google Scholar : PubMed/NCBI
|
|
32
|
Menacho-Márquez M, Nogueiras R, Fabbiano
S, Sauzeau V, Al-Massadi O, Diéguez C and Bustelo XR: Chronic
sympathoexcitation through loss of Vav3, a Rac1 activator, results
in divergent effects on metabolic syndrome and obesity depending on
diet. Cell Metab. 18:199–211. 2013. View Article : Google Scholar : PubMed/NCBI
|
|
33
|
Lassus A, Forström S and Salo O: A
double-blind comparison of sulconazole nitrate 1% cream with
clotrimazole 1% cream in the treatment of dermatophytoses. Brit J
Dermatol. 108:195–198. 1983. View Article : Google Scholar
|
|
34
|
Barabási AL, Gulbahce N and Loscalzo J:
Network medicine: A network-based approach to human disease. Nat
Rev Genet. 12:56–68. 2011. View
Article : Google Scholar : PubMed/NCBI
|
|
35
|
Wu Z, Wang Y and Chen L: Network-based
drug repositioning. Mol Biosyst. 9:1268–1281. 2013. View Article : Google Scholar : PubMed/NCBI
|
|
36
|
Park S, Lee DG and Shin H: Network
mirroring for drug repositioning. BMC Med Inform Decis Mak. 17
Suppl 1:S552017. View Article : Google Scholar
|
|
37
|
Gottlieb A, Stein GY, Ruppin E and Sharan
R: PREDICT: A method for inferring novel drug indications with
application to personalized medicine. Mol Syst Biol. 7:4962011.
View Article : Google Scholar : PubMed/NCBI
|
|
38
|
Chen H, Zhang H, Zhang Z, Cao Y and Tang
W: Network-based inference methods for drug repositioning. Comput
Math Methods Med. 2015:1306202015. View Article : Google Scholar : PubMed/NCBI
|
|
39
|
Luo Y, Zhao X, Zhou J, Yang J, Zhang Y,
Kuang W, Peng J, Chen L and Zeng J: A network integration approach
for drug-target interaction prediction and computational drug
repositioning from heterogeneous information. Nat Commun.
8:5732017. View Article : Google Scholar : PubMed/NCBI
|
|
40
|
Li YY and Jones SJ: Drug repositioning for
personalized medicine. Genome Med. 4:272012.PubMed/NCBI
|