Introduction
Nasopharyngeal carcinoma (NPC) is a type of head and
neck cancer that originates in the nasopharynx, and has a high
incidence in South China, Southeast Asia, the Arctic, the Middle
East and North Africa (1). As a
malignant tumor type, NPC seriously threatens the health and life
of humans. Magnetic resonance imaging (MRI) has been utilized as a
preferred imaging modality for the evaluation of local, regional
and intracranial infiltration of NPC in clinical practice, due to
its high spatial resolution for examining soft tissues. Accurate
delineation of NPC has an important role not only for radiotherapy
planning, but also for follow-up evaluations. At present,
nasopharyngeal tumor borders are drawn by slice in clinical
practice. However, manual segmentation is tedious, time-consuming
and prone to errors. In addition, accurate segmentation highly
depends on the operator's expertise and experience. Therefore,
semi-automated or automated methods are required to accelerate and
facilitate clinical applications. However, this is a challenging
task, since nasopharyngeal tumors have a more complex structure and
anatomical location than other tumor types, e.g., lung cancer. NPC
is spatially close to several tissue types, including bones, muscle
and mucosa, which possess similar intensities on imaging, and
exhibits significant variations in size and shape among NPC
patients. In addition, MRI may have certain limitations, including
inhomogeneous intensity or different intensity ranges among the
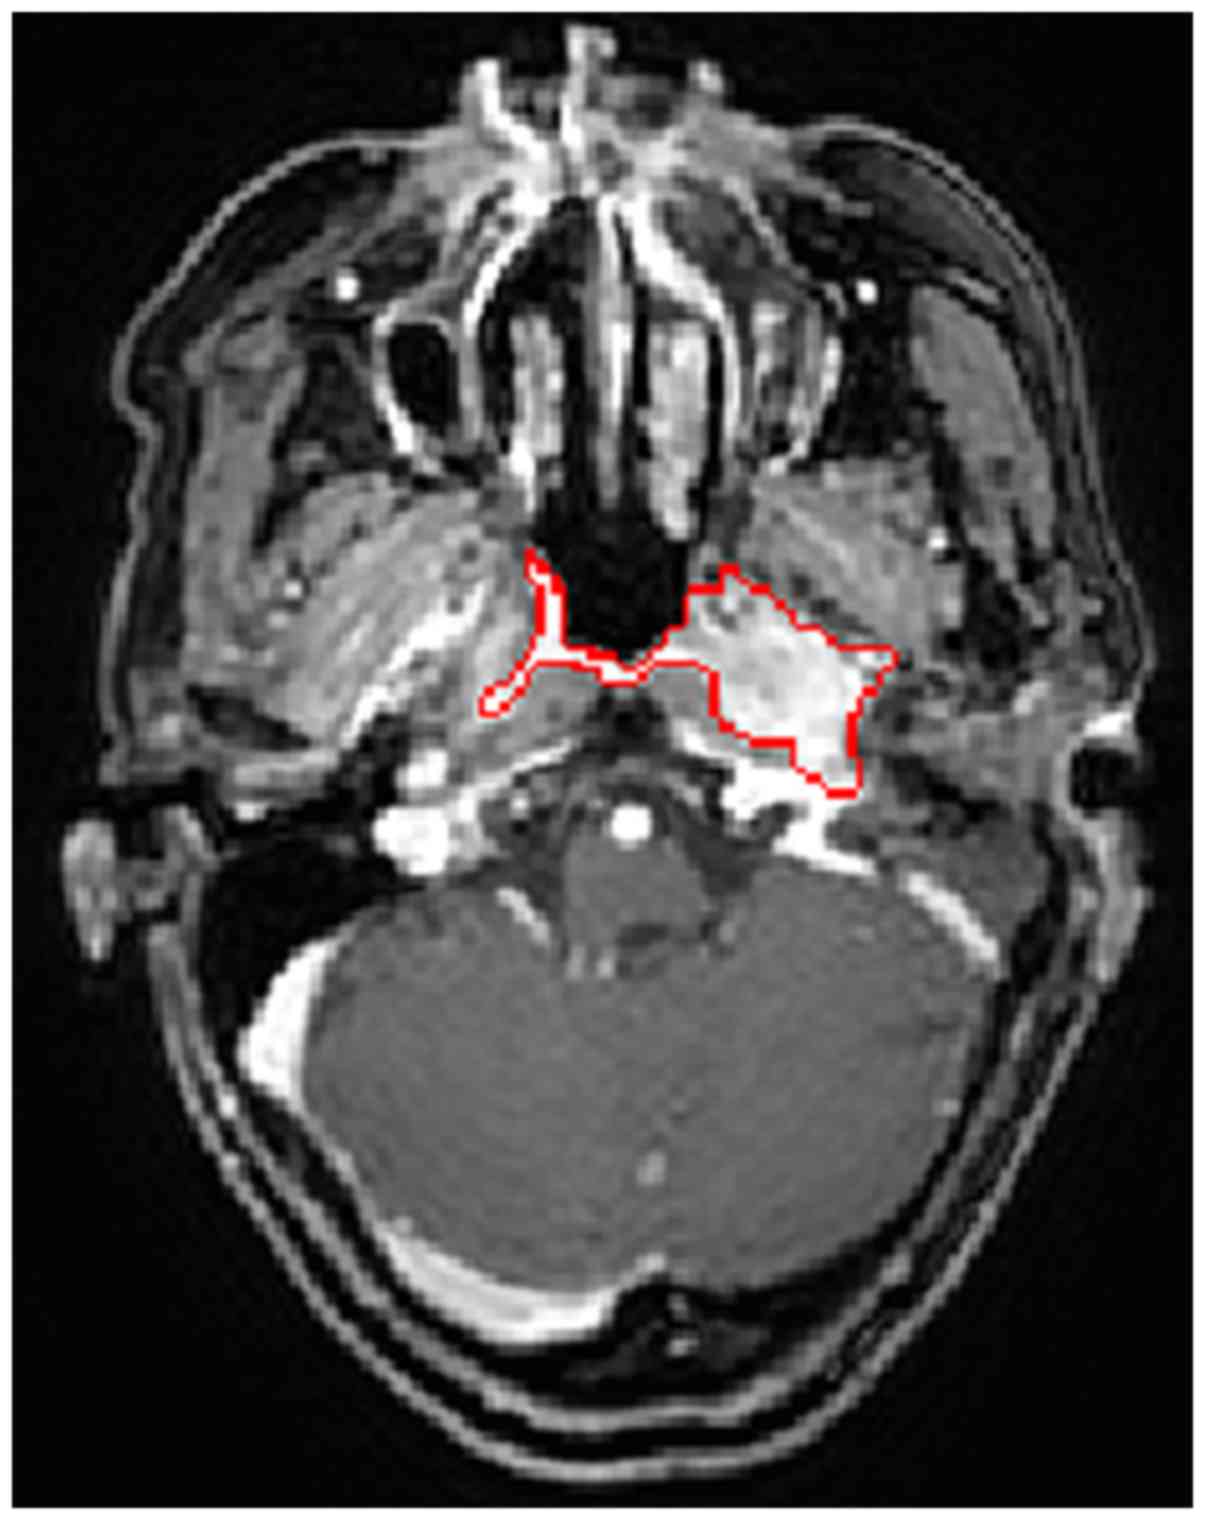
same sequences and acquisition scanners. Fig. 1 presents an annotated slice of an NPC
patient's MR image in the axial view. In this image, the tumor area
has a similar intensity to that of the surrounding area.
Furthermore, the tumor has a highly irregular shape and an
infiltrative growth pattern. The present study focuses on automated
NPC segmentation of MR images.
Only a small number of studies on semi-automated or
automated NPC segmentation are available, likely due to the
segmentation challenge and the low incidence of NPC in most
countries. Current NPC segmentation approaches may be categorized
into three groups: intensity-based, shape-based and statistical
approaches.
Intensity-based methods mainly utilize image
intensities. Lee et al (2)
introduced an algorithm including image masking, Bayesian
probability calculation and seed growing for NPC segmentation. The
algorithm was required to be initiated by the user and was
evaluated on contrast-enhanced T1-weighted imaging (T1WI) and T2WI.
In another, separate study, the initial seed for region growing was
generated from probabilistic maps based on prior knowledge of
location, intensities and non-tumor regions, forming an automated
NPC segmentation framework of CT images (3). In this method, only one seed is
selected, which may not be the optimal one. A modified region
growing method with localization of computed tomography (CT) images
for NPC segmentation was introduced in another study (4), wherein two seeds were asynchronously
generated for each testing image, and the first seed relied on the
corresponding standard ground truth (GT) images. Since NPC has a
similar intensity to that of nearby tissues, intensity-based
segmentation methods may have a limited performance.
For the shape-based method, information on size,
contour and shape are utilized. Huang et al (5) proposed an automated NPC segmentation
method in MR images. In the method, the adaptive nasopharyngeal
region location was first calculated, and the contour of the tumor
was then estimated by distance regularized level set evolution. A
hidden Markov random field (MRF) model with maximum entropy was
further utilized to refine the segmentation results. Fitton et
al (6) presented a
semi-automated delineation for radiotherapy of NPC and user-driven
delineation assisted by a snake algorithm was applied on weighted
CT-MR images. The algorithm reduced the delineation time, but did
not significantly improve the accuracy. In general, the shape-based
method is suitable for segmentation of targets with a uniform size,
contour or shape, which limits the application in NPC segmentation
tasks to a certain extent, as NPCs feature high variations in shape
and size.
Regarding statistical approaches, Zhou et al
(7) introduced a two-class support
vector machine (SVM) for NPC segmentation in MR images, wherein
tumor and non-tumor images were projected onto the feature space
that was initially created, and the projected vectors were then
classified by the SVM. Furthermore, Zhou et al (8) proposed a knowledge-based fuzzy
clustering method for MR images. This method implicitly imposed
certain prior assumptions on the data distribution. However, it is
difficult to predict the data distribution for clinical MR data.
Based on these studies, the accuracy and robustness of automated
NPC segmentation methods requires improvement.
In recent years, deep convolutional neural networks
(CNNs) (9,10), one type of deep learning model, have
been popular in the field of medical image segmentation. Contrary
to traditional machine learning methods, CNNs do not require a set
of hand-crafted features for classification, but automatically
learn hierarchies of complex features directly from the raw input.
Several studies have applied CNNs to the segmentation of knee
cartilage (11), pancreas (12), retinal blood vessels (13) and brain images (14,15).
Furthermore, the application of CNNs has also been investigated for
tumor segmentation. For instance, Pereira et al (16) explored deep small kernel architecture
for segmentation of gliomas in MR images. A shallow CNN with two
convolutional layers separated by max-pooling, followed by one
fully connected layer and a Softmax layer was employed to segment
brain tumor tissues (17). Havaei
et al (18) developed a
two-pathway architecture and a two-stage training for brain tumor
segmentation. A post-processing method based on connected
components was used to remove flat blobs that may appear in the
predictions.
Motivated by the superior performance achieved by
deep CNNs in the field of medical image segmentation, the present
study proposes a two-stage coarse-to-fine framework unifying a deep
CNN and graph cut method for NPC segmentation of MR images.
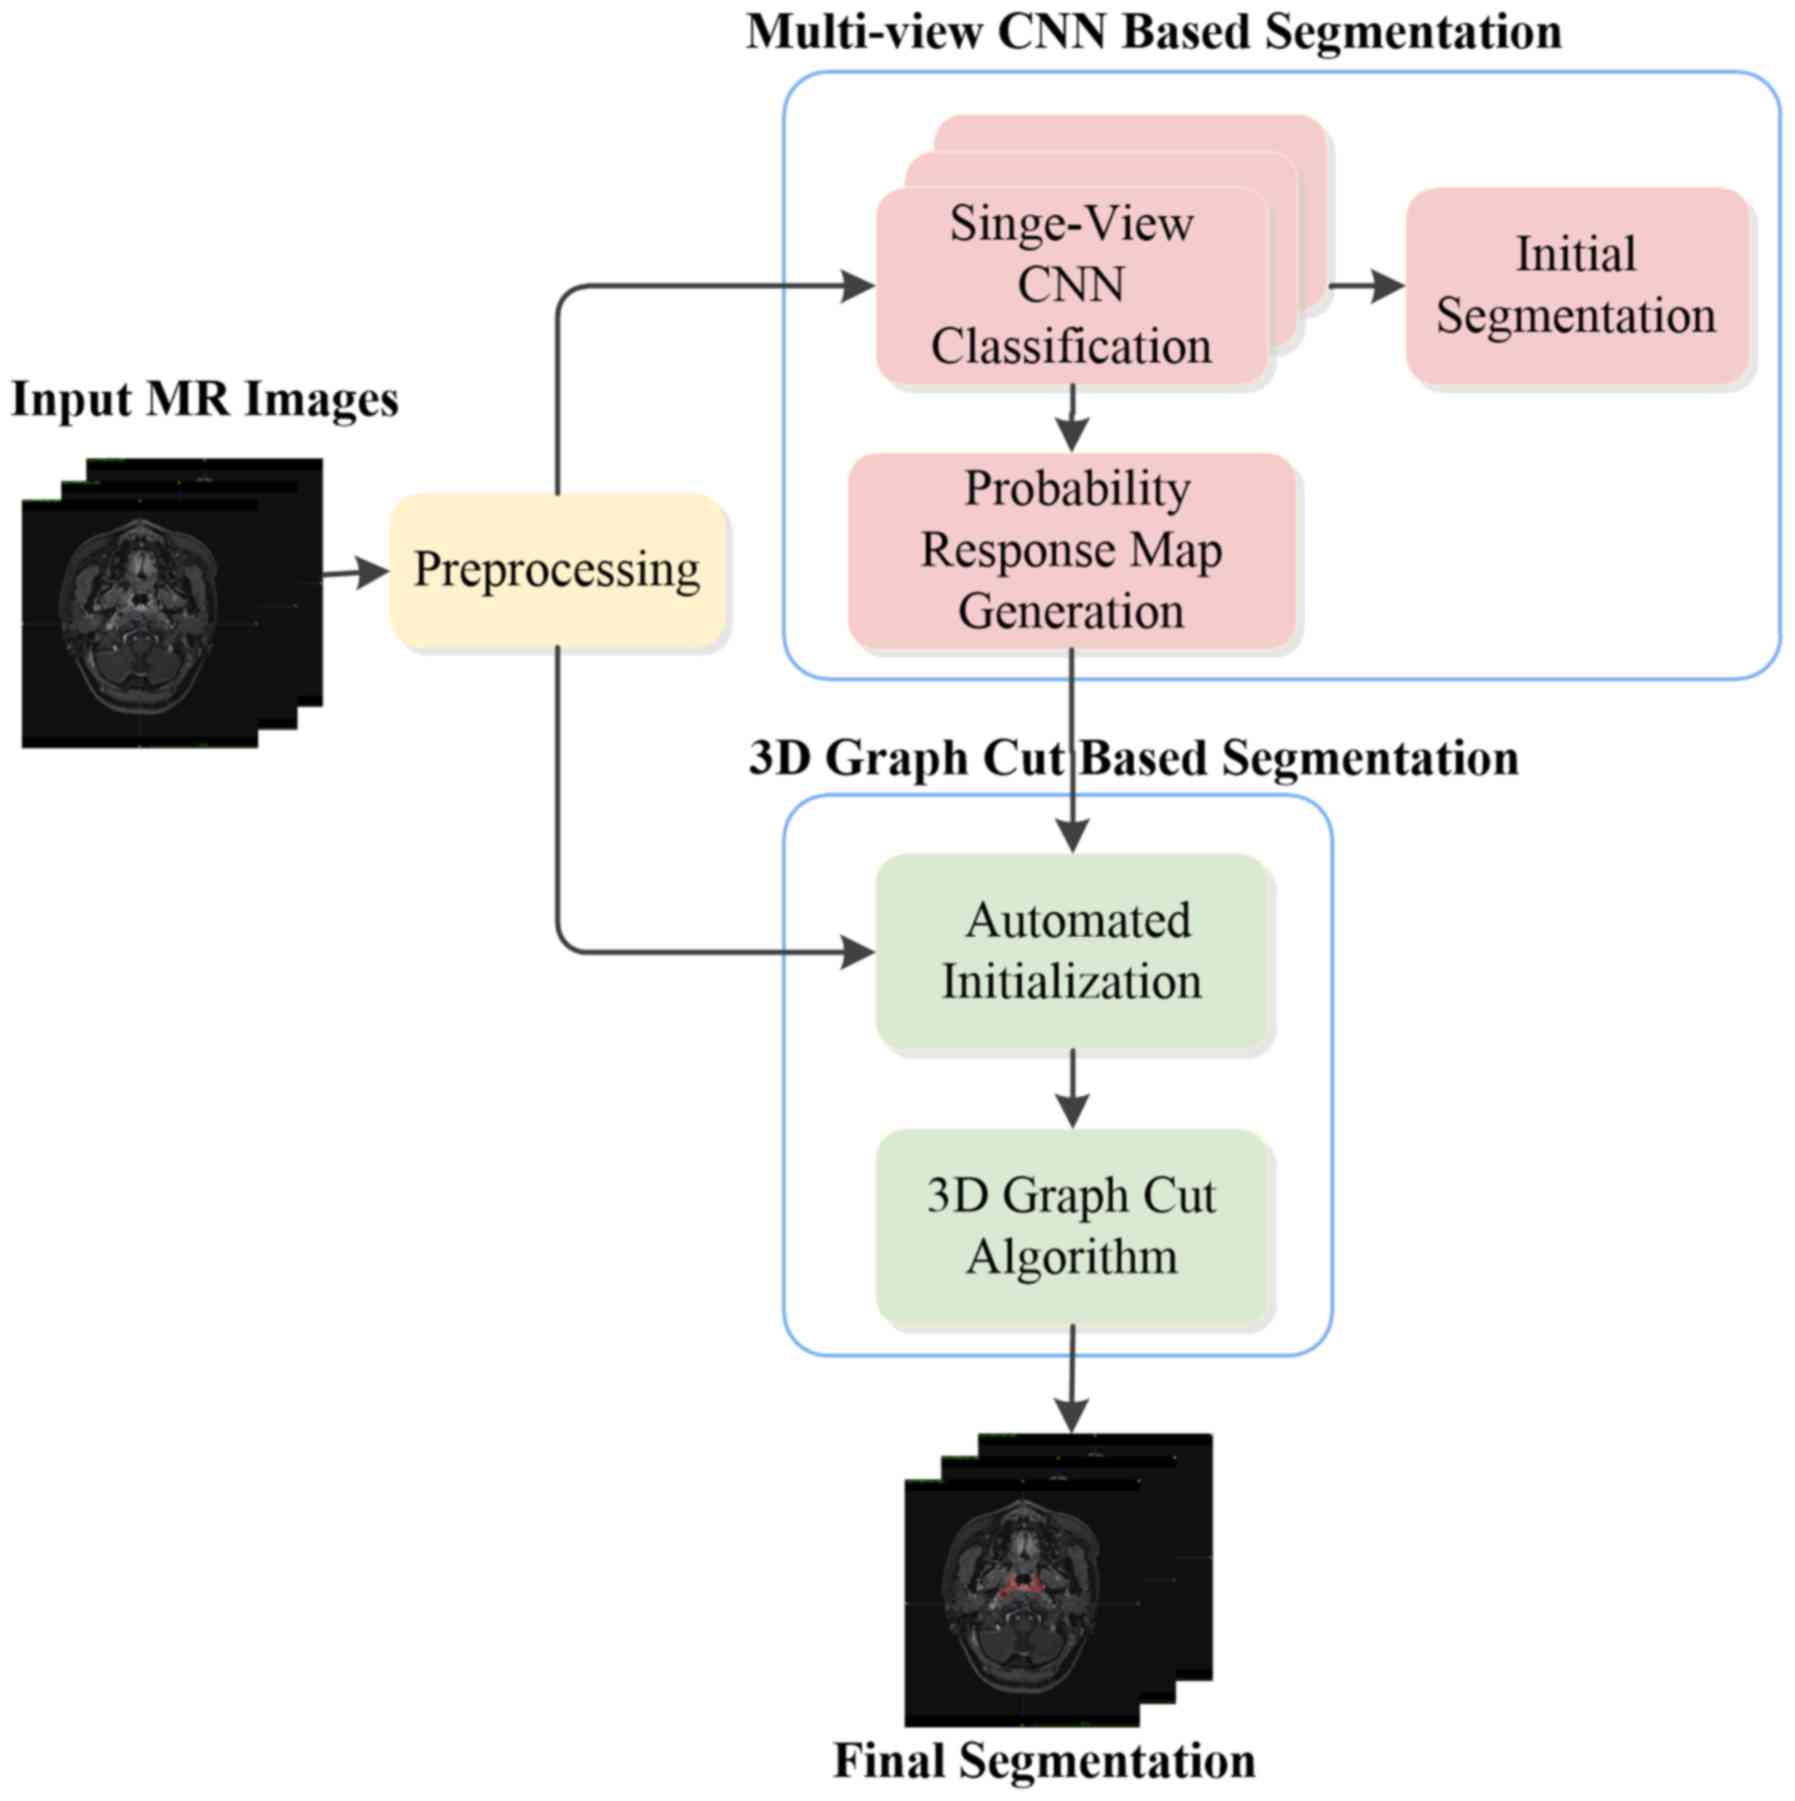
Specifically, a multi-view deep CNN-based segmentation method is
proposed in the first stage. It directly learns hierarchical
features from MR images and utilizes 3-dimensional (3D) context
information via multi-view fusion. A voxel-wise initial
segmentation and a probability response map are subsequently
generated. A 3D graph cut-based segmentation method is proposed to
refine the segmentation results in the second stage. The
probability response map obtained from the multi-view CNN method is
utilized to calculate the region cost and the structure information
of the original MR images is used to calculate the boundary cost. A
preliminary version of the current study was first described in a
conference paper (19). The present
study consolidated the previous study and improved the method. The
proposed method is an early attempt of employing a deep CNN model
and graph cut method for NPC segmentation, and is a fully-automated
approach without any user intervention.
Materials and methods
Materials and data acquisition
In the present exploration study, T1W images
acquired from 30 subjects were used. The age of the patients ranged
from 21 to 76 years with a mean age of 50.2±13.9 years, and the
cohort comprised different cancer stages. The T1W images were
acquired with a Philips Achieva 3T scanner (Philips, Eindhoven, The
Netherlands). The images have the same dimension of 528×528×290 and
the same voxel size of 0.61×0.61×0.8 mm3, ranging from
the top of the head to the neck. Manual segmentation of the
nasopharyngeal tumor was performed by an experienced radiation
oncologist, which was referred as GT. The nasopharyngeal tumor was
contoured for all subjects, which was performed slice by slice (in
the axial view). Fig. 2 presents an
overview of the proposed method, which is described in detail
below.
Image pre-processing
Since the MR image is altered by the bias field
distortion, the Nick's N3 insight segmentation and registration
toolkit implementation for MRI method (20) was applied to each acquired T1W image
for bias correction. The intensity normalization method proposed by
Nyúl et al (21) was then
employed to adjust the contrast and intensity range to a similar
level among different patients. Isotropic resampling was
subsequently performed on each image to achieve a resolution of
1.0×1.0×1.0 mm3. Considering the acquired images include
a large scan volume ranging from head to neck and the
nasopharyngeal tumor only occupies a small region, to reduce the
computational complexity, the nasopharyngeal region of each image
that contained the nasopharyngeal tumor was selected as the volume
of interest in the present study.
Multi-view convolutional neural
network-based segmentation
As in other studies (14–17), the
NPC segmentation problem is considered as a binary classification
problem, which means that each voxel in the image is classified as
a tumor or non-tumor type. According to the typical CNN
architecture for classification, an AlexNet-like CNN architecture
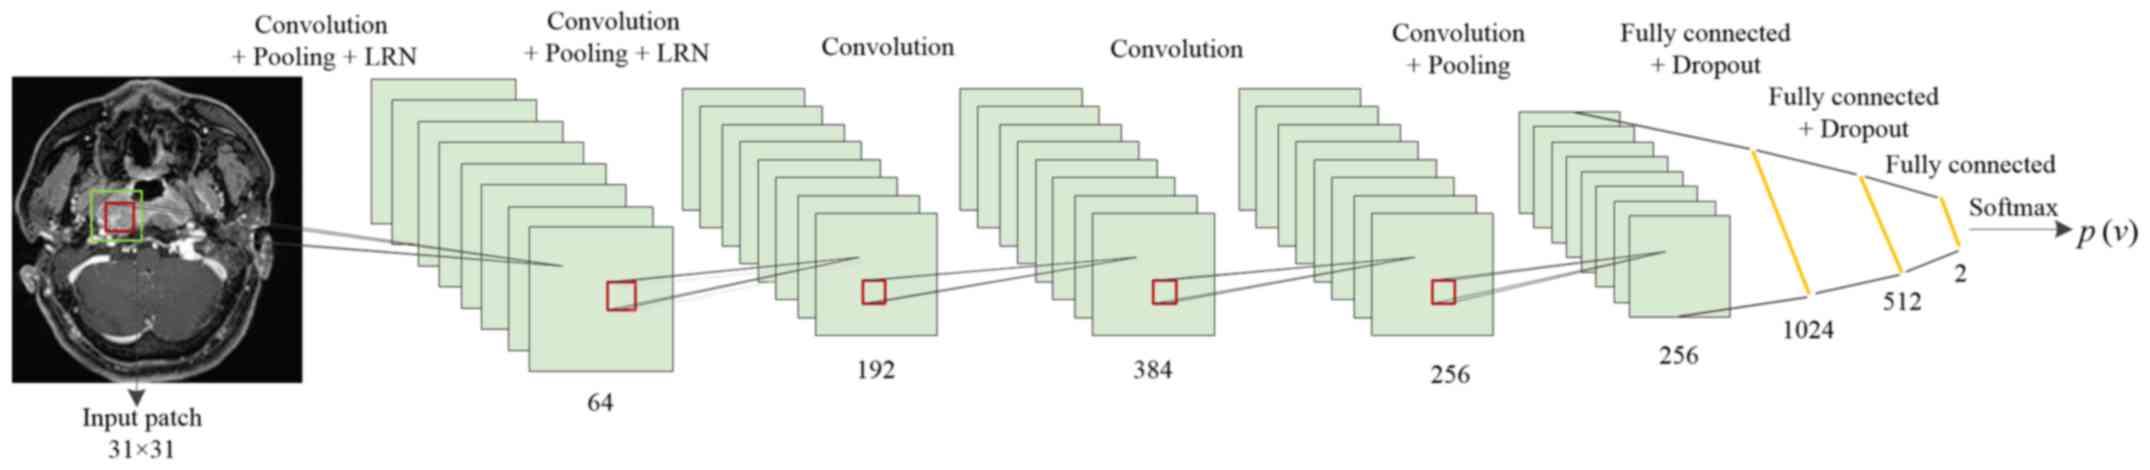
was used for the present NPC segmentation (10). The detailed architecture employed is
presented in Fig. 3. The network
takes image patches as input and consists of eight learned layers,
namely 5 convolutional layers and 3 fully connected layers. In
order to allow the network to learn features that are spatially
invariant with respect to the location and make the representation
more compact, a max pooling layer was used after the first, second
and last convolutional layers. Following the first two max pooling
layers, a local response normalization scheme was applied. To
perform NPC classification, the CNN architecture ends with a 2-way
Softmax layer that computes the following function:
P(y|I)=exp(ay)∑k∈{0,1}exp(ak)
where P(y|I) denotes the probability of patch I
being tumor or non-tumor, with y=0 and y=1 indicating non-tumor and
tumor respectively. ay is each input value to the layer.
The output of this layer ranges from 0 to 1, which may be
interpreted as the likelihood of the center voxel being classified
as tumor or non-tumor.
The number of feature maps contained in the 5
cascaded convolutional layers was designed to 64, 192, 384, 256 and
256, respectively, and the corresponding filter size was set to
3×3. A zero padding strategy and a stride size of one voxel were
used for all convolutional layers. For all pooling layers, a filter
size of 3×3 and a stride size of 2×2 were used to retain extensive
information regarding location. In addition, the output number of
the three fully connected layers was set to 1,024, 512 and 2,
respectively.
In order to avoid overfitting, Dropout was used to
constrain the first two fully connected layers of the CNN (22). In the training stage, Dropout removes
nodes from the network with a probability of 0.5. In this manner,
all nodes of the fully connected layer are required to learn more
robust features and reduce complex co-adaptations with each other.
In the testing stage, all nodes are used. The activation function
is responsible for non-linear transformation of the data. Rectifier
linear units, defined as f(x)=max (0, x), were identified to
expedite the training (10,23) and achieved better results than the
classical sigmoid or hyperbolic tangent functions. Thus, rectifier
linear units are used as the activation function for each
convolutional layer and fully connected layer of the CNN in the
present model.
For patch-based CNN classification, the information
used to infer the class of each voxel in the image is provided in
the form of image patches centered at the target voxel, and certain
size patches were extracted from a specified view perpendicular to
an axis, which may limit the receptive field of the network. To
obtain 3D context information and considering computation
efficiency and memory consumption, the information of patches from
all of the three orthogonal views (coronal, sagittal and axial) was
integrated to classify the target voxel, providing a multi-view CNN
method for NPC segmentation. Specifically, three deep single-view
CNNs use the same architecture as aforementioned but are trained
separately using patches extracted from the three orthogonal views.
Each of them is learned to classify the same target voxel but from
a different perspective (axial, sagittal or coronal). Once the
training process is completed, the three-way trained single-view
CNNs are applied to perform NPC classification and output the
likelihood of each voxel to have a tumor or non-tumor identity,
respectively. This inferential classification information is then
merged by thresholding and determining the statistical majority to
generate the initial segmentation result. Furthermore, the
corresponding probability response map, which provides the
likelihood of each voxel to be assigned to the tumor, is generated
by averaging the class probabilities (p) inferred by the three
networks according to the following formula:
p(1=1|v)=13∑i=13pi(1=1|v,wi,bi)
where l denotes the binary label assigned to the
voxel v with l=1 meaning that the voxel is assigned to the tumor,
and w and b stand for the weight and bias of the CNN network,
respectively. An example slice of the probability response map is
presented in Fig. 4, which is used
to provide prior knowledge in the second stage of the proposed
method.
3D graph cut-based segmentation
Although the above proposed multi-view CNN method
for NPC segmentation is able to capture certain 3D structure
information based on the receptive field from convolution, final
voxel inferences are independent of each other without the
consideration of structural information, and thus, the solution is
not globally optimal. To solve this problem, the approach with an
MRF solved by graph cut was utilized to refine the segmentation. A
graph cut algorithm interprets an image as a graph and formulates
the image segmentation problem as an energy minimization problem.
The energy cost function is defined according to the application
(24–30). Therefore, the graph cut is regarded
as a versatile method. In the second stage of the present method, a
3D graph cut based method was used for NPC segmentation.
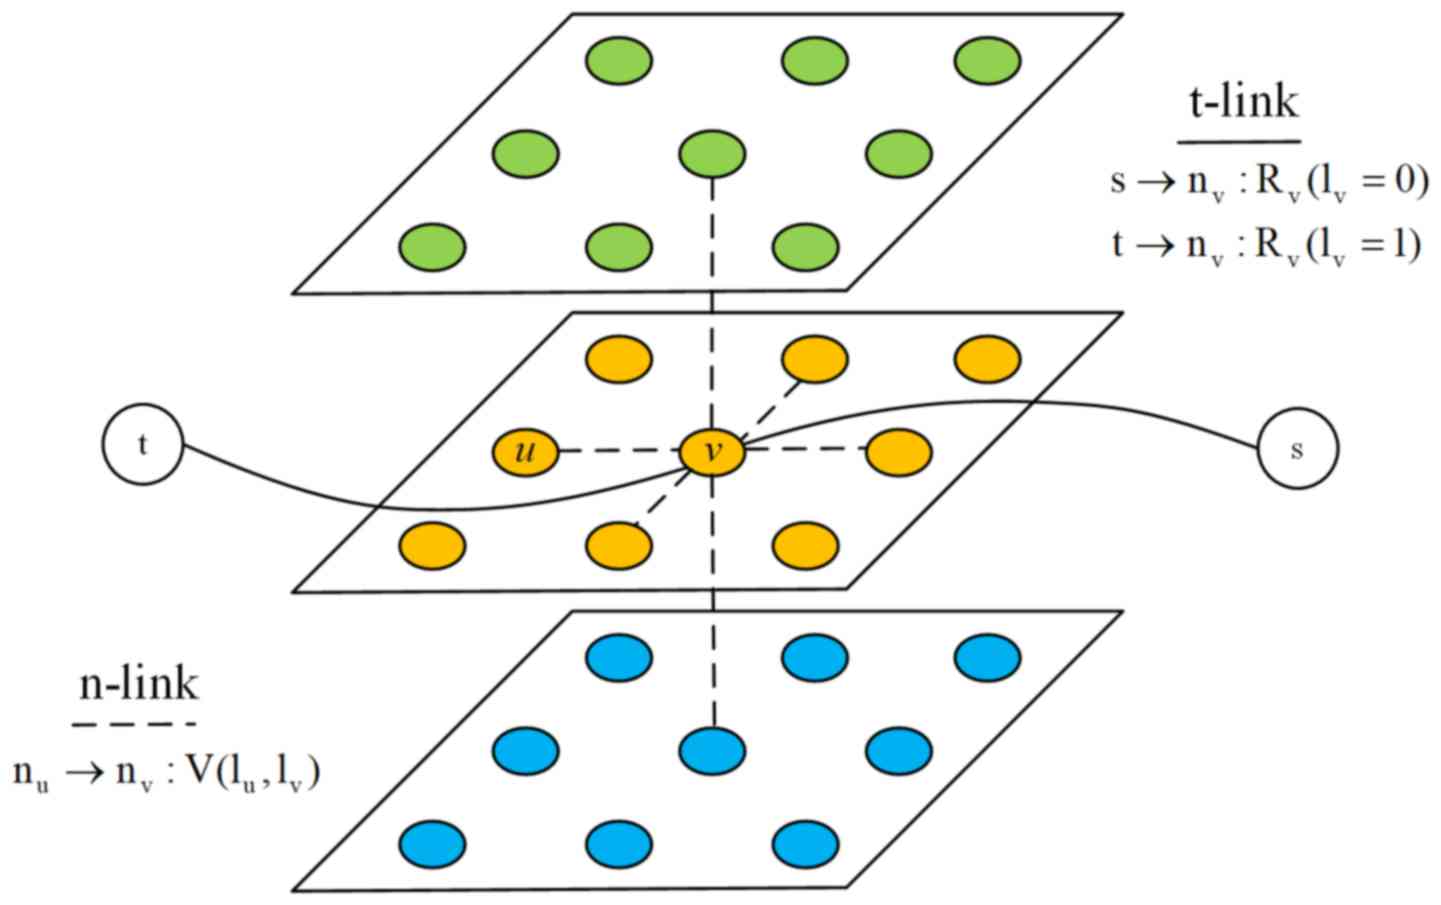
An MR image I of N voxels is considered. The
associated 3D graph is formed by N nodes corresponding to each
voxel of the image, plus two additional nodes known as terminal
nodes. The source s represents the tumor and the sink t represents
the background. Each node at position n in the MR image is
connected to its 6 neighbors forming a 3D neighborhood system.
These neighborhood edges or links are called n-links and each one
of them is weighted by the boundary cost. In addition, each node in
the MR image is connected to the terminal nodes s and t, and these
edges are referred to as t-links and are weighted by the region
cost. Fig. 5 presents the
constructed 3D graph.
The energy cost function for NPC segmentation
consist of region terms and boundary terms as in the well-known
binary graph cut method (25). It
was formulated as follows:
E(1)=∑v∈IR(1v)+∑(u,v)∈SV(1u,1v)
where lv denotes the binary label
assigned to the voxel v, R(lv) represents the region
cost assigned to the voxel, S is the 3D neighborhood system, (u, v)
represent two neighboring voxels in the 3D neighborhood system, and
V (lu, lv) is the corresponding boundary
cost.
Region cost represents the likelihood of a voxel
being assigned to the tumor or background. Generally speaking, to
compute the region term, a seed set that requires user intervention
is initialized at first. Subsequently, a learned intensity model,
e.g., a histogram (25) or a
Gaussian mixture model (29,30), is used to build gray features for the
region term. However, manual help initialization is inconvenient
and the given intensity model may not fit the clinical MR data
distribution in certain situations. To solve these problems, the
probability response map, which is the output of the first stage of
the proposed method, is used to obtain the region term R. The
probability response map is generated directly from the raw MR
image without any prior assumptions on the data distribution, thus
fitting the original image features. As the intensity values of the
probability response map represent the likelihood of each voxel to
be assigned to the tumor, the region cost may be expressed as
follows:
Rv(1v=1)=λ1(1-iv)
Rv(1v=0)=λ2iv
where lv=1 means that the voxel belongs
to the tumor, lv=0 means that the voxel is considered to
be the background, iv denotes the intensity value for
voxel v of the probability response map, and λ1 and
λ2 are the two given scaling constants.
The boundary cost is designed to measure the
difference between the two voxels in the 3D neighborhood and
encourages two similar neighboring voxels to be assigned the same
label. Thus, V(lu, lv) may be expressed as
follows:
V(1u,1v)={Buv,1u≠1v0,if1u=1v}
where Buv is the penalty for assigning
different labels to two neighboring voxels. Typically,
Buv is defined as follows (22):
Buv=λ3exp[-|∇I|2(u,v)2σ2]
where |∇I|2(u, v) represents the squared
intensity gradient between the voxels u and v, σ is a given
parameter associated with acquisition noise and λ3 is a
given scaling constant.
After region and boundary terms are computed, the
energy minimization problem is transformed into a minimum s-t cut
on the constructed 3D graph. The minimum s-t cut, which may be
obtained by solving a maximum flow problem in low-order polynomial
time, separates the 3D graph into two parts, the source set A and
the sink set A with s∈A, t∈A and A∪A=N∪{s, t}. The target NPC
volume in the MR image is defined by those voxels whose
corresponding nodes in the 3D graph belong to the source set.
Since the region cost is derived from the multi-view
CNN method without any user intervention and the boundary term is
designed to enforce the smooth structure, a fully-automated method
was achieved by utilizing the 3D context information and the 3D
structure information.
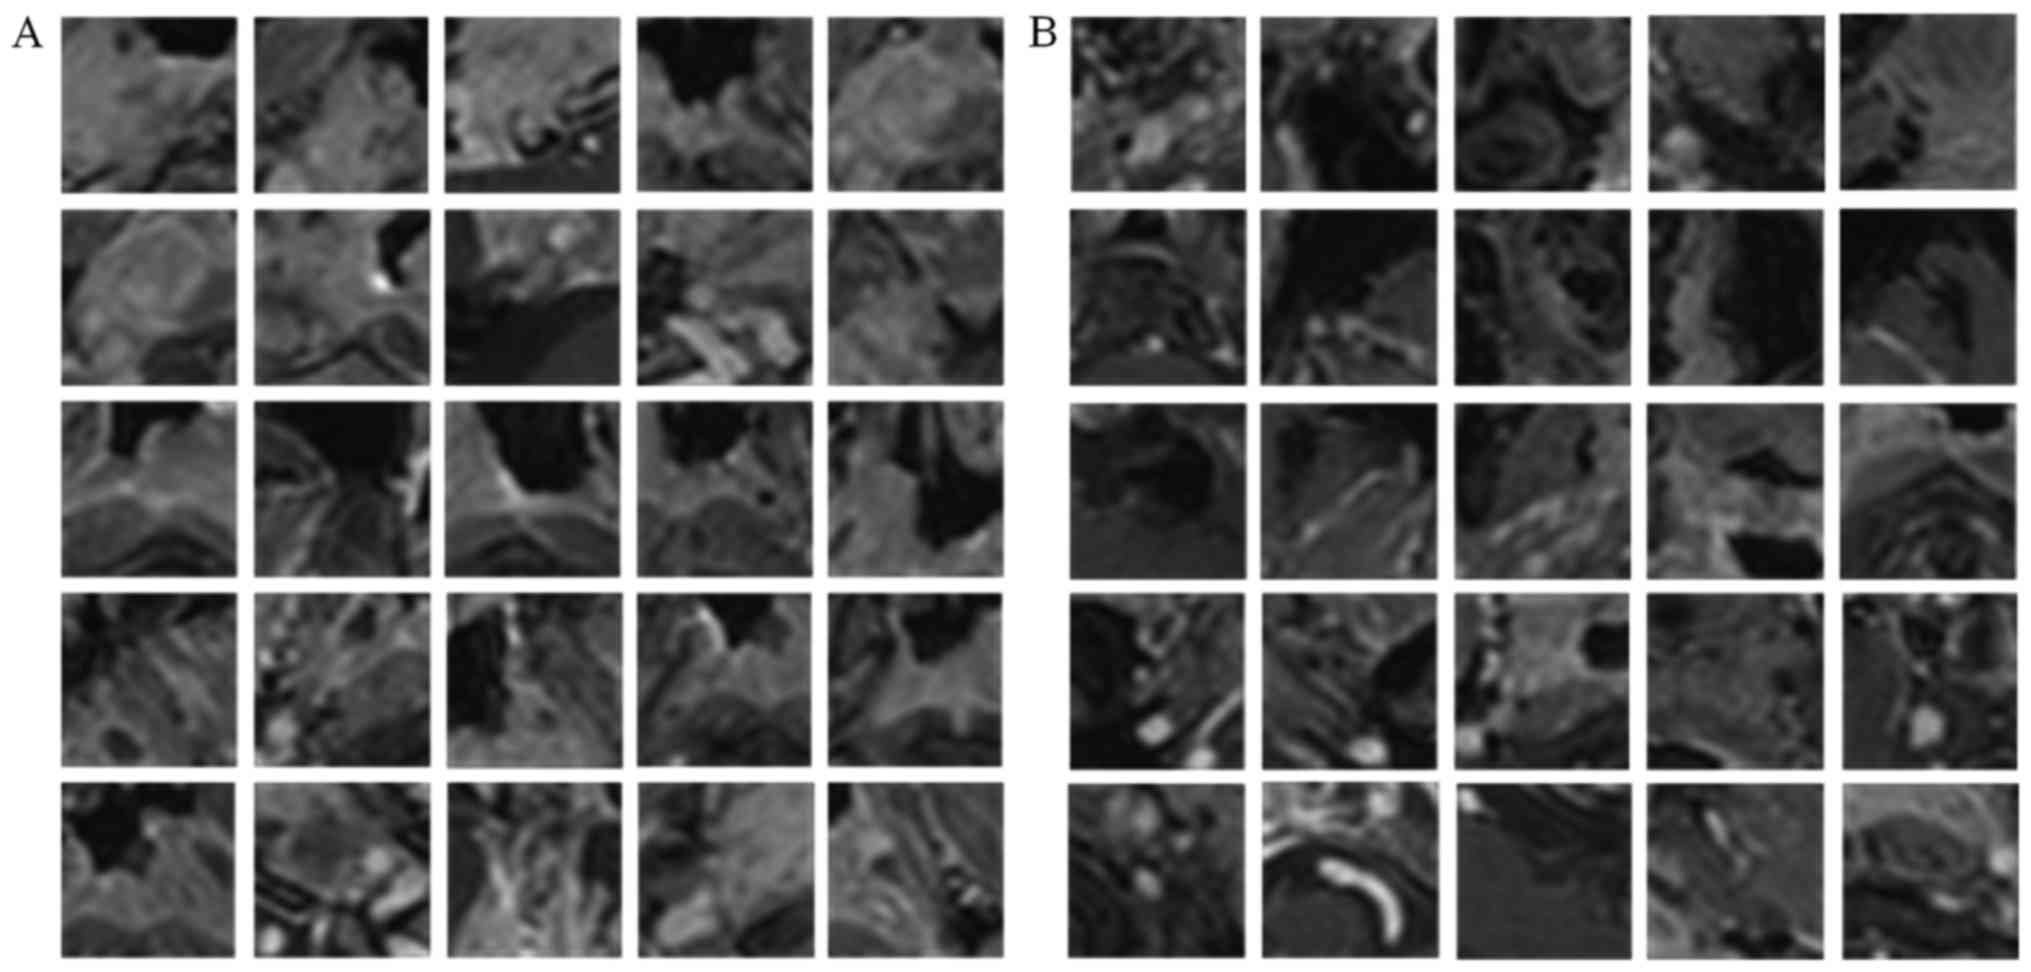
Extraction of patches
The method established above was then experimentally
verified. Information on the classification of each voxel was
provided in the form of image patches, where the target voxel is in
the center, and the single-view CNN was trained separately using
image patches extracted from a specified orthogonal view of the T1W
images and the corresponding labels. For positive patch extraction,
tumor voxels were first randomly selected referring to the manual
GT images and m × m specified view patches (centered at that voxel)
were then extracted. For negative patches extraction, in view of
the fact that segmentation performance is usually affected by
boundary accuracy, the centered non-tumor voxels were constrained
to be selected near the tumor boundary and the same-size patches as
positive patches were extracted as negative patches. In the present
study, m=31 was used, which was experimentally determined. Fig. 6 presents examples of positive and
negative patches extracted from an axial view.
For the nasopharyngeal tumor dataset, a
leave-one-subject-out cross validation strategy was used to
evaluate the segmentation performance. This means that for each
single-view CNN, the training and testing cycle was repeated 30
times. In each iteration, 29 of the 30 NPC images formed the source
of training patches and the remaining image was the source of test
samples. From each training image, 10,000 positive training patches
and an equal number of negative training patches were randomly
sampled, such that the training set comprised ~580,000 patches. At
the testing stage, all corresponding view patches were extracted
from each testing image to increase the accuracy of the
assessment.
Implementation details and parameter
setting
In the present experiments, the CNN-based
classification was implemented in C++ using the Caffe package
(31). To train the network, the
cost function was minimized using a gradient-based optimization
algorithm (9) and the partial
derivatives were computed using the back-propagation algorithm.
Xavier initialization (32) was used
to avoid vanishing back-propagated gradients and Nesterov Momentum
(33) was employed to accelerate the
optimization algorithm. In addition, weight decay was used to
regularize the classification and mini-batch learning was used to
train the network. The detailed parameters are displayed in
Table I.
 | Table I.Convolutional neural network
architecture parameters. |
Table I.
Convolutional neural network
architecture parameters.
|
Stage/parameter | Value |
|---|
| Initialization |
|
|
Weights | Xavier |
|
Bias | 0 |
| Training |
|
| Initial
learning rate | 0.001 |
|
Learning rate decay
policy | Inverse decay |
|
Gamma | 0.0002 |
|
Power | 0.75 |
| Weight
decay | 0.0005 |
|
Momentum | 0.9 |
| Batch
size | 100 |
|
Epochs | 10 |
The 3D graph cut-based segmentation method used in
the present study was implemented in C++. The parameter setting was
empirically employed for all analyzed NPC subjects, with the
coefficients λ1=λ2=1 set for the region term,
and λ3=5 and σ=0.5 for the boundary term.
Evaluation measures
The evaluation of the segmentation performance in
the present study considered four metrics: Average symmetric
surface distance (ASSD), Dice similarity coefficient (DSC), percent
match (PM) and correspondence ratio (CR). The ASSD measures the
boundary surface distance error between the manual GT and the
automated segmentation result, defined as follows:
ASSD=12[∑m∈Msmina∈Asd(m,a)|Ms|+∑a∈Asminm∈Msd(a,m)|As|]
where Ms and As denote the
surface voxels of the manual and the automated segmentation,
respectively, and d(a, m) represents the Euclidean distance between
a and m. The DSC is used for volumetric error measurement and is
calculated as DSC=2TP/(FN+2TP+FP), where TP, FN and FP are the
number of true positive, false negative and false positive voxels,
respectively. PM is the ratio of TP to the number of tumor voxels
in the manual GT, and is defined as PM=TPx100/GT.CR measures the
correspondence of the segmented result and the manual GT by
weighting the importance of TP and FP, and is calculated as
CR=(TP-0.5FP)/GT.
Results and Discussion
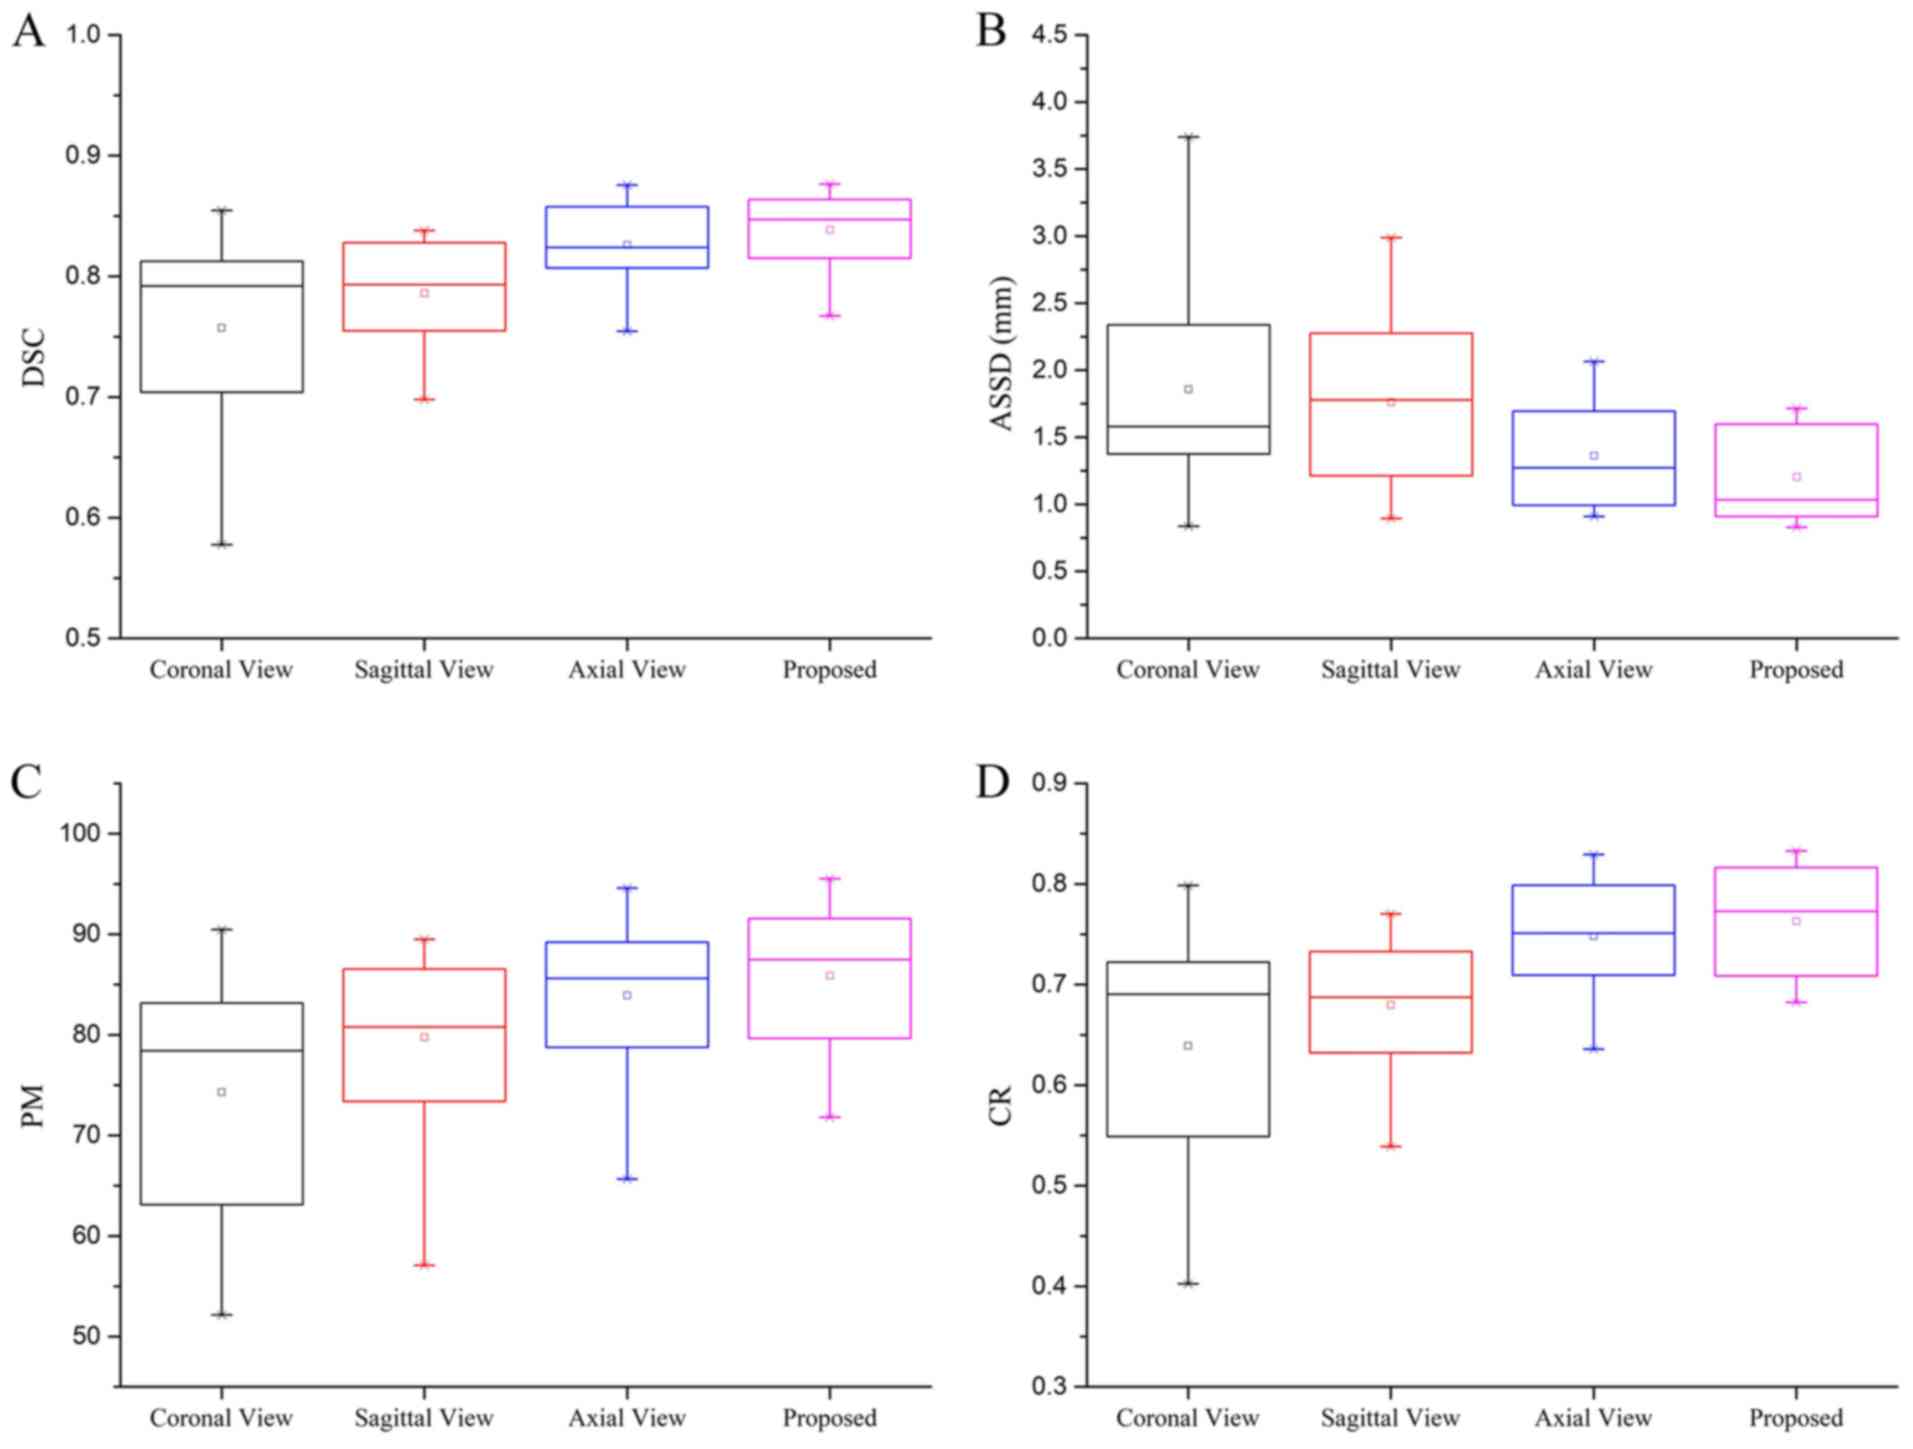
Study of multi-view CNN
classification
To demonstrate the effectiveness of the proposed
multi-view CNN method, the performance achieved by the sagittal,
coronal, and axial view CNN on all subjects was evaluated using
leave-one-subject-out cross validation. Each single-view CNN was
separately trained with the patches of the same size and other
parameters used in the CNN architecture. All initial segmentation
results were post-processed with the same morphological method. The
segmentation performance achieved by the single-view CNNs and the
multi-view CNN method are presented in Fig. 7 using box plots. The results indicate
that the proposed multi-view CNN method outperformed each
single-view method for segmenting NPC. Specifically, the proposed
multi-view CNN method achieved a mean DSC of 0.838. By contrast,
the coronal, sagittal and axial view CNN achieved a mean DSC of
0.757, 0.786 and 0.828, respectively. In terms of ASSD, the
proposed multi-view CNN method gained a mean value of 1.203, while
the single view CNN provided mean values of 1.858, 1.762 and 1.361,
respectively. For the PM and CR, the proposed multi-view CNN method
also achieved the highest mean value among these methods.
Furthermore, as observed from Fig.
7, the proposed multi-view CNN method achieved the smallest
variance. These data demonstrate that by utilizing the 3D context
information, the proposed multi-view CNN method is effective in
improving the segmentation performance and is more stable and
reliable than single view methods. In addition, the axial view CNN
had the best performance among the three single-view CNNs. This may
be explained by the acquisition of the axial view having a higher
spatial resolution than the other two views and providing more
useful information for discriminating the tumors in NPC
subjects.
Validation of the proposed method
Experiments were performed to compare the
performance of the naive 3D graph cut-based method, the proposed
multi-view CNN approach alone and the proposed combined method.
These three methods were applied to all subjects with the same
pre-processing. The naive 3D graph cut-based method refers to the
utilization of the same graph construction procedure, boundary cost
formula and coefficients as the 3D graph cut-based segmentation
described in materials and methods section, while the region cost
was assigned according to the intensity distribution learned from
the manual initialized seed set as reported previously (30).
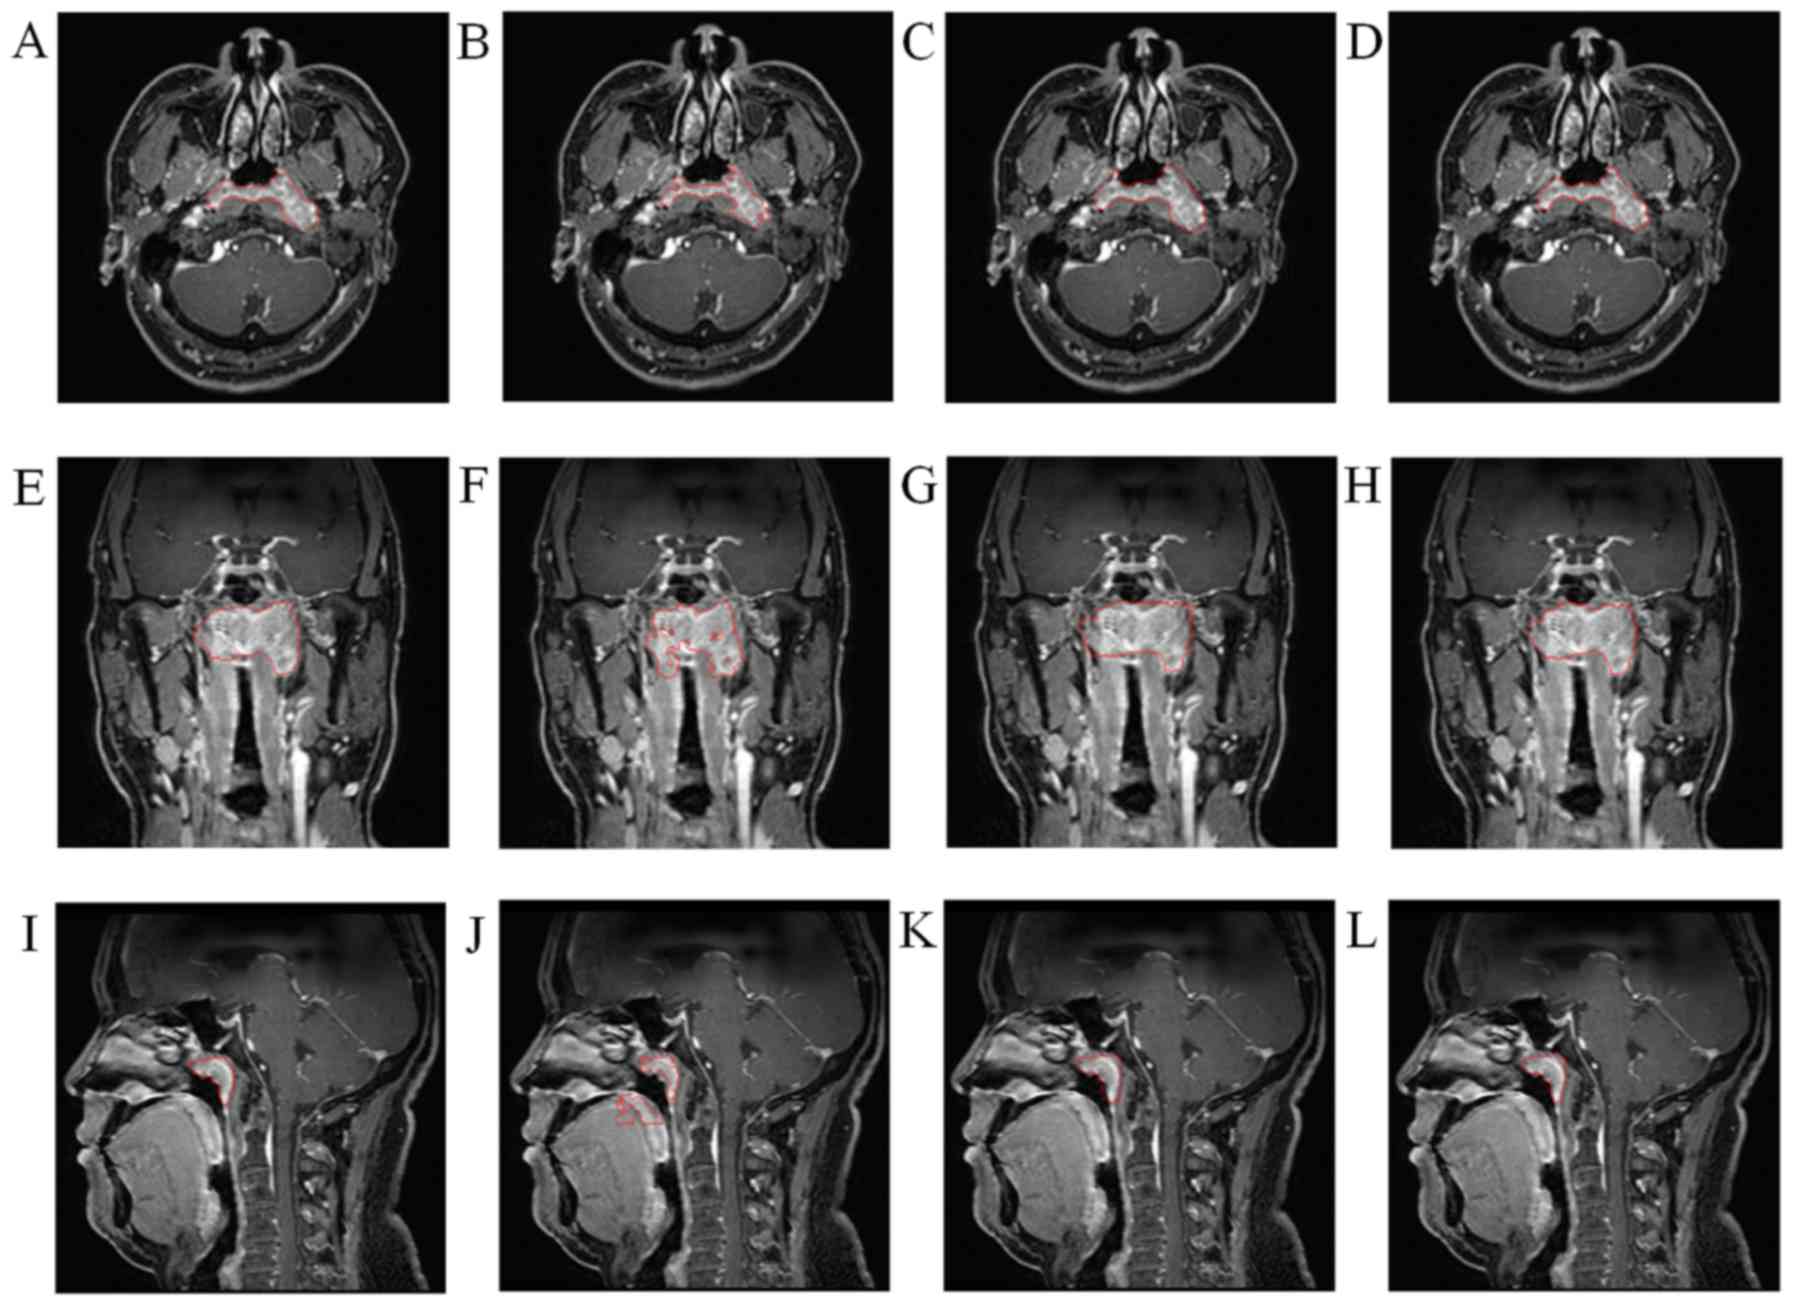
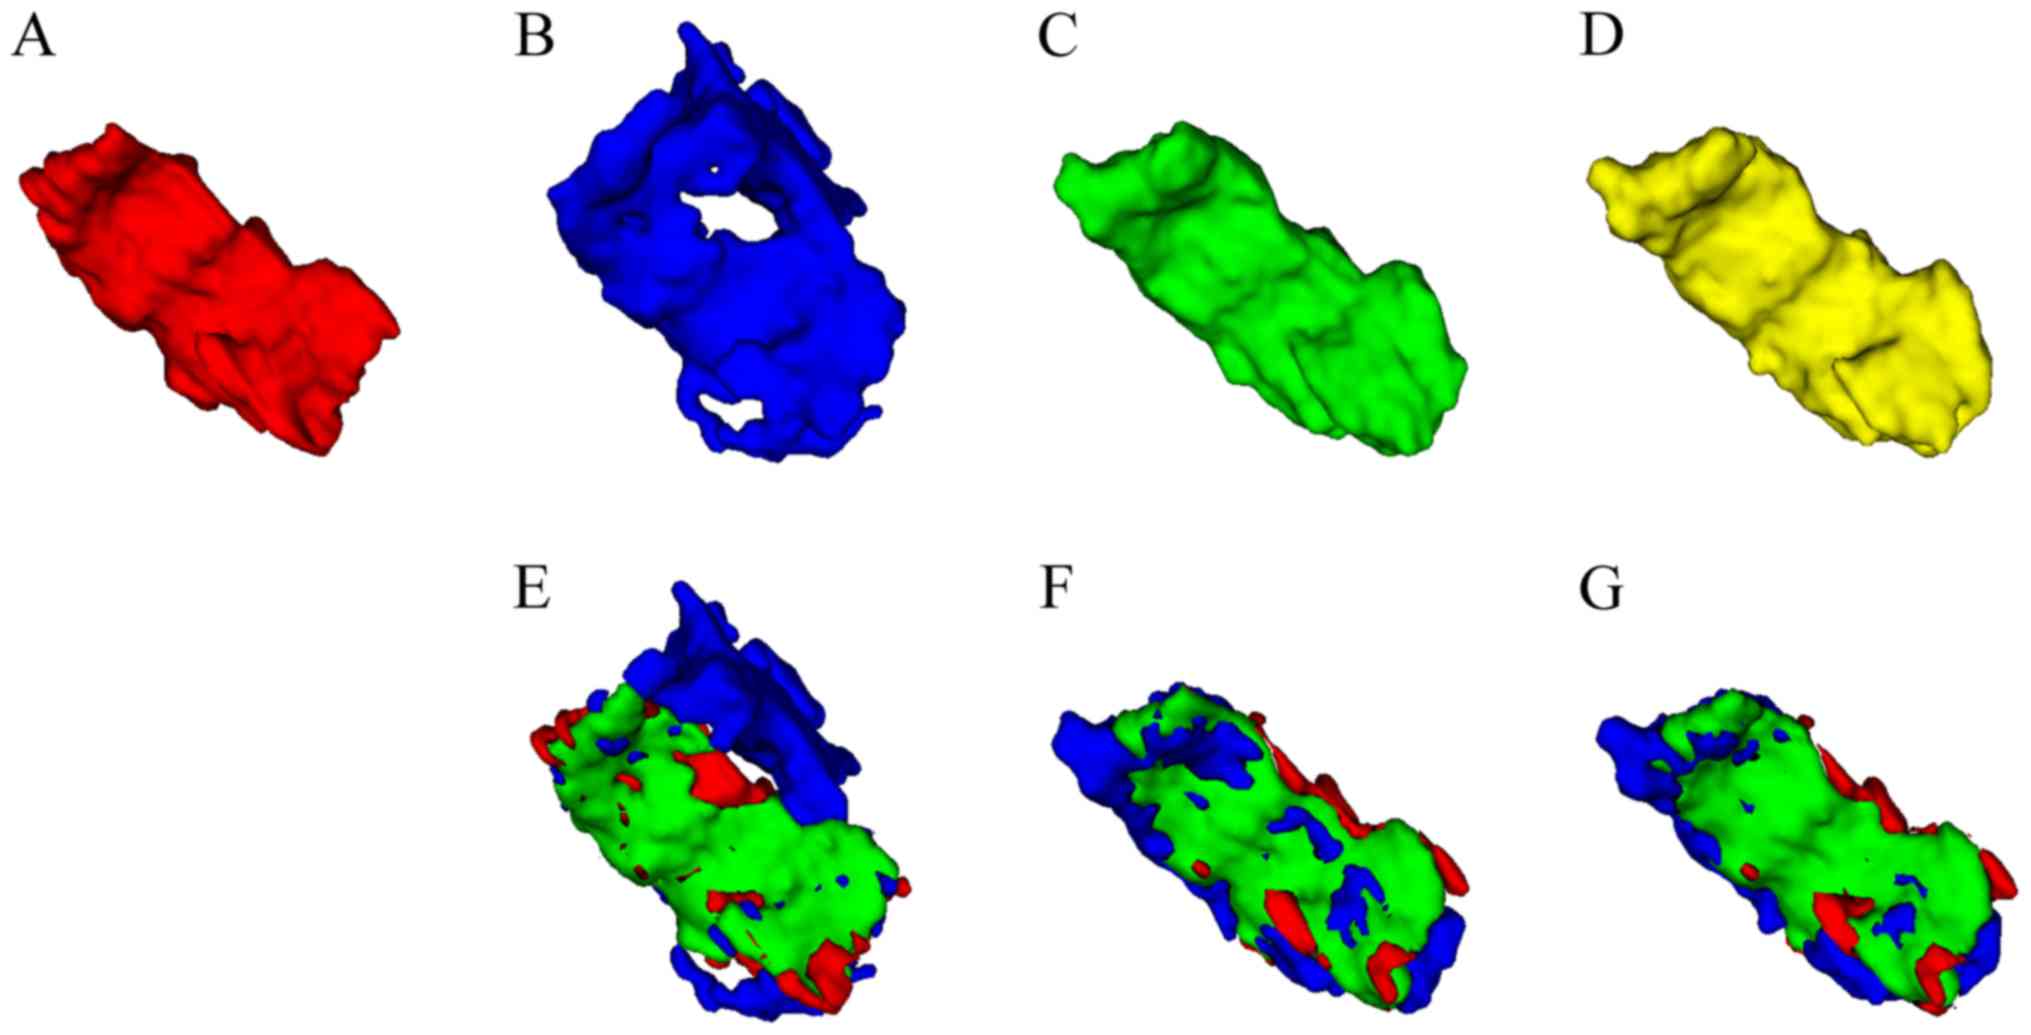
The qualitative results from three views for a
randomly selected subject of the present study are presented in
Fig. 8. It may be observed that the
multi-view CNN method achieved better results than the naive 3D
graph cut and that the proposed combined method further improved
the border quality of the multi-view CNN method. A similar trend is
indicated in the 3D mesh overlay results of the GT and the
corresponding segmentation methods presented in Fig. 9. Furthermore, Fig. 9 clearly indicates that the
segmentation result achieved by the proposed combined method was
closer to the GT than the other two methods.
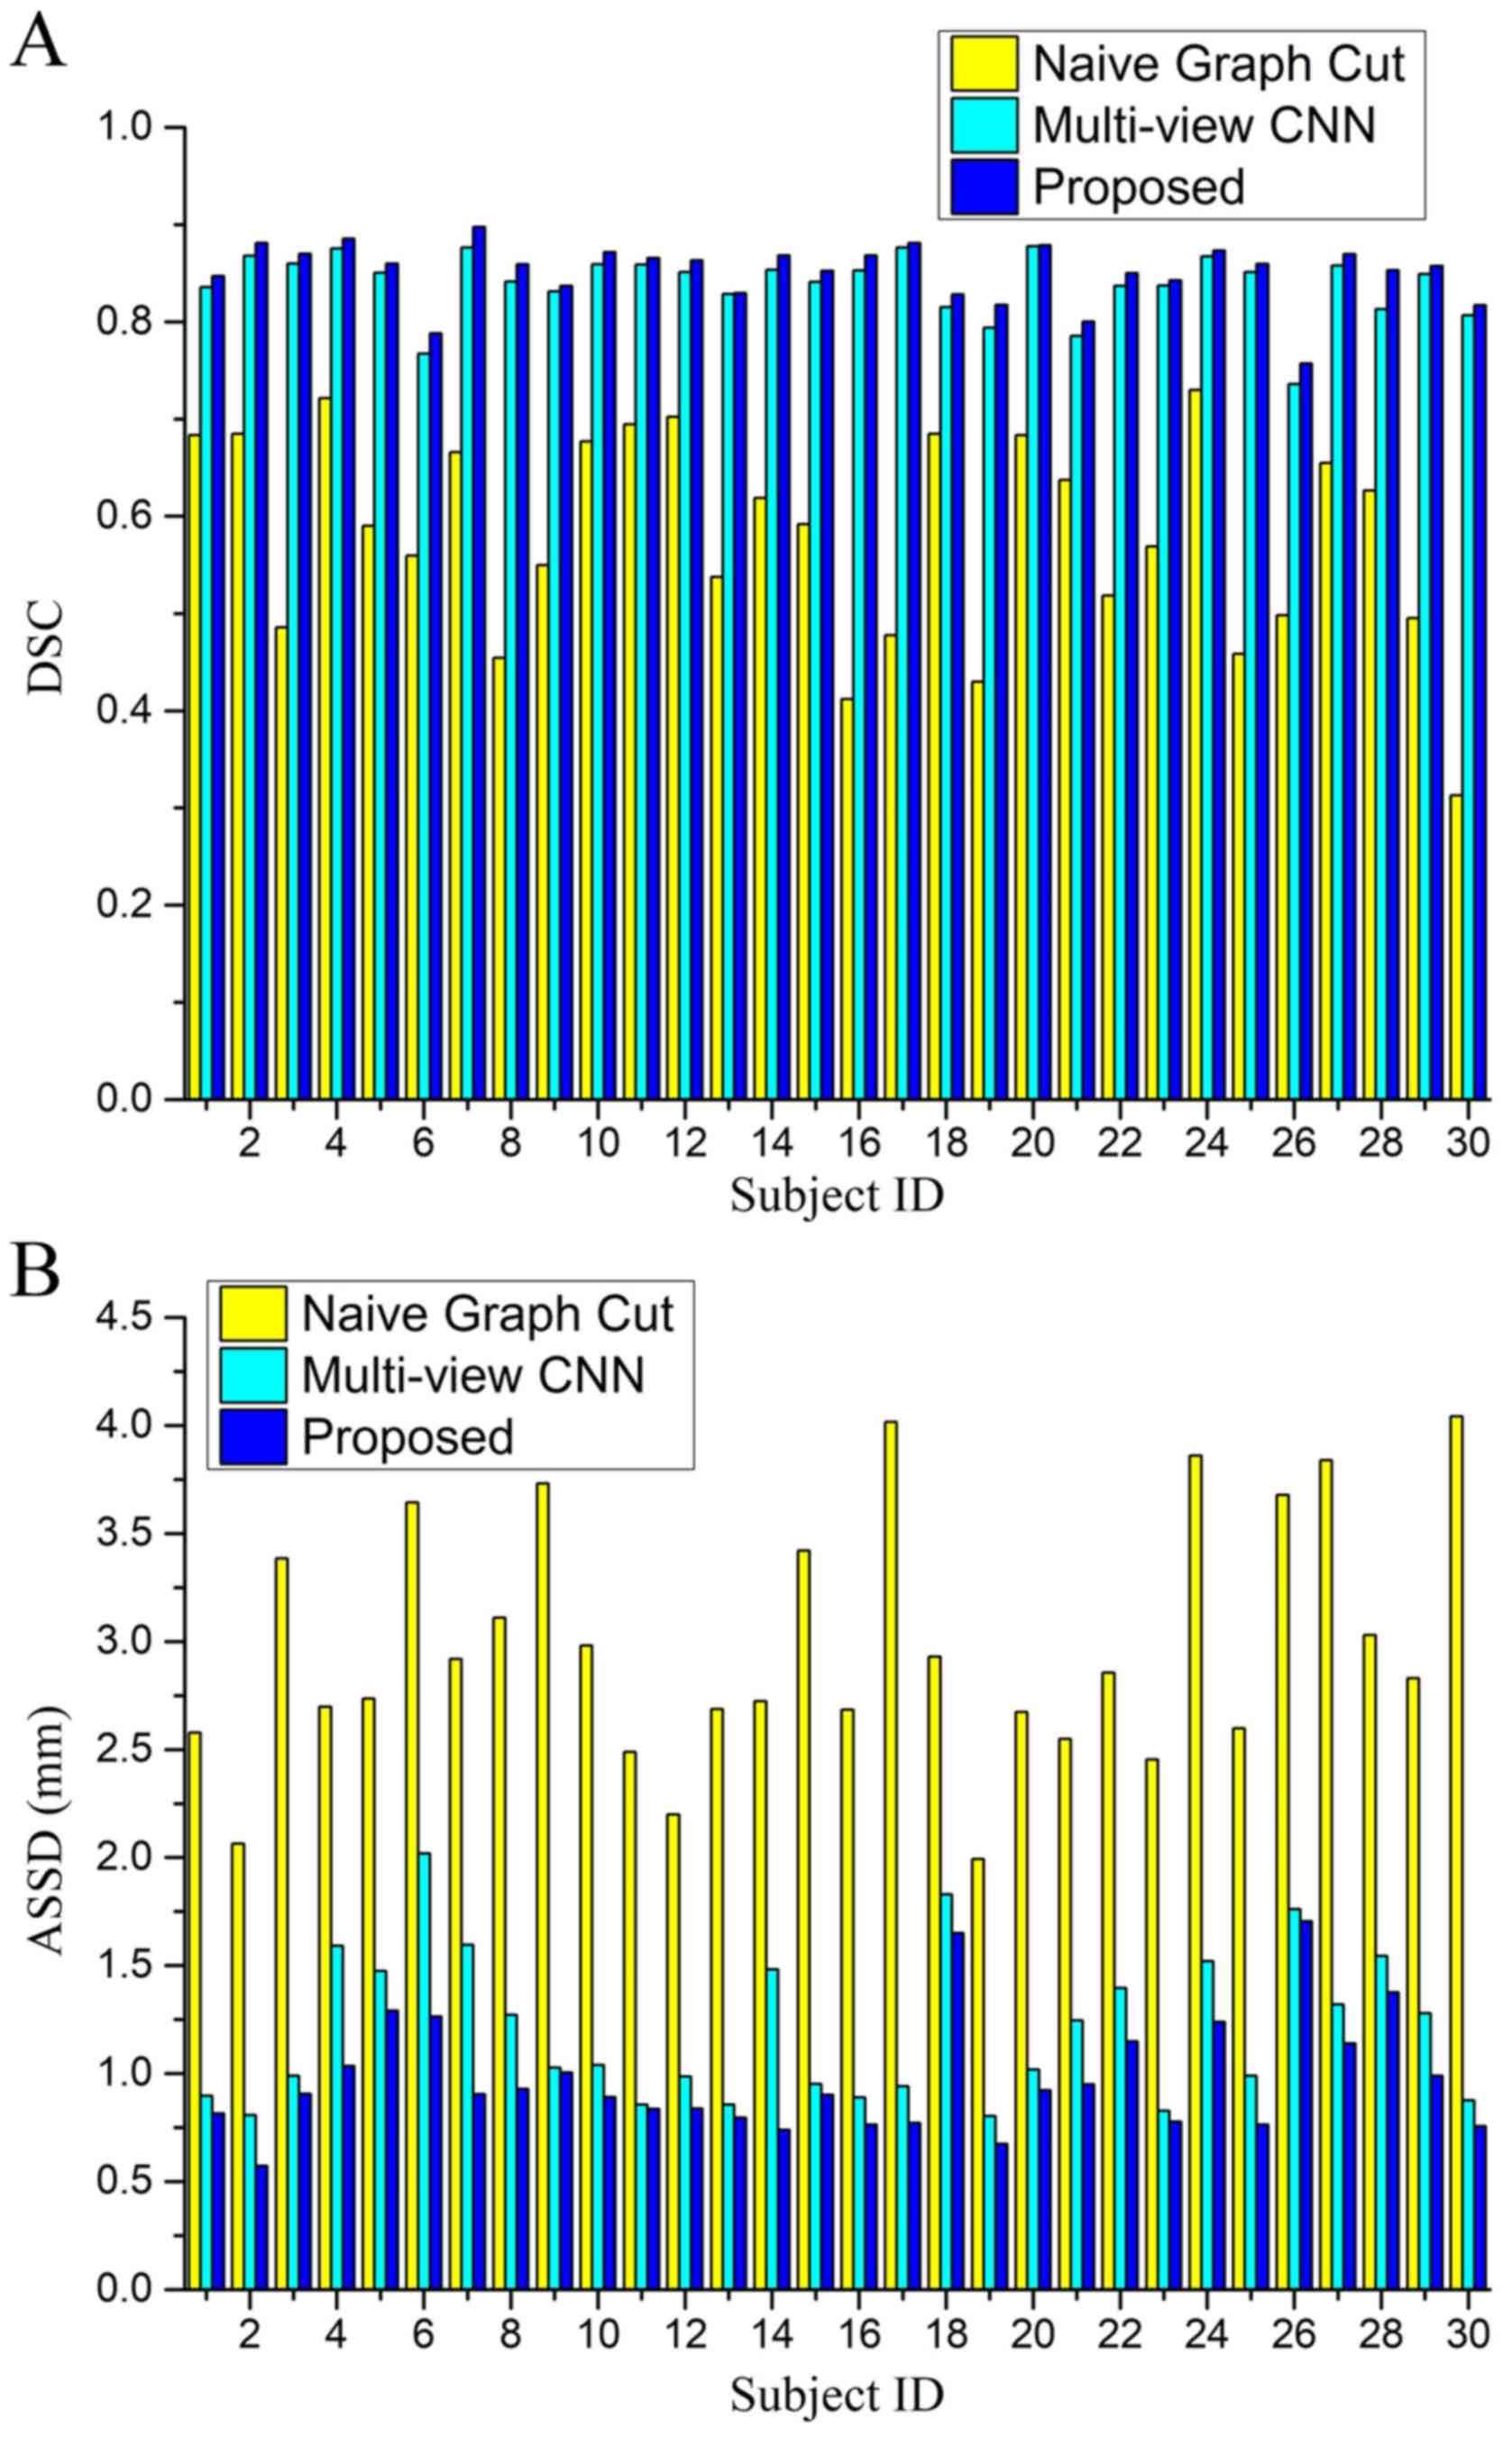
Quantitative evaluation results in terms of the
evaluation metrics DSC and ASSD are summarized in Table II. The results demonstrate that the
proposed combined method achieved a significant improvement.
Fig. 10 provides a comparison of
the performance of the naive 3D graph cut based method, the
proposed multi-view CNN alone approach and the proposed combined
method for all NPC subjects. It may be observed that the proposed
method is effective in all individual cases and has a consistent
segmentation performance in the entire dataset.
| Table II.Summary of quantitative evaluation
for segmentation methods: naive graph-cut, multi-view CNN and
proposed combined method based on the evaluation metrics DSC and
ASSD. |
Table II.
Summary of quantitative evaluation
for segmentation methods: naive graph-cut, multi-view CNN and
proposed combined method based on the evaluation metrics DSC and
ASSD.
| Method | DSC | ASSD (mm) |
|---|
| Naive graph
cut | 0.580±0.108 | 2.980±0.574 |
| Multi-view CNN | 0.838±0.034 | 1.203±0.346 |
| Proposed combined
method | 0.851±0.031 | 0.979±0.270 |
The qualitative and quantitative evaluation results
indicate that the segmentation performance of the naive 3D graph
cut based method was less than satisfactory, which may have been
due to the low intensity contrast between the tumor and its
surrounding tissue. This suggests that the intensity-based method
may not be suitable for the data used. For the proposed multi-view
CNN approach, the segmentation performance significantly
outperformed the naive 3D graph cut method. This is primarily
because the CNN based method is able to automatically extract more
complex features from the raw data and fully utilizes 3D context
information via multi-view fusion. However, this fusion does not
use a true 3D connection. Segmentation inferences for each
individual voxel are independent of each other without considering
structural information. Furthermore, it was observed that certain
misclassified voxels were located in areas with large intensity
contrast, which is clearly visible in Fig. 8. This may be due to the fact that the
CNN method is patch-based, and patches centered at boundary voxels
contain voxels with multiple classifications. In comparison, the
proposed combined method, which was already initialized under
near-optimal conditions by the multi-view CNN method to a certain
extent, utilized 3D structural information and a global optimal
solution provided by the graph cut to further refine the
segmentation. This resulted in a more accurate segmentation,
particularly in the tumor and non-tumor boundary regions.
Comparison with other NPC segmentation
methods
Previously reported NPC segmentation methods
(5,7)
were used to evaluate the proposed combined method and the
comparison results are presented in Table III. PM and CR were selected as
metrics to evaluate the segmentation performance, as they were used
in these two previous methods. It should be noted that comparing
these methods on different dataset may not be sufficiently
objective, but the analysis gives an approximate estimation of the
effectiveness of the method proposed by the present study. It was
indicated that among the methods compared, the method of the
present study obtained the highest mean value for PM and CR and
achieved the lowest standard deviation in most cases, indicating
that the present method is comparable to the previous methods.
| Table III.Comparison with two other previous
segmentation methods for nasopharyngeal carcinoma. |
Table III.
Comparison with two other previous
segmentation methods for nasopharyngeal carcinoma.
| Study | PM | CR | Type | (Refs.) |
|---|
| Huang et al
(2015) | 85.65±10.70 | 0.72±0.10 | Automated | (5) |
| Zhou et al
(2006) | 79.00±7.00 | 0.72±0.06 | Semi-automated | (7) |
| Present study | 85.93±8.17 | 0.77±0.05 | Automated |
|
In conclusion, the present study provided a novel
fully-automated method for NPC segmentation of MR images. The
proposed method combines a deep CNN model and a 3D graph cut method
in a two-stage manner. First, a multi-view deep CNN-based
segmentation method is performed, which directly learns features
from data and fully utilizes 3D context information via multi-view
fusion. In order to solve the true 3D structure and enforce
smoothness, the multi-view CNN method was then combined into a
graph cut framework. Since the multi-view CNN method provides
initialization for the subsequent graph cut method, a
fully-automated approach was achieved without any user
intervention. The experimental results then verified that the
present approach is effective and accurate for NPC
segmentation.
Acknowledgements
The authors would like to thank Dr Shanhui Sun,
CuraCloud Corporation (Seattle, WA, USA) for his valuable
suggestions and proofreading of the manuscript. Part of the results
published in the present study were previously presented at the
2017 International Conference on the Frontiers and Advances in Data
Science on 23–25 October in China (19).
Funding
The present study was supported in part by the
National Natural Science Foundation of China (grant no.
NSFC61701324).
Availability of data and materials
The datasets used and/or analyzed during the
current study are available from the corresponding author on
reasonable request.
Authors' contributions
ZM, XW, QS and JZ conceived and designed the
present study. ZM, XW and YL collected data and prepared the study.
ZM and QS performed the experiments and wrote the manuscript. YW
helped perform the analysis with constructive discussions. All
authors have read and approved the final study.
Ethical approval and consent to
participate
The present study was approved by the Ethics
Committee of West China Hospital (Chengdu, China) and all patients
gave written informed consent.
Patient consent for publication
Not applicable.
Competing interests
The authors declare that they have no competing
interests.
References
|
1
|
Chang ET and Adami HO: The enigmatic
epidemiology of nasopharyngeal carcinoma. Cancr Epidemiol
Biomarkers Prev. 15:1765–1777. 2006. View Article : Google Scholar
|
|
2
|
Lee FK, Yeung DK, King AD, Leung SF and
Ahuja A: Segmentation of nasopharyngeal carcinoma (NPC) lesions in
MR images. Int J Radiat Oncol Biol Phys. 61:608–620. 2005.
View Article : Google Scholar : PubMed/NCBI
|
|
3
|
Tatanun C, Ritthipravat P, Bhongmakapat T
and Tuntiyatorn L: Automatic segmentation of nasopharyngeal
carcinoma from CT images: Region growing based technique. Signal
Processing Systems (ICSPS), 2010. 2nd International Conference on.
2010.(DOI: 10.1109/ICSPS.2010.5555663). View Article : Google Scholar
|
|
4
|
Chanapai W, Bhongmakapat T, Tuntiyatorn L
and Ritthipravat P: Nasopharyngeal carcinoma segmentation using a
region growing technique. Int J Comput Assist Radiol Surg.
7:413–422. 2012. View Article : Google Scholar : PubMed/NCBI
|
|
5
|
Huang KW, Zhao ZY, Gong Q, Zha J, Chen L
and Yang R: Nasopharyngeal carcinoma segmentation via HMRF-EM with
maximum entropy. Conf Proc IEEE Eng Med Biol Soc. 2968–2972.
2015.(DOI: 10.1109/EMBC.2015.7319015). PubMed/NCBI
|
|
6
|
Fitton I, Cornelissen SA, Duppen JC,
Steenbakkers RJ, Peeters ST, Hoebers FJ, Kaanders JH, Nowak PJ,
Rasch CR and van Herk M: Semi-automatic delineation using weighted
CT-MRI registered images for radiotherapy of nasopharyngeal cancer.
Med Phys. 38:4662–4666. 2011. View Article : Google Scholar : PubMed/NCBI
|
|
7
|
Zhou J, Chan KL, Xu P and Chong VFH:
Nasopharyngeal carcinoma lesion segmentation from MR images by
support vector machine. In Biomedical Imaging: Nano to Macro, 2006.
The 3rd IEEE International Symposium on. 2006.(DOI:
10.1109/ISBI.2006.1625180).
|
|
8
|
Zhou J, Lim TK, Chong V and Huang J:
Segmentation and visualization of nasopharyngeal carcinoma using
MRI. Comput Biol Med. 33:407–424. 2003. View Article : Google Scholar : PubMed/NCBI
|
|
9
|
LeCun Y, Bottou L, Bengio Y and Haffner P:
Gradient-based learning applied to document recognition. Proc IEEE.
86:2278–2324. 1998. View Article : Google Scholar
|
|
10
|
Krizhevsky A, Sutskever I and Hinton GE:
ImageNet classification with deep convolutional neural networks.
Adv Neural Inf Process Syst. 1:1097–1105, 2012. 2012.
|
|
11
|
Prasoon A, Petersen K, Igel C, Lauze F,
Dam E and Nielsen M: Deep feature learning for knee cartilage
segmentation using a triplanar convolutional neural network. Med
Image Comput Comput Assist Interv. 16:246–253. 2013.PubMed/NCBI
|
|
12
|
Roth HR, Farag A, Lu L, Turkbey EB and
Summers RM: Deep convolutional networks for pancreas segmentation
in CT imaging. SPIE Med Imag. 94131G. 2015.(DOI:
10.1117/12.2081420).
|
|
13
|
Liskowski P and Krawiec K: Segmenting
retinal blood vessels with deep neural networks. IEEE Trans Med
Imaging. 35:2369–2380. 2016. View Article : Google Scholar : PubMed/NCBI
|
|
14
|
Zhang W, Li R, Deng H, Wang L, Lin W, Ji S
and Shen D: Deep convolutional neural networks for multi-modality
isointense infant brain image segmentation. Neuroimage.
108:214–224. 2015. View Article : Google Scholar : PubMed/NCBI
|
|
15
|
Moeskops P, Viergever MA, Mendrik AM, de
Vries LS, Benders MJ and Isgum I: Automatic segmentation of MR
brain images with a convolutional neural network. IEEE Trans Med
Imaging. 35:1252–1261. 2016. View Article : Google Scholar : PubMed/NCBI
|
|
16
|
Pereira S, Pinto A, Alves V and Silva CA:
Brain tumor segmentation using convolutional neural networks in MRI
images. IEEE Trans Med Imaging. 35:1240–1251. 2016. View Article : Google Scholar : PubMed/NCBI
|
|
17
|
Zikic D, Ioannou Y, Brown M and Criminisi
A: Segmentation of brain tumor tissues with convolutional neural
networks. MICCAI Multi Brain Tumor Segment Challeng (BraTS).
2014:36–39. 2014.
|
|
18
|
Havaei M, Ddavy A, Warde-Farley D, Biard
A, Courville A, Bengio Y, Pal C, Jodoin PM and Larochelle H: Brain
tumor segmentation with deep neural networks. Med Image Anal.
35:18–31. 2017. View Article : Google Scholar : PubMed/NCBI
|
|
19
|
Ma ZQ, Wu X and Zhou JL: Automatic
nasopharyngeal carcinoma segmentation in MR images with
convolutional neural networks. 2017 Int Conference Front Adv Data.
147–150. 2017. View Article : Google Scholar
|
|
20
|
Tustison NJ, Avants BB, Cook PA, Zheng Y,
Eqan A, Yushkevich PA and Gee JC: N4ITK: Improved N3 bias
correction. IEEE Trans Med Imaging. 29:1310–1320. 2010. View Article : Google Scholar : PubMed/NCBI
|
|
21
|
Nyúl LG, Udupa JK and Zhang X: New
variants of a method of MRI scale standardization. IEEE Trans Med
Imaging. 19:143–150. 2000. View Article : Google Scholar : PubMed/NCBI
|
|
22
|
Hinton GE, Srivastava N, Krizhevsky A,
Sutskever I and Salakhutdinov RR: Improving neural networks by
preventing co-adaptation of feature detectors. Neural Evolution
Comput. 2012.
|
|
23
|
Jarrett K, Kavukcuogly K, Ranzato M and
LeCun Y: What is the best multi-stage architecture for object
recognition? IEEE. 1–2153. 2009.
|
|
24
|
Boykov Y, Veksler O and Zabih R: Fast
approximate energy minimization via graph cuts. IEEE Trans Pattern
Anal Mach Intell. 23:1222–1239. 2001. View Article : Google Scholar
|
|
25
|
Boykov Y and Funka-Lea G: Graph cuts and
efficient N-D image segmentation. Int J Comput Vis. 70:109–131.
2006. View Article : Google Scholar
|
|
26
|
Grosgeorge D, Petitjean C, Dacher JN and
Ruan S: Graph cut segmentation with a statistical shape model in
cardiac MRI. Comput Vis Image Understand. 117:1027–1035. 2013.
View Article : Google Scholar
|
|
27
|
Martinez-Muñoz S, Ruiz-Fernandez D and
Galiana-Merino JJ: Automatic abdominal aortic aneurysm segmentation
in MR images. Expert Syst Applicat. 54:78–87. 2016. View Article : Google Scholar
|
|
28
|
Mahapatra D and Buhmann JM: Prostate MRI
segmentation using learned semantic knowledge and graph cuts. IEEE
Trans Biomed Eng. 61:756–764. 2014. View Article : Google Scholar : PubMed/NCBI
|
|
29
|
Tian Z, Liu L, Zhang Z and Fei B:
Superpixel-based segmentation for 3D prostate MR images. IEEE Trans
Med Imaging. 35:791–801. 2016. View Article : Google Scholar : PubMed/NCBI
|
|
30
|
Song Q, Bai J, Han D, Bhatia S, Sun W,
Rockey W, Bayouth JE, Buatti JM and Wu X: Optimal co-segmentation
of tumor in PET-CT images with context information. IEEE Trans Med
Imaging. 32:1685–1697. 2013. View Article : Google Scholar : PubMed/NCBI
|
|
31
|
Jia Y, Shelhamer E, Donahue J, Karayev S,
Long J, Girshick R, Guadarrama S and Darrell T: Caffe:
Convolutional architecture for fast feature embedding. Proceed of
the 22nd ACM Int Conferen Multimedia. ACM; pp. 675–678. 2014
|
|
32
|
Glorot X and Bengio Y: Understanding the
difficulty of training deep feedforward neural networks. in Proc
Int Conf Artif Intell Stat. 2010:249–256. 2010.
|
|
33
|
Sutskever I, Martens J, Dahl G and Hinton
G: On the importance of initialization and momentum in deep
learning. PMLR. 28:1139–1147. 2013.
|