Introduction
Angiotensin-converting-enzyme (ACE) inhibitor
(ACEI), angiotensin II receptor blocker (ARB) (1,2), and
angiotensin II (AngII) inhibitor Ang1-7 ameliorate tumor growth,
metastasis and angiogenesis. The low cost, safety, and abundant
clinical use of these substances have encouraged investigation of
the association between the rennin-angiotensin system (RAS) and
tumor metastasis (3).
In 1998, Lever et al (3) performed a retrospective analyzed 5,207
tumor cases and found that the long-term use of ACEI lowered the
risk of breast and lung tumors. In the last 10 years, there has
been continued investigation of the mechanisms of RAS in different
types of tumor, including those in breast and cervical cancer,
blastoma, hepatocellular carcinoma (HCC), and in the
gastrointestinal tract (3). Studies
have confirmed that AngII promotes tumor cell proliferation,
angiogenesis, apoptosis and metastasis, whereas Ang1-7 exerts the
opposite effects. Inhibition with ACEI and ARB can delay tumor
growth and prolong patient survival rate (4,5). The
antagonist Ang1-7 has entered its second clinical trial and may be
available for clinical use in the future (6). However, owing to the complexity of RAS
components, current knowledge of the mechanisms underlying their
effects on tumor metastasis is limited, and the results of clinical
trials remain controversial. It has been found that ARBs can
increase the risk of tumors (7).
Therefore, in-depth laboratory experiments in cell lines and
animals are required involving RAS components, particularly AngII,
which performs a key role in the system, to support its use in
clinical trials.
Epithelial-mesenchymal/mesenchymal-epithelial
transition (EMT/MET) is crucial in tumor metastasis and relapse, as
liver cancer cells migrate through this process. AngII is important
in the EMT of renal tract epithelial cells. However, few studies
have focused on the roles of AngII inhibitors, ACE2, or Ang1-7 in
EMT/MET. The present study focused on AngII-induced EMT/MET in
HepG2 cells.
Materials and methods
Materials
The present study was approved by the Institutional
Ethics Committee of the Beijing University Shenzhen Hospital
(Shenzhen, China; no. 2014024). All procedures performed in
investigations involving human participants were in accordance with
these ethical standards. Informed consent was obtained from all
individual participants included in the study. AngII, Angl-7 and
A779 were purchased from Sigma-Aldrich; EMD Millipore (Billerica,
MA, USA). Rabbit anti-human monoclonal GADPH antibody (cat. no.
NB300-221), E-cadherin (cat. no. NBP2-19051), and vimentin (cat.
no. NBP1-92687) antibodies were purchased from Novus Biologicals,
LLC, Littleton, CO, USA. The HepG2 cell line, obtained from the
Institute of Biochemistry and Cell Biology (Shanghai, China) was
used in the present study.
Immunohistochemical analysis
The human HCC tissue microarray used in the present
study comprised 51 primary HCC (age range, 45–67 years; 40 males
and 11 females) and six normal adjacent liver samples (3 cm away
from the cancer tissue used for specimens). The HCC samples were
collected from the patients between January 2012 to December 2013
in Beijing University Shenzhen Hospital during surgery. The
patients, were informed at the time of collection and their consent
was obtained with a signed informed consent form. Of the 51 HCC
samples, 32, 9, 5, and 5 samples were classified as stages I, II,
III, and IV, respectively. Following deparaffinization, the
sections were permeabilized with a 0.1% TritonX-100 solution in PBS
for 30 min. The sections were then blocked for 1 h at room
temperature with 2% goat serum (Shanghai Haoran Biotechnology Co.,
Ltd., Shanghai, China) and 1% BSA (Shanghai Haoran Biotechnology
Co., Ltd.) in PBS and then incubated with anti-E-cadherin antibody
(1:2,000, mouse anti-human, Novus Biologicals, LLC) and
anti-vimentin antibody (1:2,000, mouse anti-human, Novus
Biologicals, LLC) overnight at 4°C. The sections were rinsed in PBS
and then incubated with horseradish peroxidase conjugated
anti-rabbit secondary antibody (1:1,000; cat. no. 644001;
Neobioscience; Shenzhen Xinbosheng Biotechnology Co., Ltd.,
Shenzhen China) for 1 h at room temperature. The signals were
developed by avidin-biotin-peroxidase complexes with a DAB
substrate solution. The integrated optical density was calculated
to analyze the semi-quantitative expression of E-cadherin and
vimentin using Image-Pro plus 6.0 software (Media Cybernetics, Inc,
Rockville, MD, USA). Two stained sections were randomly selected
for each sample, with 10 different areas for each section.
Cell culture
The HepG2 cells were grown in Dulbecco's modified
Eagle's medium (DMEM; Sigma; EMD Millipore) containing 100 U/ml of
penicillin, 100 µg/ml of streptomycin and 15% FBS (Gibco; Thermo
Fisher Scientific, Inc., Waltham, MA, USA) at 37°C and 5%
CO2. The cells were synchronized in FBS-reduced medium
(0.5%) for 24 h prior to the experiments. Normal-glucose DMEM was
prepared with 5.5 mM of D-glucose, whereas high-glucose medium was
prepared by supplementing normal DMEM with D-glucose for a final
D-glucose concentration of 30 mM. Normal-glucose DMEM supplemented
with 24.5 of mM mannitol served as an osmotic control in the
experiment. Ang1-7, which is a key component of RAS, represents one
of the most significant conceptual changes of this important
hormonal system and antagonizes the action of Ang II, or Mas
receptor antagonist A-779 was applied 30 min prior to high-glucose
treatment.
Western blot analysis
The cells were lysed in a buffer containing 50 mM
Tris-Cl, 1% (w/v) SDS, sodium pyrophosphate, β-glycerophosphate,
sodium orthovanadate, sodium fluoride, EDTA and leupeptin (Beyotime
Institute of Biotechnology, Jiangsu, China). A protease inhibitor
cocktail (Roche Applied Science, Mannheim, Germany) was
supplemented prior to use. Equal quantities of protein (30 µg) were
run on a 10% SDS-polyacrylamide gel and then transferred onto
polyyinylidene difluoride membranes (Bio-Rad Laboratories, Inc.,
Hercules, CA, USA). The membranes were blocked in 5% skim milk in
Tris-buffered saline and 0.1% Tween 20 (TBST) for 1 h at room
temperature. The membranes were then incubated with primary
antibody (1:1,000 for mouse anti-vimentin, 1:1,000 for mouse
anti-E-cadherin, 1:2,000 for rabbit anti-human GADPH) at 4°C
overnight. Following three washes in TBST, the membranes were
incubated in horseradish peroxidase-conjugated secondary antibody
(1:1,000; cat. no. 19468, Rockland Immunochemicals Inc. Limerick,
PA, USA) for 2 h at room temperature. Hybridizing signals were
detected using an enhanced chemiluminescence detection kit (Pierce;
Thermo Fisher Scientific, Inc.) and then normalized to GADPH.
Signals were qualified using an image-analysis software program
(Smart View, Puri Technology, Shanghai, China).
Reverse transcription-quantitative
polymerase chain reaction (RT-qPCR) analysis
RT-qPCR analysis was performed using the Bio-Rad
iCycler iQ RT-q PCR detection system (Bio-Rad Laboratories, Inc.).
Total RNA from HepG2 cells was extracted using a TRIzol kit
(Invitrogen; Thermo Fisher Scientific, Inc.). Absorbance was tested
at 260 and 280 nm using a UV spectrophotometer to determine the
level of RNA purity. The PrimeScript RT reagent kit (Takara
Biotechnology Co. Ltd., Dalian, China) was used to perform reverse
transcription and 10 µl of the total system provided by the kit was
used for each reaction. SYBR Green Real-Time PCR Master mix was
used to quantify the relative abundance of the target mRNA. The
primers used for RT-qPCR are shown in Table I. The reaction conditions were as
follows: A single cycle at 95°C for 10 min, and 40 cycles at 95°C
for 15 sec and 60°C for 60 sec. The relative quantification of gene
expression was normalized against actin, and the 2−ΔΔCt
method was used to represent the data (8). Each sample was run and analyzed in
triplicate. The samples from the control group were used as
calibrators with a given value of 1, and the conditioned groups
were compared with the calibrator.
 | Table I.Sequences of primers for reverse
transcription-quantitative polymerase chain reaction analysis. |
Table I.
Sequences of primers for reverse
transcription-quantitative polymerase chain reaction analysis.
| Gene | Primer sequence |
|---|
| E-cadherin | Forward
5′-CAGCACGTACACAGCCCTAA-3′ |
|
| Reverse
5′-ACCCACCTCTAAGGCCATCT-3′ |
| Vimentin | Forward
5′-CGCACATTCGAGCAAAGACA-3′ |
|
| Reverse
5′-GAGGGCTCCTAGCGGTTTAG-3′ |
| β-actin | Forward
5′-GGAAGGTGGACAGCGAGGCC-3′ |
|
| Reverse
5′-GTGACGTGGACATCCGCAAAG-3′ |
Invasion assays
Invasion was measured using 24-well BioCoat cell
culture inserts with a polyethylene terephthalate membrane coated
with Matrigel basement membrane matrix (100 µg/cm2; BD
Biosciences, Franklin Lakes, NJ, USA). In brief, Matrigel was
allowed to rehydrate for 2 h at room temperature by adding warm,
serum-free DMEM. The wells of the lower chamber were filled with
medium containing 5% FBS. The cells (5×10⁴) were seeded
in the upper compartment (6.25-mm membrane size) in serum-free
medium. The invasion assay was performed at 37°C in a 5%
CO2 humidified incubator for 22 h. At the end of the
invasion assay, the filters were removed, fixed, and then stained
with the Diff-Quick staining kit. Cells on the upper surface of the
filters were removed by wiping with a cotton swab, and invasion was
determined by counting the number of cells that had migrated to the
lower side of the filter under a microscope at ×100 magnification.
For each sample, 10 fields were selected to count the number of
cells and calculate the average. The cells were treated with AngII
(1×10⁻⁷ mmol/l), AngII+Ang1-7 (1×10⁻⁵
mmol/l), AngII+Ang1-7+A779 (1×10⁻⁵ mmol/;), Ang1-7+A779,
or A779 at 37°C for 48 h in a 5% CO2 incubator prior to
plating on the invasion chamber. The cell density for this
experiment was required to reach a confluence of 80% prior to
treatment.
Statistical analysis
Data are presented as the mean ± standard error of
the mean and were analyzed for statistical significance using
one-way analysis of variance followed by Newman-Keuls test as a
post hoc test. All statistical analyses were performed in SPSS 17.0
(SPSS, Inc., Chicago, IL, USA) for Windows.
Results
Immunohistochemical assessment
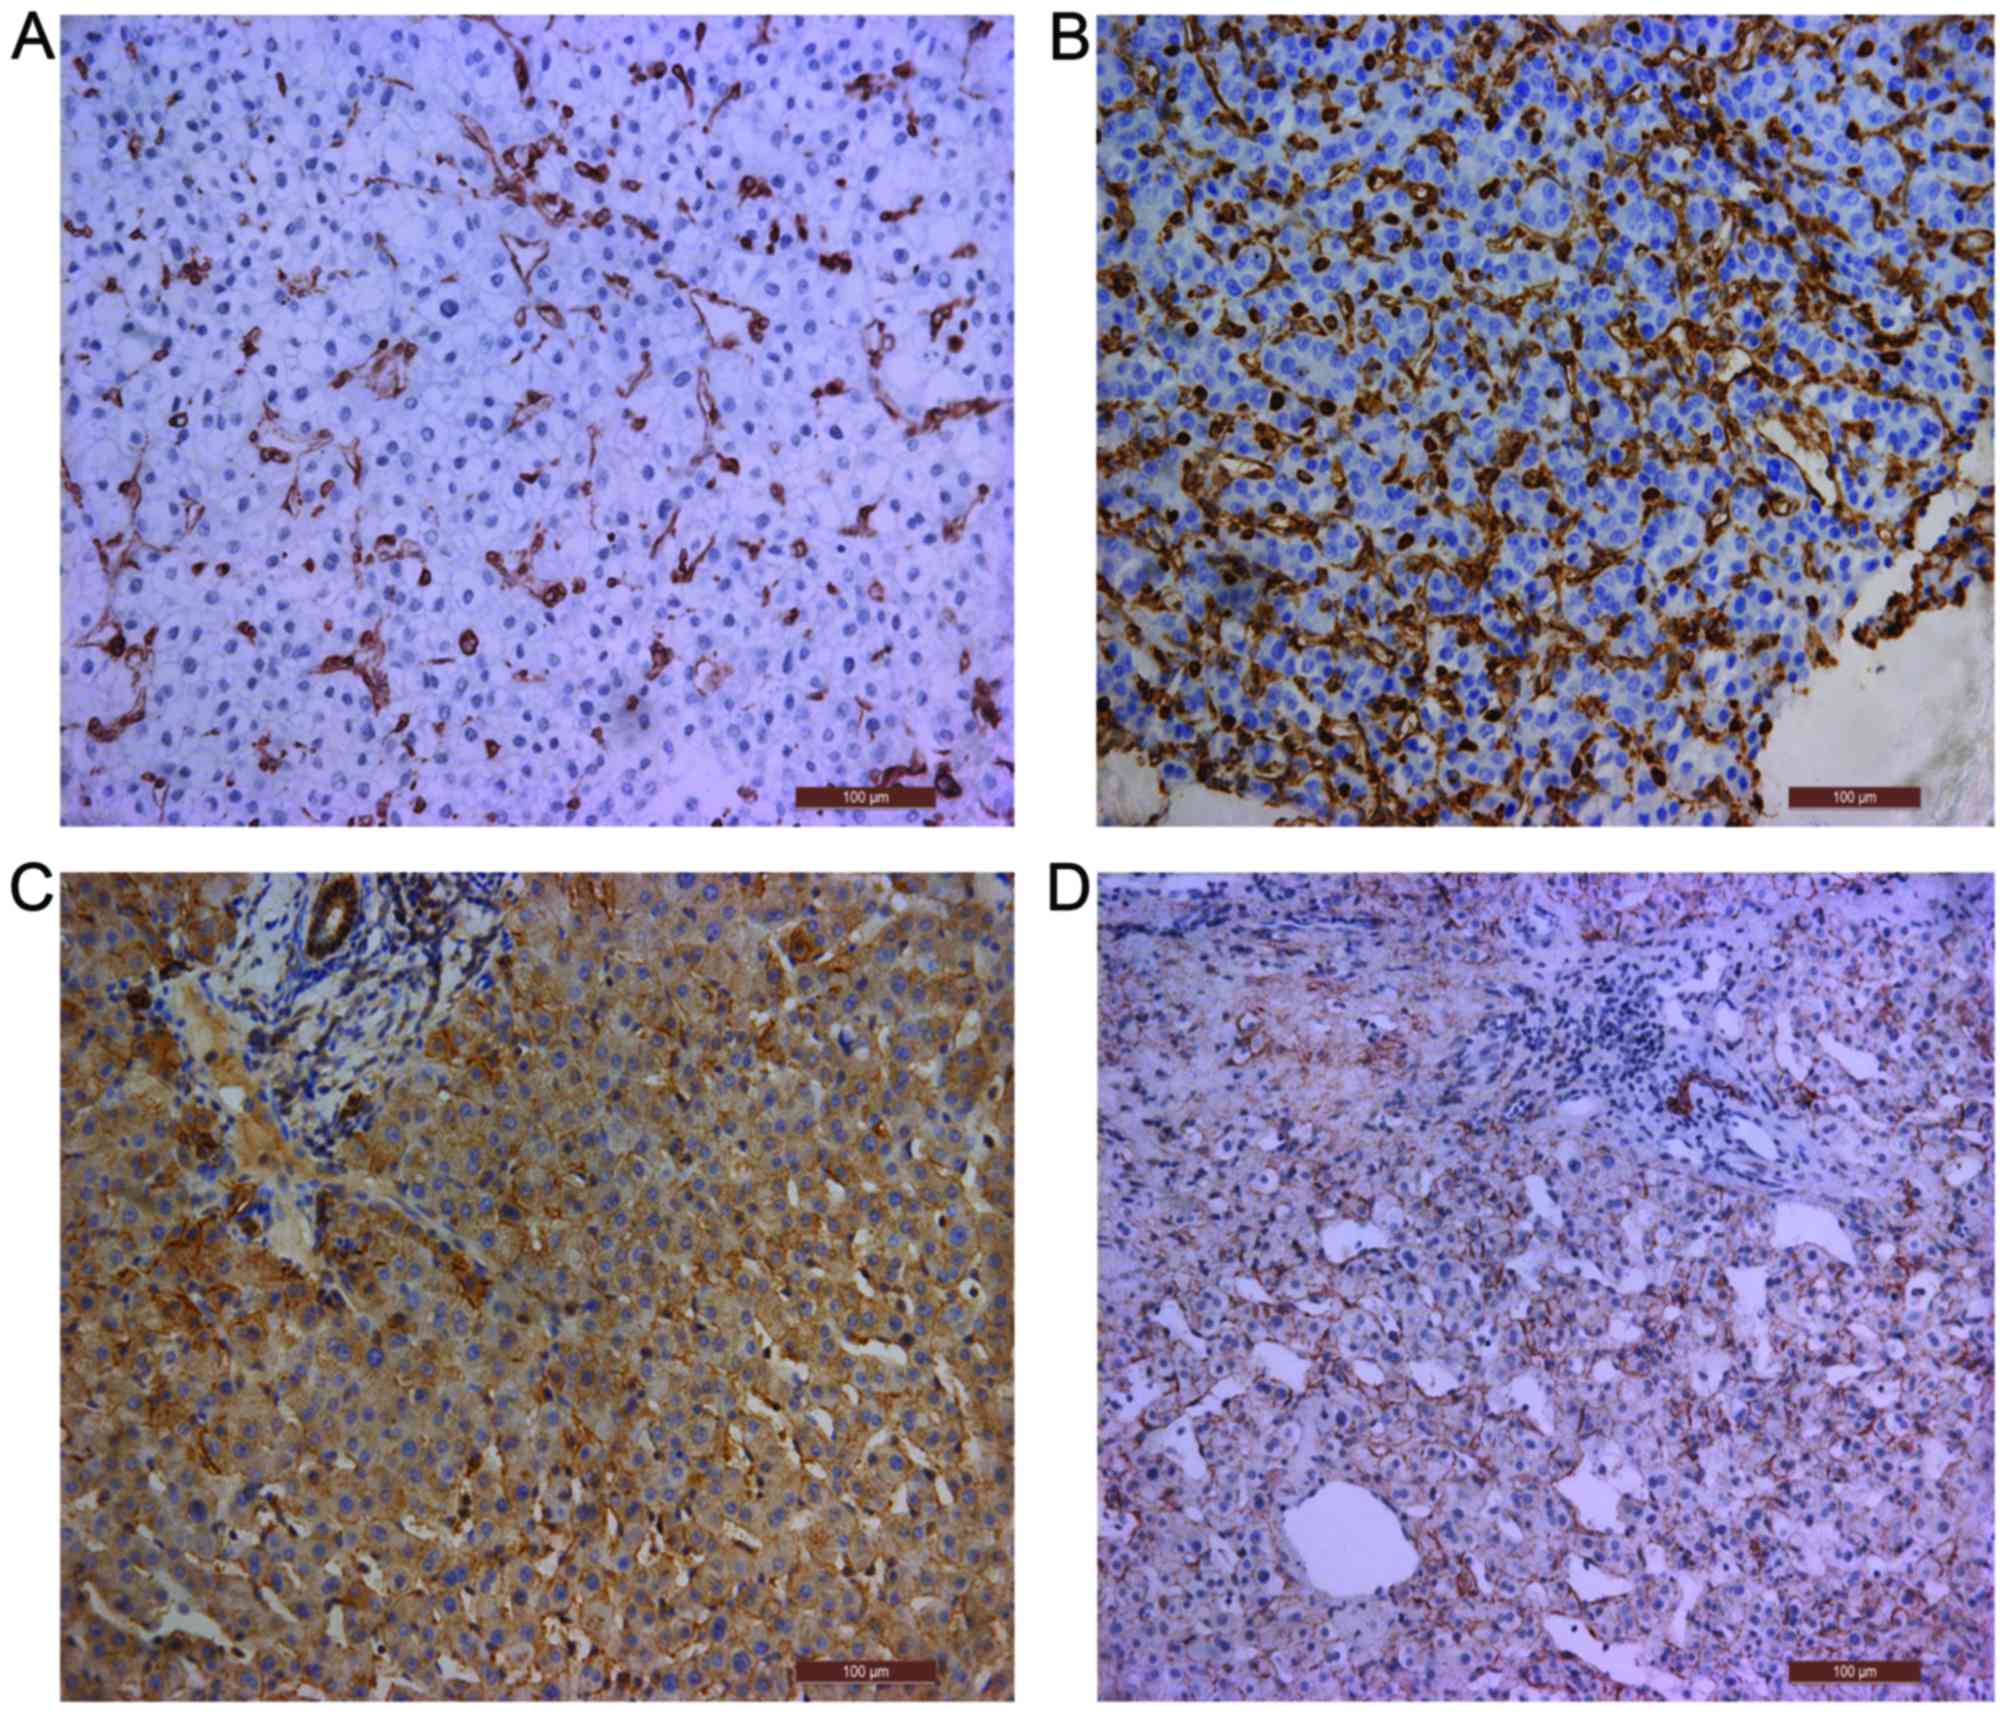
Compared with that in normal tissue, the expression
level of the EMT marker protein vimentin was significantly higher
in the tumor center cells than in parietal cells, whereas the
expression level of E-cadherin was significantly lower in the tumor
cells (P<0.001; Fig. 1A-D,
Table II).
| Table II.Protein expression of vimentin and
E-cadherin, determined by immunohistochemical analysis. |
Table II.
Protein expression of vimentin and
E-cadherin, determined by immunohistochemical analysis.
| Sample | Vimentin | E-cadherin |
|---|
| Liver | 0.0420±0.00040 | 0.0604±0.00024 |
| Tumor center | 0.0876±0.00063 | 0.0327±0.00064 |
| T-value | −173.643 | 53.337 |
| P-value | <0.001 | <0.001 |
Effect of AngII and the appropriate
stimulating time of AngII to induce EMT
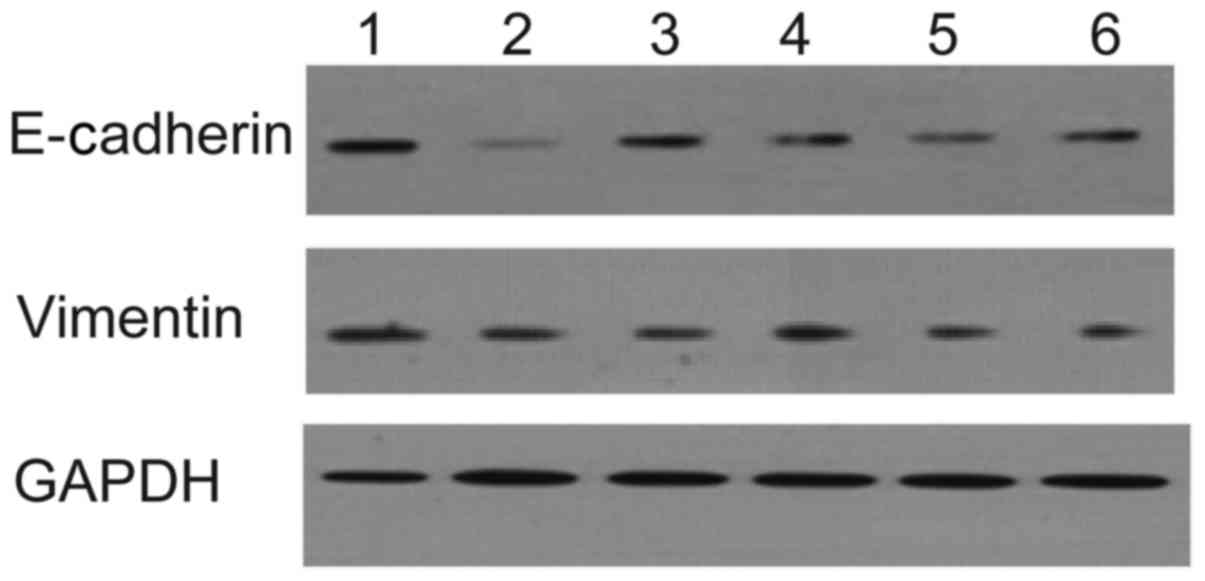
The results of the western blot analysis showed that
the level of E-cadherin in the cultured HepG2 cells differed
significantly from that in the control group (0 h) following
stimulation for 24, 48, 72, and 96 h (P<0.05). The level of
E-cadherin decreased whereas the level of vimentin increased in the
group stimulated with AngII, compared with that in the group
without drug administration, indicating that the cells cultured for
48 h following AngII stimulation underwent EMT. Therefore, the 48 h
time point was selected to examine EMT (Fig. 2A and B; Table III).
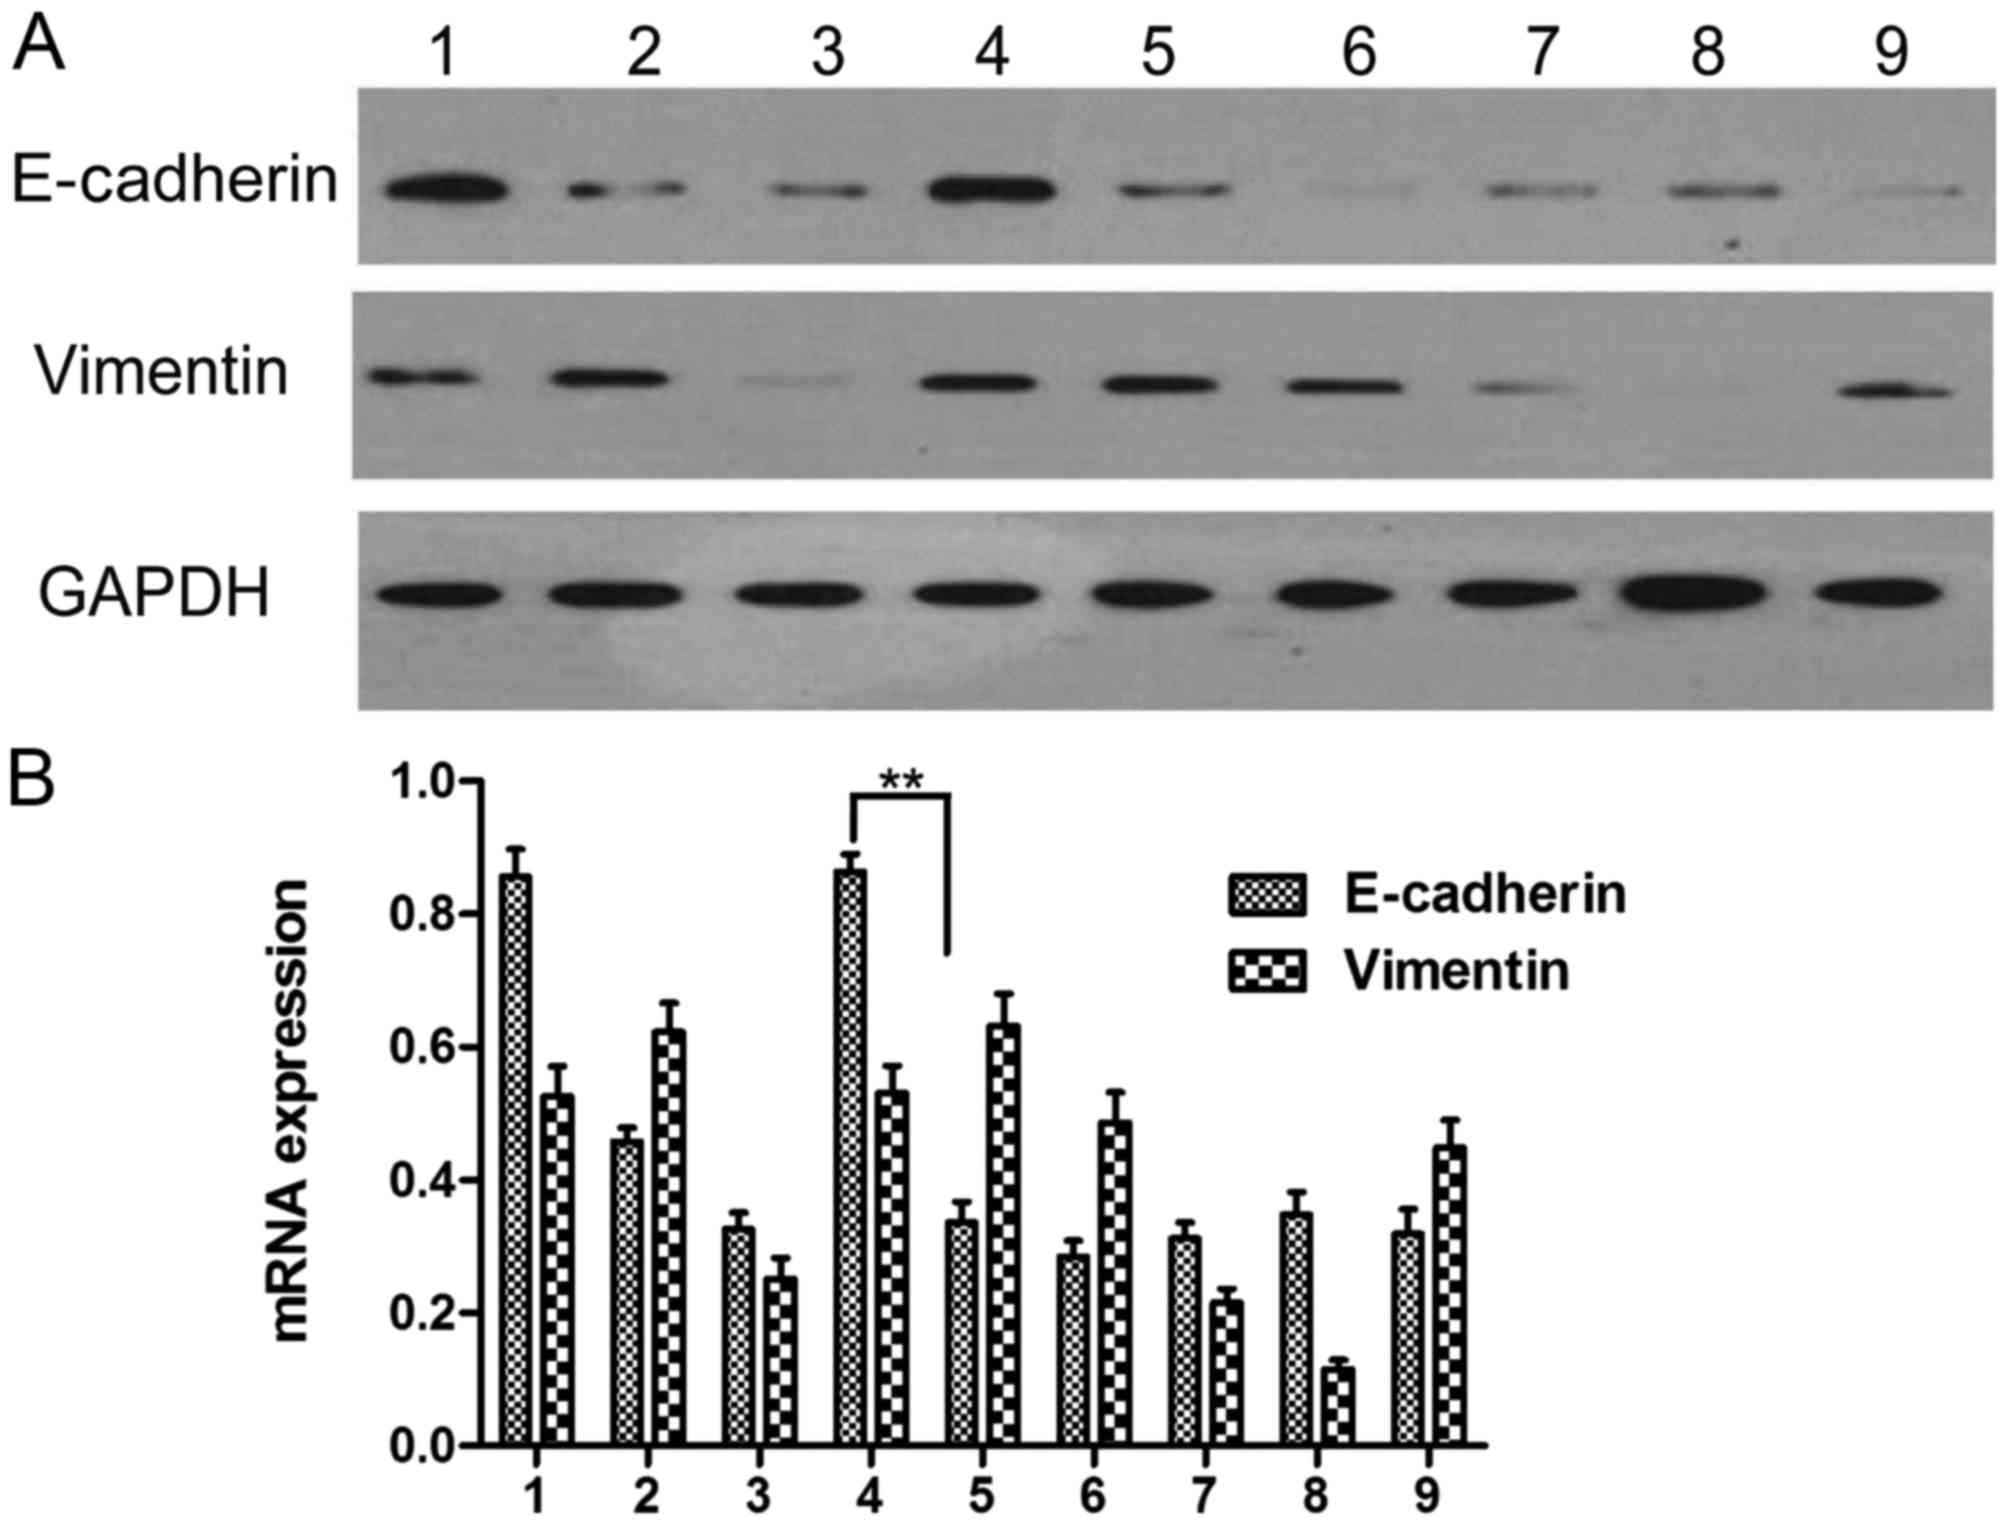 | Figure 2.Determination of the appropriate time
following AngII treatment. (A) Protein expression of E-cadherin and
vimentin; (B) mRNA expression of E-cadherin and vimentin. 1, no
drug at 0 h; 2, no drug for 24 h; 3, AngII stimulation for 24 h; 4,
no drug for 48 h; 5, AngII stimulation for 48 h; 6, no drug for 72
h; 7, AngII stimulation for 72 h; 8, no drug for 96 h; 9, AngII
stimulation for 96 h. **P<0.01. AngII, angiotensin II. |
| Table III.Protein expression of E-cadherin and
vimentin following AngII administration. |
Table III.
Protein expression of E-cadherin and
vimentin following AngII administration.
| Time (h) | E-cadherin
(AngII-) | E-cadherin
(AngII+) | Vimentin
(AngII-) | Vimentin
(AngII+) |
|---|
| 0 | 1.000±0.027 | 1.000±0.027 | 1.000±0.043 | 1.000±0.044 |
| 24 | 0.363±0.034 | 0.394±0.027 | 1.174±0.013 | 0.314±0.023 |
| 48 | 0.851±0.010 | 0.440±0.008 | 0.998±0.041 | 1.209±0.029 |
| 72 | 0.183±0.041 | 0.325±0.005 | 1.151±0.007 | 0.538±0.005 |
| 96 | 0.366±0.008 | 0.280±0.006 | 0.218±0.020 | 0.919±0.006 |
Effects of Ang1-7 treatment on HepG2
EMT following AngII stimulation
Compared with the control group, the
AngII-stimulated cells exhibited decreased E-cadherin and increased
vimentin (P<0.05). Following AngII+Angl-7 treatment, the
expression levels of E-cadherin and vimentin did not differ
significantly compared with those in the control group. This result
indicated that the inhibitory effect of Ang1-7 on AngII stimulation
was partly inhibited by A779. The A779, Angl-7, and Angl-7+A779
groups did not differ significantly to control group (Fig. 3; Table
IV).
| Table IV.Effect of Ang1-7 on the expression
levels of E-cadherin and vimentin in HEPG2 cells. |
Table IV.
Effect of Ang1-7 on the expression
levels of E-cadherin and vimentin in HEPG2 cells.
| Group | E-cadherin | Vimentin |
|---|
| Control | 1.000±0.135 | 1.000±0.101 |
| AngII | 0.631±0.023 | 1.101±0.033 |
| AngII+Ang1-7 | 0.663±0.019 | 1.242±0.092 |
|
AngII+Ang1-7+A779 | 0.890±0.051 | 1.295±0.122 |
| Ang1-7 | 0.896±0.043 | 1.007±0.103 |
| Ang1-7+A779 | 0.901±0.046 | 0.887±0.095 |
Effect of AngII stimulation on the
gene expression of E-cadherin and vimentin in HepG2 cells
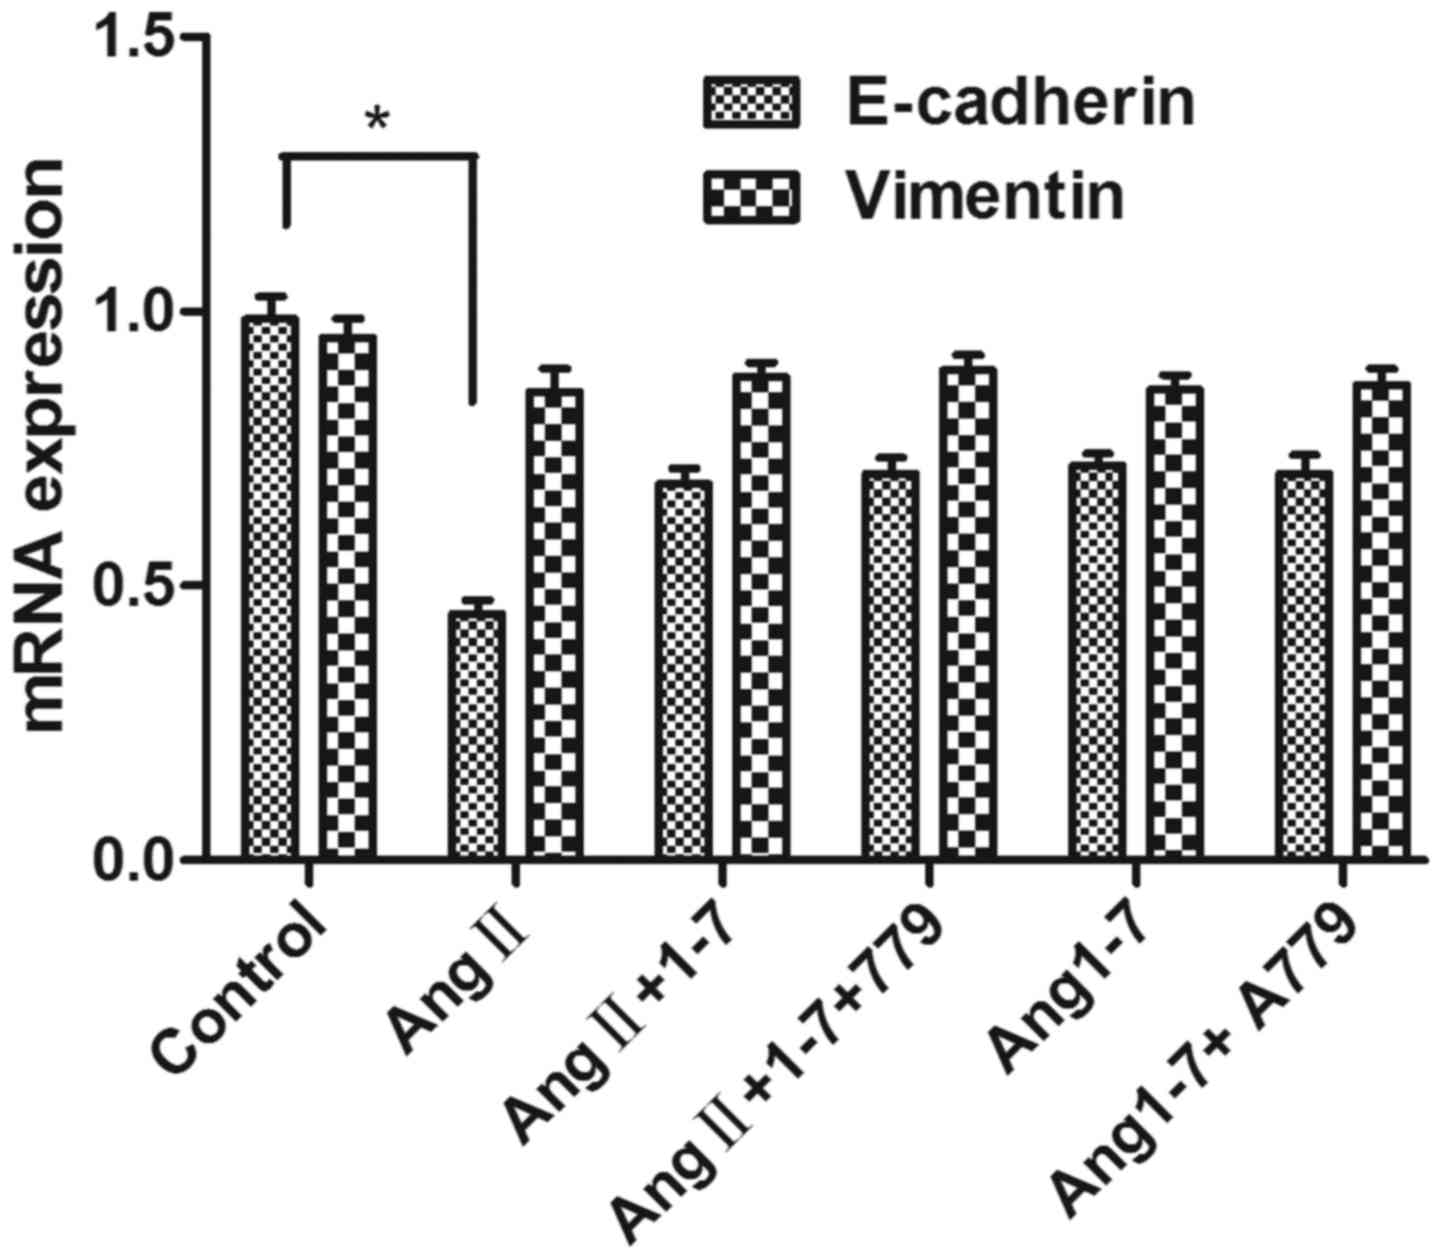
The relative RNA expression levels of E-cadherin and
vimentin, which are the main genes expressed in HCC EMT, were
measured using RT-qPCR analysis. The results revealed that
E-cadherin was decreased in the AngII stimulation group, compared
with that in the control group (P<0.05). No significant
difference was observed between the AngII+Angl-7 group and the
control group, which was consistent with the results of the western
blot analysis (Fig. 4).
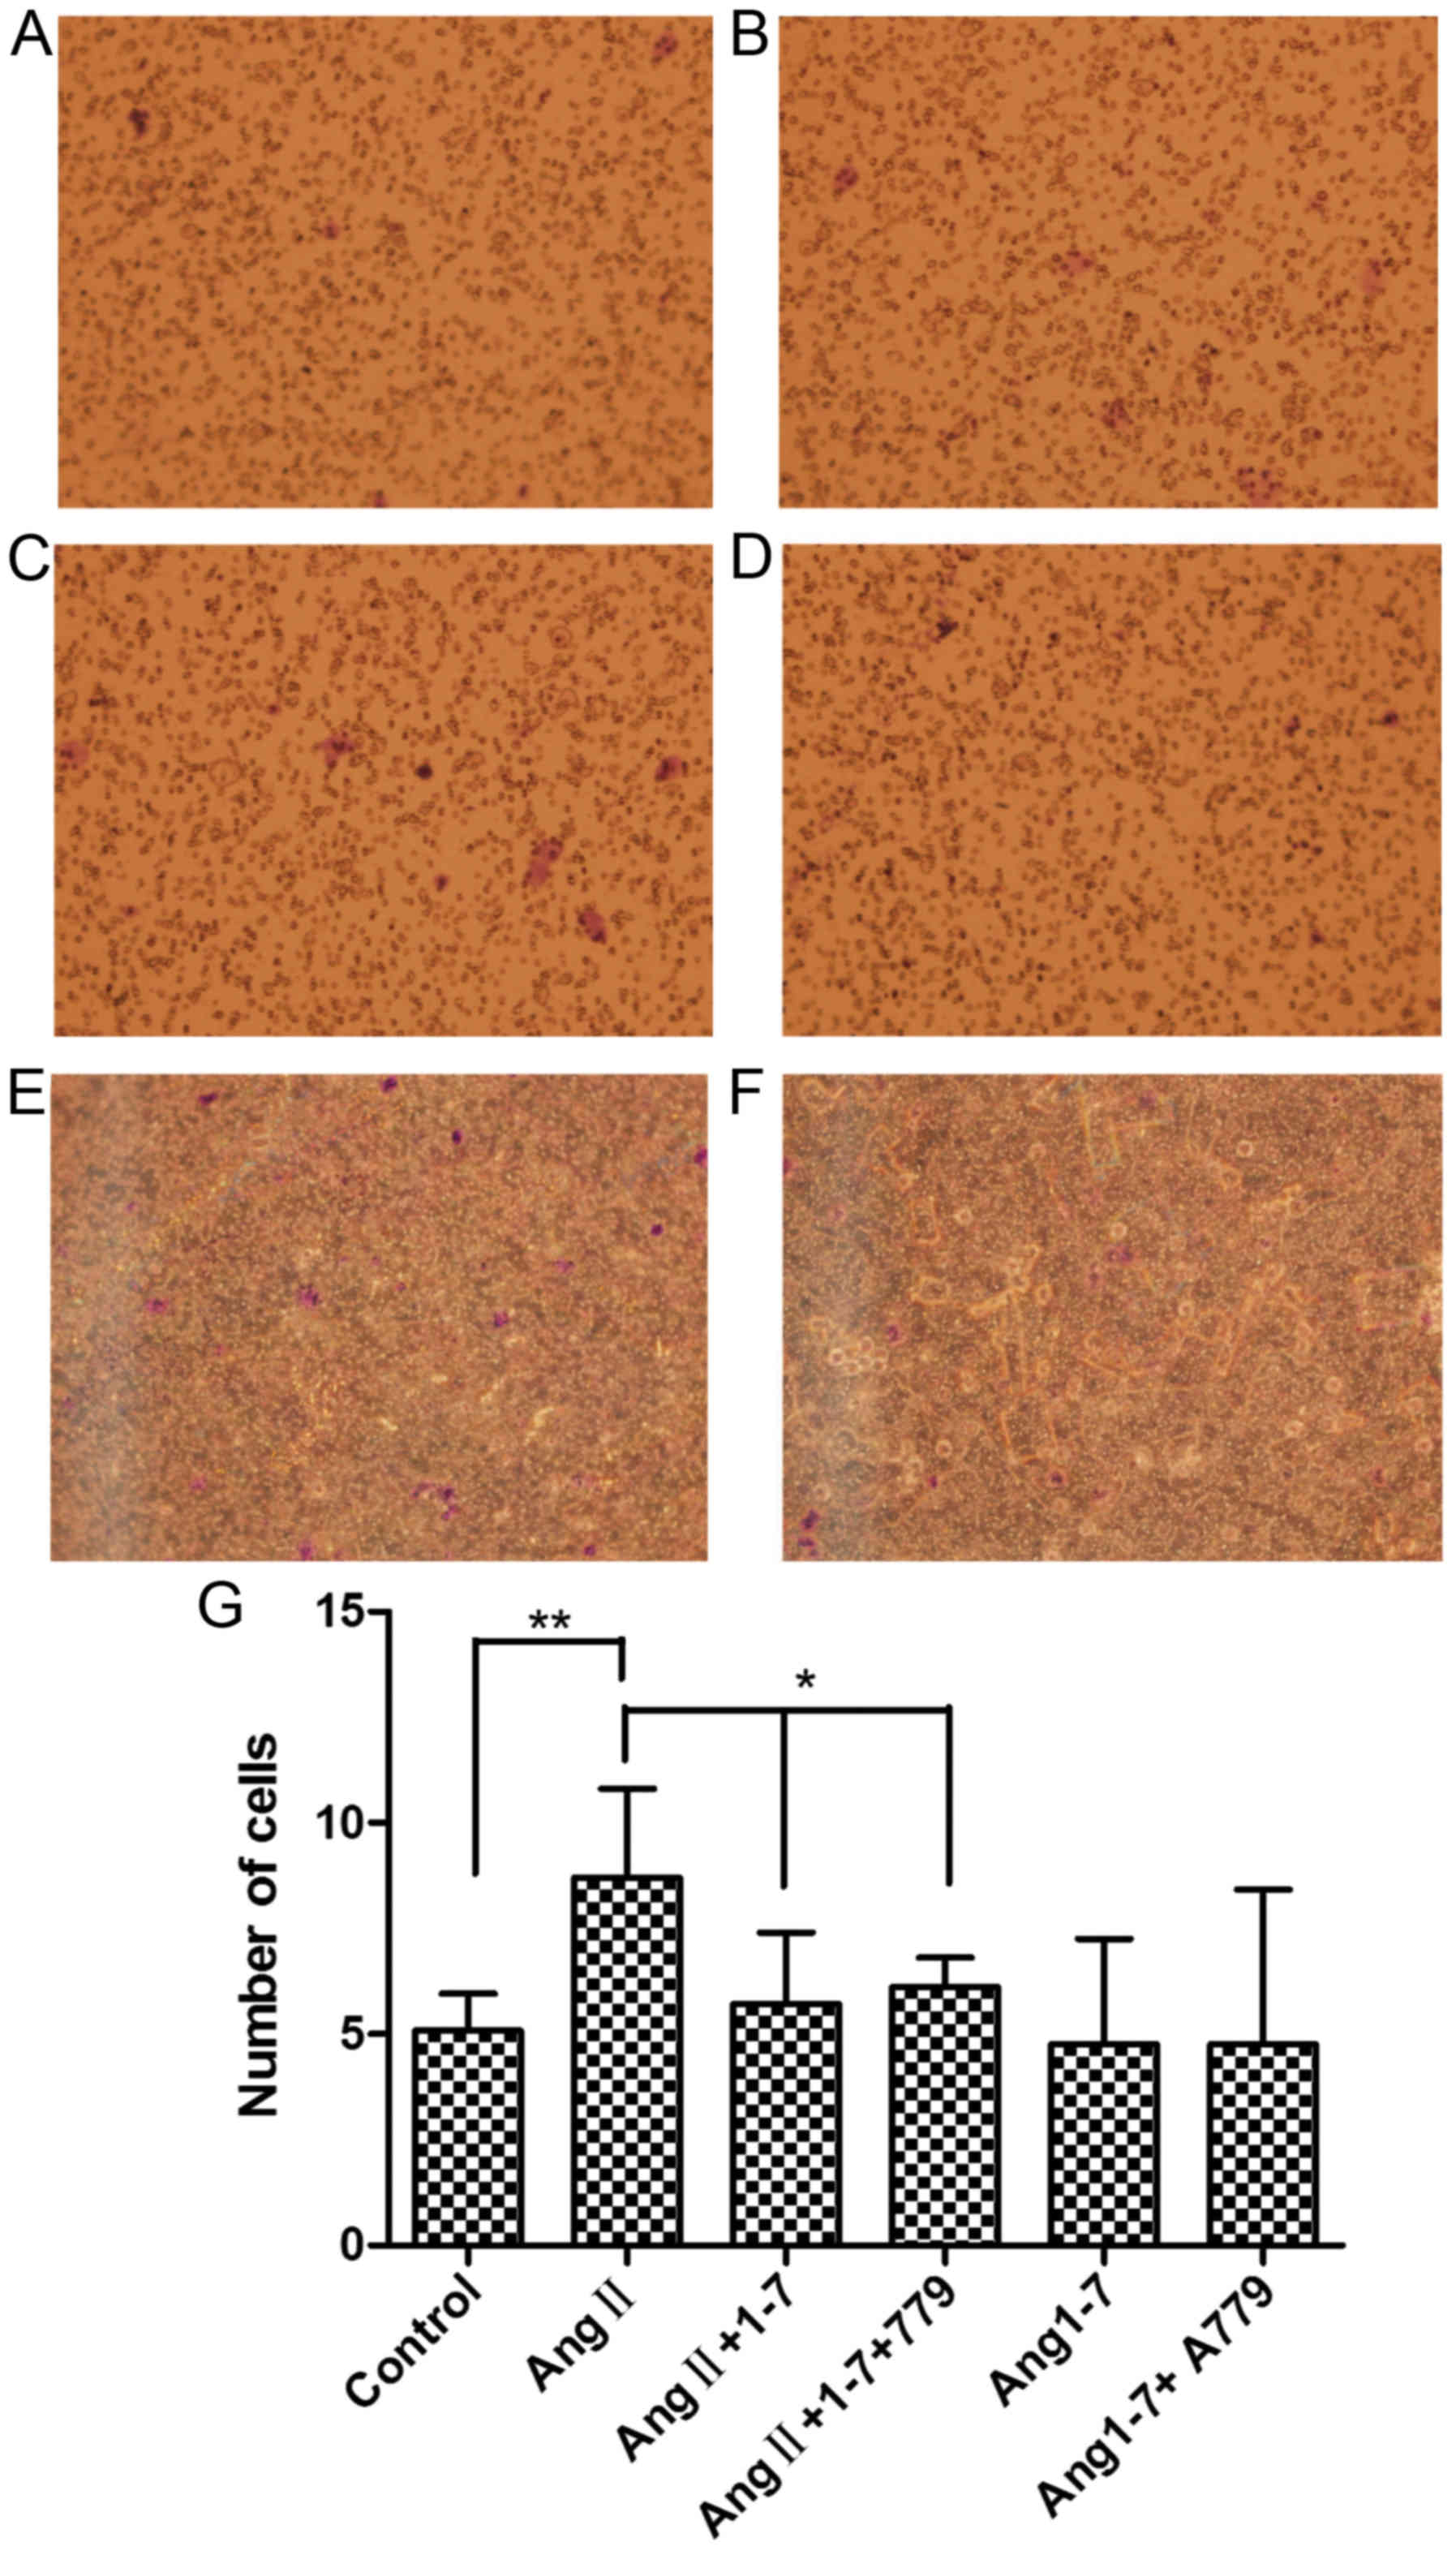
Migration assay
The number of HepG2 cells that transferred through
the wells (8.71±2.09) in the AngII stimulation group exceeded that
of the control group (5.08±0.88). The number in the
AngII+Ang1-7+A779 group (7.00±0.69) was significantly higher than
that in the AngII+Ang1-7 group (6.72±1.69) but was significantly
lower than that in the AngII group (Fig.
5A-G).
Discussion
Ang in the liver is converted into AngI, which is
converted into Ang1-7 under the effect of ACE2. AngII acts through
AT1, forming the ACE-Ang-AT1 axis; Ang1-7 acts through MAS, forming
the ACE2-Ang1-7-MAS axis. The two axes act with each other,
modulating human physical functions (9,10).
It has been suggested that the main function of RAS
is to modulate blood pressure and water-salt balance. Previous
clinical studies and animal experiments have revealed that RAS is
expressed abnormally in tumors and is associated with disease
prognosis (11). RAS antagonists can
prohibit tumor growth, metastasis and blood vessel formation.
Retrospective clinical studies have shown that that the long-term
administration of ACEI can prevent tumor occurrence, and this
medication does not affect blood pressure (4,5). Earlier
studies examined clinical samples, comparing the center of the
tumor tissue with its adjacent tissue to identify differences in
RAS expression. Their results showed that the expression levels of
ACE1, ACE2, and AT1 in the tumor centers increased or decreased
consistently, compared with those in adjacent tissues (7,10). These
findings showed that the ACE1-AngII-AT1 and ACE2-Ang1-7-MAS axes
acted with each other in patients with HCC. When ACE1 was
increased, ACE2 increased in compensation and vice versa, reaching
a certain balance. When ACE1 was increased, AT1 increased
simultaneously and vice versa, indicating that ACE1 acted with AT1
(12,13).
The reason for AngII and its receptor induce the
formation of blood vessels and tumor metastasis, and why ACEI and
ARB can inhibit tumor occurrence, proliferation, blood formation
and metastasis remain to be fully elucidated (14). Studies have shown that ACEI or ARB
drugs can inhibit the matrix metalloproteinase (MMP) family,
particularly MMP2 and MMP9, whose main functions are to degrade
base membrane construction-collagen type IV (15). ACEI and ARB can also inhibit vascular
endothelial growth factor, and the latter can inhibit tumor
occurrence and proliferation, which can be considered as mechanisms
of tumor inhibition (16).
Experiments using rats with AT1R-knockout found that AngII promotes
blood vessel proliferation mainly on mesenchymal cells and not in
the tumors themselves. Previous studies found that the more
malignant epithelial originated cells exhibit more irregular
expression of AngII and AT1R, and lower levels were correlated with
the morphological changes of tumor cells (11,17).
AngII induces transforming growth factor-β (TGFβ), a potent driver
of cancer progression through the induction of EMT, in which
epithelial cells acquire a mesenchymal phenotype, leading to
enhanced motility and invasion. This process involves the
activation of extracellular signal-regulated kinase, small mothers
against decapentaplegic (Smad)2, and subsequently the TGFβ
signaling pathway, promoting EMT and migration and invasion of
human HCC cells (11). These
findings may be explained using EMT theory.
Under specific circumstances, mature cells can
exhibit plasticity, transferring from one phenotype to another. By
interacting with the surrounding mesenchyme, these epithelial cells
may lose certain epithelial characteristics, including inter-cell
conjunction and polarity, and acquire several mesenchymal
characteristics, including invasion and migration. This phenomenon
is termed EMT (18,19). For convenience in investigating EMT,
the 2007 International EMT Meeting (3) divided EMTs into three types according
to the different surroundings in which EMT occurs: Type I EMT
occurs during fertilized ovum implantation, fetus development and
organ formation; type II EMT occurs during trauma healing, tissue
reconstruction and fibrosis; and type III EMT transpires during
tumor invasion and metastasis. Primary tumor site epithelial cells
transform into mesenchymal cells through EMT, invading the basement
membrane and transferring via blood vessels to form distant
secondary tumor sites through MET (20). Microcircumstances have been
considered important in tumor metastasis in previous years, and
local RAS, which is expressed in the matrix, may be involved
(21).
The present study confirmed that AngII induced EMT,
with an appropriate time point of 48 h. The promotion effect
appeared to be inhibited partly by Ang1-7, whereas the Ang1-7
inhibitor A779 partly ameliorated the inhibition. In order to
obtain more stable experimental results, more detailed experimental
protocols are to be designed in subsequent investigations,
including the use of reagent concentrations and incubation time.
These findings indicated that RAS components coordinated with each
other to modulate tumor metastasis. A previous study (22) demonstrated that the ACE1-AngII-AT1
and ACE2-Ang1-7-MAS axes interacted with each other to modulate
HCC.
Other associated studies have found that RAS can
modulate tumor growth and metastasis through the TGF-β and Smad
signaling pathways. Further investigations of the signaling
pathways and in vivo experiments are required.
Acknowledgements
Not applicable.
Funding
The present study was supported by the Guangdong
Science and Technology Project (grant. no. 20160247).
Availability of data and materials
The datasets used and/or analyzed during the present
study are available from the corresponding author on reasonable
request.
Authors' contributions
MQ and YZ completed the experimental design,
performed and data analysis and wrote the paper. JL, XO and ML
performed the experiments and contributed to the data analysis. XL,
JY and GY collected the specimens. All authors read and approved
the final manuscript.
Ethics approval and consent to
participate
The present study was approved by the Institutional
Ethics Committee of the Beijing University Shenzhen Hospital (no.
2014024). All procedures performed in investigations involving
human participants were in accordance with these ethical standards.
Informed consent was obtained from all individual participants
included in the study.
Patient consent for publication
Not applicable.
Competing interests
The authors declare that they have no competing
interests.
References
|
1
|
El-Serag HB and Rudolph L: Hepatocellular
carcinoma: Epidemiology and molecular carcinogenesis.
Gastroenterology. 132:2557–2576. 2007. View Article : Google Scholar : PubMed/NCBI
|
|
2
|
Eguchi S, Kanematsu T, Arii S, Omata M,
Kudo M, Sakamoto M, Takayasu K, Makuuchi M, Matsuyama Y, Monden M,
et al: Recurrence-free survival more than 10 years after liver
resection for hepatocellular carcinoma. Brit J Surg. 98:552–557.
2011. View
Article : Google Scholar : PubMed/NCBI
|
|
3
|
Lever AF, Hole DJ, Gillis CR, McCallum IR,
McInnes GT, MacKinnon PL, Meredith PA, Murray LS, Reid JL and
Robertson JW: Do inhibitors of angiotensin-I-converting enzyme
protect against risk of cancer? Lancet. 352:179–184. 1998.
View Article : Google Scholar : PubMed/NCBI
|
|
4
|
Vinson GP, Barker S and Puddefoot JR: The
renin-angiotensin system in the breast and breast cancer. Endocr
Relat Cancer. 19:R1–R19. 2012. View Article : Google Scholar : PubMed/NCBI
|
|
5
|
Wilop S, von Hobe S, Crysandt M, Esser A,
Osieka R and Jost E: Impact of angiotensin I converting enzyme
inhibitors and angiotensin II type 1 receptor blockers on survival
in patients with advanced non-small-cell lung cancer undergoing
first-line platinum-based chemotherapy. J Cancer Res Clin.
135:1429–1435. 2009. View Article : Google Scholar
|
|
6
|
Petty WJ, Miller AA, McCoy TP, Gallagher
PE, Tallant EA and Torti FM: Phase I and pharmacokinetic study of
angiotensin-(1–7), an endogenous antiangiogenic hormone. Clin
Cancer Res. 15:7398–7404. 2009. View Article : Google Scholar : PubMed/NCBI
|
|
7
|
Hallas J, Christensen R, Andersen M, Friis
S and Bjerrum L: Long term use of drugs affecting the
renin-angiotensin system and the risk of cancer: A population-based
case-control study. Brit J Clin Pharmaco. 74:180–188. 2012.
View Article : Google Scholar
|
|
8
|
Livak KJ and Schmittgen TD: Analysis of
relative gene expression data using real-time quantitative PCR and
the 2(-Delta Delta C(T)) method. Methods. 25:402–408. 2001.
View Article : Google Scholar : PubMed/NCBI
|
|
9
|
Liu Y, Li B, Wang X, Li G, Shang R, Yang
J, Wang J, Zhang M, Chen Y, Zhang Y, et al: Angiotensin-(1–7)
suppresses hepatocellular carcinoma growth and angiogenesis via
complex interactions of angiotensin II type 1 receptor, angiotensin
II type 2 receptor and mas receptor. Mol Med. 21:626–636. 2015.
View Article : Google Scholar : PubMed/NCBI
|
|
10
|
Zhou L, Xue H, Wang Z, Ni J, Yao T, Huang
Y, Yu C and Lu LM: Angiotensin-(1–7) attenuates high
glucose-induced proximal tubular epithelial-to-mesenchymal
transition via inhibiting ERK1/2 and p38 phosphorylation. Life Sci.
90:454–462. 2012. View Article : Google Scholar : PubMed/NCBI
|
|
11
|
Santhekadur PK, Akiel M, Emdad L, Gredler
R, Srivastava J, Rajasekaran D, Robertson CL, Mukhopadhyay ND,
Fisher PB and Sarkar D: Staphylococcal nuclease domain containing-1
(SND1) promotes migration and invasion via angiotensin II type 1
receptor (AT1R) and TGF-β signaling. FEBS Open Bio. 4:353–361.
2014. View Article : Google Scholar : PubMed/NCBI
|
|
12
|
Passos-Silva DG, Verano-Braga T and Santos
RA: Angiotensin-(1–7): Beyond the cardio-renal actions. Clin Sci
(Lond). 124:443–456. 2013. View Article : Google Scholar : PubMed/NCBI
|
|
13
|
Menon J, Soto-Pantoja DR, Callahan MF,
Cline JM, Ferrario CM, Tallant EA and Gallagher PE:
Angiotensin-(1–7) inhibits growth of human lung adenocarcinoma
xenografts in nude mice through a reduction in cyclooxygenase-2.
Cancer Res. 67:2809–2815. 2007. View Article : Google Scholar : PubMed/NCBI
|
|
14
|
Assimes TL, Elstein E, Langleben A and
Suissa S: Long-term use of antihypertensive drugs and risk of
cancer. Pharmacoepidemiol Drug Saf. 17:1039–1049. 2008. View Article : Google Scholar : PubMed/NCBI
|
|
15
|
Kinoshita J, Fushida S, Harada S, Yagi Y,
Fujita H, Kinami S, Ninomiya I, Fujimura T, Kayahara M, Yashiro M,
et al: Local angiotensin II-generation in human gastric cancer:
Correlation with tumor progression through the activation of
ERK1/2, NF-kappa B and survivin. Int J Oncol. 34:1573–1582. 2009.
View Article : Google Scholar : PubMed/NCBI
|
|
16
|
Attoub S, Gaben AM, Al-Salam S, Al Sultan
MA, John A, Nicholls MG, Mester J and Petroianu G: Captopril as a
potential inhibitor of lung tumor growth and metastasis. Ann N Y
Acad Sci. 1138:65–72. 2008. View Article : Google Scholar : PubMed/NCBI
|
|
17
|
Wani S and Sharma P: The role of
chemoprevention in Barrett esophagus and esophageal adenocarcinoma.
J Clin Gastroenterol. 41 Suppl:S135–S140. 2007. View Article : Google Scholar
|
|
18
|
Arrieta O, Villarreal-Garza C, Vizcaino G,
Pineda B, Hernandez-Pedro N, Guevara-Salazar P, Wegman-Ostrosky T,
Villanueva-Rodriguez G and Gamboa-Dominguez A: Association between
AT1 and AT2 angiotensin II receptor expression with cell
proliferation and angiogenesis in operable breast cancer. Tumor
Biol. 36:5627–5634. 2015. View Article : Google Scholar
|
|
19
|
George AJ, Thomas WG and Hannan RD: The
renin-angiotensin system and cancer: Old dog, new tricks. Nat Rev
Cancer. 10:745–759. 2010. View
Article : Google Scholar : PubMed/NCBI
|
|
20
|
Kalluri R and Weinberg RA: The basics of
epithelial-mesenchymal transition. J Clin Invest. 119:1420–1428.
2009. View
Article : Google Scholar : PubMed/NCBI
|
|
21
|
Zong H, Yin B, Zhou H, Cai D, Ma B and
Xiang Y: Loss of angiotensin-converting enzyme 2 promotes growth of
gallbladder cancer. Tumor Biol. 36:5171–5177. 2015. View Article : Google Scholar
|
|
22
|
Qi MH, Ye J and Qi ZY: Angiotensin II
induces hepatocellular carcinoma cell line SMMC-7721 to produce
epithelial mesenchymal transition. Guangdong Med J. 36:1–3.
2015.(In Chinese).
|