Introduction
Diabetic retinopathy (DR) is a common blinding
complication in patients with type 1 and type 2 diabetes mellitus
(1,2). Proliferative DR (PDR) is a more serious
stage of DR, which is characterized by neovascularization on the
surface of the retina or the optic disc (3). The newly-formed vessels are prone to
hemorrhaging, which threatens the vision of the sufferer and
eventually culminates in blindness. PDR is associated with
environmental and genetic factors. The length of time patients have
suffered with diabetes, glycemic control, hypertension, and other
environmental factors are well-established risk factors of PDR
(4). Genetic variations may explain
some of the heterogeneity in the development of PDR. Several
candidate genes have been implicated in the pathogenesis of PDR in
patients with type 2 diabetes (5).
For example, vascular endothelial growth factor (VEGF) was found to
be overexpressed in fibrovascular membranes (FVMs) in patients with
PDR, suggesting that it may contribute to the development of PDR
(6). Gene polymorphisms of other
growth factors, including basic fibroblast growth factor and
insulin-like growth factor have also been shown to be important in
the pathogenesis of PDR (7,8). The association between
single-nucleotide polymorphisms of oxidative stress genes and PDR
in type 2 diabetes has been reported in a number of previous
studies, including manganese superoxide dismutase, catalase
myeloperoxidase, glutathione S-transferase, NADPH oxidase,
endothelial nitric oxide synthase and inducible nitric oxide
synthase (9–11).
However, the exact pathogenesis of PDR remains to be
elucidated. At present, an increasing number of gene expression
profiling studies have been performed to reveal the genetic
mechanisms of PDR (3,12,13). The
transcriptomics datasets using the platforms of microarrays or
RNA-sequencing are available in public databases, including the
functional genomics data repository of Gene Expression Omnibus
(GEO) and Sequence Read Archive (14). In the present study, microarray
datasets of gene expression in FVMs excised from patients with
proliferative diabetic retinopathy were utilized to comprehensively
analyze the molecular expression patterns of PDR.
Materials and methods
Microarray data collection and
preprocessing
In order to investigate the regulatory mechanisms of
PDR at the transcriptomic level, gene expression profiling datasets
were retrieved from the GEO. Finally, the raw data of GSE60436
contributed by Ishikawa et al, which is the gene expression
profile of FVMs associated with PDR, was selected and downloaded
(3). In this array, there were a
total of nine RNA samples. Of these, three control RNA samples were
from the human retina obtained from Clontech Laboratories, Inc.
(Mountainview, CA, USA), and six RNA samples were obtained from the
retinal surface with horizontal scissors of patients with PDR
undergoing pars plana vitrectomy, and were classified into active
and inactive samples according to the clinical findings of
neovascularization (NV) in the FVMs, with three samples per group.
The active FVMs represent samples with the presence of NV in the
membranes, and the inactive FVMs represent samples with an absence
of NV in the membranes. The Illumina HumanWG-6 v3.0 Expression
BeadChip (GPL6884; Illumina, Inc., San Diego, CA, USA) platform was
used to screen PDR-associated genes. The data preprocessing was
performed by R v3.2.2 (https://www.r-project.org/). The Robust Multichip
Average algorithm in the oligo package was used to normalize the
raw expression data and generate normalized gene expression
intensity (15).
Differentially expressed gene (DEG)
analysis
The analysis of DEGs was performed using R v3.2.2
and Bioconductor libraries (http://www.bioconductor.org/). The empirical Bayes
algorithm (function ‘eBayes’) within the Limma package was used to
detect DEGs between the case samples, including the active or
inactive samples and the controls. Upregulated genes were
considered as a logarithmic transformed fold-change log2(FC) ≥1 and
a false discovery rate (FDR) adjusted P-value ≤0.05. Downregulated
genes were considered as log2(FC) ≤-1 and an FDR P-value ≤0.05.
Differential expression analysis in the two comparisons for the
active and inactive FVMs were performed.
Kyoto encyclopedia of genes and
genomes (KEGG) pathway enrichment analysis
The Database for Annotation, Visualization, and
Integrated Discovery Bioinformatics Resource 6.7 (https://david.ncifcrf.gov/) was used to perform KEGG
pathway enrichment analysis (16).
The inputs were utilized from the list of DEGs. An enriched pathway
where P<0.05 was considered to indicate a statistically
significant difference. InteractiVenn (http://www.interactivenn.net/) was utilized to draw a
Venn diagram in order to illustrate the overlapping genes or
pathways between active and inactive regulation.
Targeted genes by transcription factor
(TF) analysis
The union set of the differentially expressed target
genes in total and the subgroups was obtained and IneractiVenn
software was used to illustrate the results. TF analysis was
performed by integrating the database of TRANSFAC® 7.0
(http://genexplain.com/transfac/), which
provides data on eukaryotic TFs, their experimentally-proven
binding sites, consensus binding sequences (positional weight
matrices), and regulated genes (17,18).
Results and Discussion
DEGs associated with PDR
Based on the analysis of DEGs compared with the
control samples, the significant genes associated with active FVMs
and inactive FVMs were identified (Fig.
1). There were a total of 2,480 significantly dysregulated
genes, including 690 upregulated and 1,790 downregulated genes,
identified in the active FVMs. Furthermore, for the inactive FVMs a
total of 2,369 genes were identified as significantly dysregulated,
including 503 upregulated and 1,866 downregulated genes (Fig. 1A-C). According to the comparison of
significant genes in each group, a total of 1,838 overlapping genes
were identified as significant in active and inactive FVMs,
comprising 642 specific genes for active FVMs and 531 specific
genes for inactive FVMs. Among the overlapping genes, there were a
total of 1,505 commonly downregulated genes and 332 commonly
upregulated genes (Fig. 1D). Only
one gene, flavin-containing monooxygenase isoform 2 (FMO2), was
significantly downregulated (logFC=−1.44, P=0.00743) in the active
FVMs but significantly upregulated (logFC=1.28, P=0.000986) in the
inactive FVMs (Fig. 1E). FMO2 has
been reported to exhibit catalytic functions in a diverse range of
species (19,20). In previous studies, the activation of
FMO2 has been reported as necessary for dietary
restriction-mediated life-span extension, and has also been
reported as a biomarker for a starvation-associated longevity
response in Caenorhabditis elegans (21,22).
 | Figure 1.Overview of DEGs associated with PDR.
(A) Scatter diagram illustrating log2(FC) values of each gene
between the active and control samples, including 13,459
upregulated genes and 11,976 downregulated genes. (B) Scatter
diagram illustrating log2(FC) values of each gene between the
inactive and control samples, including 13,566 upregulated genes
and 11,869 downregulated genes. (C) Histogram of the numbers of
DEGs in the active and inactive samples. There were 690 upregulated
genes and 1,790 downregulated genes identified as significant in
the active samples. There were 503 upregulated genes and 1,866
downregulated genes significantly identified in the inactive
samples. (D) Venn diagram illustrating the overlapping genes of
DEGs in the active and inactive samples. (E) Bar chart of the
expression patterns of FMO2 in the active and inactive samples.
FMO2 was significantly downregulated (logFC=−1.44, P=0.00743) in
the active FVMs but significantly upregulated (logFC=1.28,
P=0.000986) in the inactive FVMs. PDR, proliferative diabetic
retinopathy; FC, fold change; FVMs, fibrovascular membranes; FMO2,
flavin-containing monooxygenase isoform 2; CT, control. |
Functional enrichment associated with
PDR
In order to annotate the functions of significant
gene sets associated with PDR, KEGG pathway enrichment analysis was
performed in each group of DEGs. In total, there were 24
significantly associated pathways in the active FVMs and 23
significantly associated pathways in the inactive FVMs, including
10 overlapping pathways (Fig. 2A).
For the upregulated genes in the active FVMs, the top 10 pathways
were extracellular matrix (ECM)-receptor interaction, focal
adhesion, protein digestion and absorption, amoebiasis,
leishmaniasis, small cell lung cancer, rheumatoid arthritis,
cytokine-cytokine receptor interaction, pathways in cancer, and
leukocyte transendothelial migration; for downregulated genes in
the active FVMs, the top 10 pathways were metabolic pathways,
tyrosine metabolism, arginine and proline metabolism,
phototransduction, phenylalanine metabolism, β-alanine metabolism,
proximal tubule bicarbonate reclamation, calcium signaling pathway,
tryptophan metabolism, and histidine metabolism (Fig. 2B). By contrast, the top 10 pathways
for upregulated genes in the inactive FVMs were ECM-receptor
interaction, rheumatoid arthritis, cell adhesion molecules (CAMs),
Staphylococcus aureus infection, graft-vs.-host disease,
focal adhesion, asthma, intestinal immune network for IgA
production, amoebiasis, and type I diabetes mellitus. The top 10
pathways for downregulated genes in the inactive FVMs were
metabolic pathways, phototransduction, arginine and proline
metabolism, Alzheimer's disease, Parkinson's disease, proximal
tubule bicarbonate reclamation, cardiac muscle contraction,
oxidative phosphorylation, Huntington's disease, and phenylalanine
metabolism (Fig. 2C). The details of
associated genes in these top 10 pathways in active and inactive
FVMs are presented in Tables I and
II.
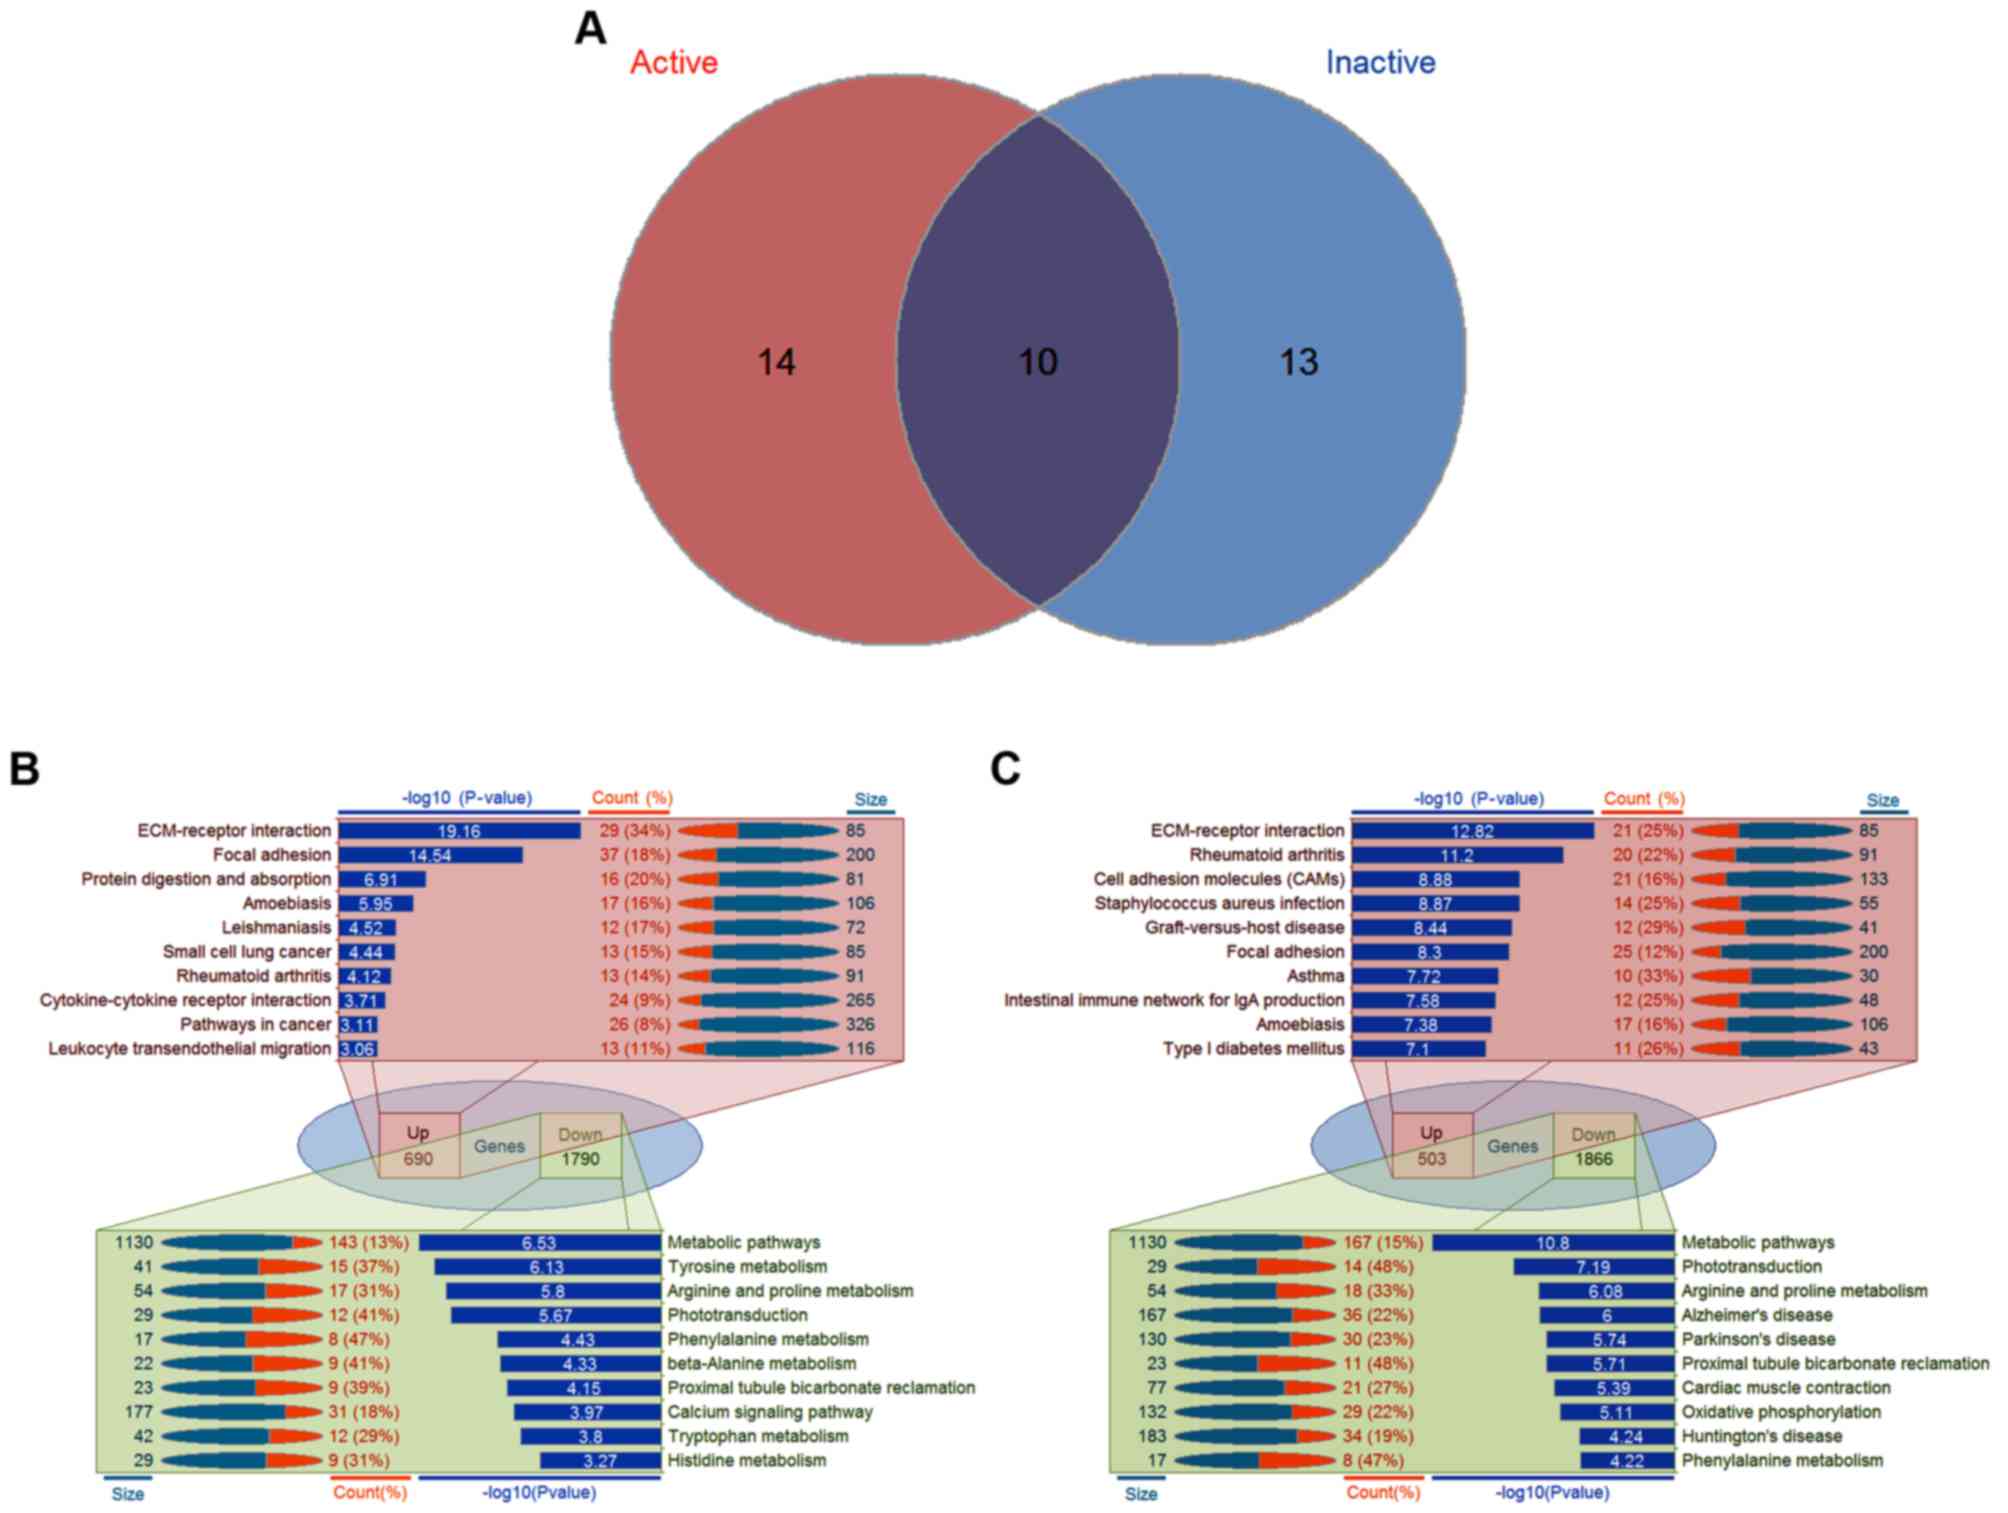 | Figure 2.Significantly enriched pathways
associated with PDR. (A) Venn diagram illustrating the overlapping
pathways in the active and inactive samples. (B) Detailed
information of the top 10 pathways in the active samples. For 690
upregulated genes in the active FVMs, the top 10 pathways were
ECM-receptor interaction, focal adhesion, protein digestion and
absorption, amoebiasis, leishmaniasis, small cell lung cancer,
rheumatoid arthritis, cytokine-cytokine receptor interaction,
pathways in cancer, and leukocyte transendothelial migration; for
1,790 downregulated genes in the active FVMs, the top 10 pathways
were metabolic pathways, tyrosine metabolism, arginine and proline
metabolism, phototransduction, phenylalanine metabolism, β-alanine
metabolism, proximal tubule bicarbonate reclamation, calcium
signaling pathway, tryptophan metabolism, and histidine metabolism.
(C) Detailed information of the top 10 pathways in the inactive
samples. For 503 upregulated genes in the active FVMs, the top 10
pathways were ECM-receptor interaction, focal adhesion, protein
digestion and absorption, amoebiasis, leishmaniasis, small cell
lung cancer, rheumatoid arthritis, cytokine-cytokine receptor
interaction, pathways in cancer, and leukocyte transendothelial
migration; for 1,866 downregulated genes in the active FVMs, the
top 10 pathways were metabolic pathways, tyrosine metabolism,
arginine and proline metabolism, phototransduction, phenylalanine
metabolism, β-alanine metabolism, proximal tubule bicarbonate
reclamation, calcium signaling pathway, tryptophan metabolism, and
histidine metabolism. PDR, proliferative diabetic retinopathy;
FVMs, fibrovascular membranes; Up, upregulated; Down,
downregulated; ECM, extracellular matrix. |
 | Table I.Top 10 upregulated pathways in active
fibrovascular membranes. |
Table I.
Top 10 upregulated pathways in active
fibrovascular membranes.
| Term | P-value | n | Gene symbols |
|---|
| ECM-receptor
interaction | 6.88E-20 | 29 | CD36, COL1A1, COL1A2,
COL3A1, COL4A1, COL4A2, COL5A1, COL5A2, COL6A1, COL6A2, COL6A3,
FN1, HMMR, HSPG2, TNC, ITGA1, ITGA2, ITGA4, ITGA5, ITGB1, LAMA4,
LAMB1, LAMC1, SPP1, THBS1, THBS2, ITGA11, COL5A3, AGRN |
| Focal adhesion | 2.86E-15 | 37 | ACTN1, BIRC2, CCND1,
CAV1, COL1A1, COL1A2, COL3A1, COL4A1, COL4A2, COL5A1, COL5A2,
COL6A1, COL6A2, COL6A3, DOCK1, FN1, TNC, ITGA1, ITGA2, ITGA4,
ITGA5, ITGB1, LAMA4, LAMB1, LAMC1, PDGFB, PDGFRB, PGF, SPP1, THBS1,
THBS2, VEGFC, ZYX, ITGA11, COL5A3, PARVG, MYLK2, |
| Protein digestion and
absorption | 1.23E-07 | 16 | COL1A1, COL1A2,
COL3A1, COL4A1, COL4A2, COL5A1, COL5A2, COL6A1, COL6A2, COL6A3,
COL12A1, COL15A1, SLC1A5, COL5A3, COL18A1, SLC36A1 |
| Amoebiasis | 1.13E-06 | 17 | ACTN1, COL1A1,
COL1A2, COL3A1, COL4A1, COL4A2, COL5A1, COL5A2, FN1, IL1B, LAMA4,
LAMB1, LAMC1, PLCB2 TGFB3 TNF, COL5A3 |
| Leishmaniasis | 3.00E-05 | 12 | CYBA, FCGR1A,
HLA-DMB, HLA-DOA, HLA-DQA1, IL1B, ITGA4, ITGB1, STAT1, TGFB3, TNF,
MARCKSL1 |
| Small cell lung
cancer | 3.61E-05 | 13 | BIRC2, CCND1, CDK6,
CDKN2B, COL4A1, COL4A2, E2F2, FN1, ITGA2, ITGB1, LAMA4, LAMB1,
LAMC1 |
| Rheumatoid
arthritis | 7.51E-05 | 13 | CD28, HLA-DMB,
HLA-DOA, HLA-DQA1, IL1B, PGF, CCL2, CCL3, CCL3L1, TGFB3, TNF,
TNFSF13B, CCL3L3 |
| Cytokine-cytokine
receptor interaction | 1.95E-04 | 24 | BMPR2, IL1B, IL2RB,
INHBB, CXCL10, CXCL9, TNFRSF11B, PDGFB, PDGFRB, CCL2, CCL3 CCL3L1,
CCL8, TGFB3, TNF, TNFSF4, TNFRSF4, VEGFC, TNFRSF10D, TNFSF13B,
TNFRSF21, TNFRSF12A, CCL4L1, CCL3L3 |
| Pathways in
cancer | 7.78E-04 | 26 | BIRC2, BIRC5, CCND1,
RUNX1, CDK6, CDKN2B, COL4A1, COL4A2, E2F2, ETS1, FN1, ITGA2, ITGB1,
LAMA4, LAMB1, LAMC1, MMP9, PDGFB, PDGFRB, PGF, RALA, STAT1, TGFB3,
HSP90B1, VEGFC, LEF1 |
| Leukocyte
transendothelial migration | 8.65E-04 | 13 | ACTN1, CDH5, CYBA,
CYBB, ITGA4, ITGB1, MMP9, MSN, PECAM1, THY1, CLDN5, CLDN1,
ESAM |
| Table II.Top 10 upregulated pathways in
inactive fibrovascular membranes. |
Table II.
Top 10 upregulated pathways in
inactive fibrovascular membranes.
| Term | P-value | n | Gene symbols |
|---|
| ECM-receptor
interaction | 1.52E-13 | 21 | COL1A1, COL1A2,
COL3A1, COL4A1, COL4A2, COL5A1, COL5A2, COL6A1, COL6A3, COL11A1,
COMP, TNC, ITGA1, ITGA2, ITGA5, LAMA4, LAMB1, LAMC1, THBS1, THBS2,
ITGA11 |
| Rheumatoid
arthritis | 6.31E-12 | 20 | CD86, HLA-DMA,
HLA-DMB, HLA-DOA, HLA-DPB1, HLA-DQA1, HLA-DQB1, HLA-DRA, HLA-DRB4,
IL1B, IL6, ITGAL, PGF, CCL2, CCL3, CCL3L1, CCL5, TNF, TNFSF13B,
CCL3L3 |
| Cell adhesion
molecules (CAMs) | 1.31E-09 | 21 | CD2, CD6, CD8A, CD86,
CD58, CDH2, HLA-DMA, HLA-DMB, HLA-DOA, HLA-DPB1, HLA-DQA1,
HLA-DQB1, HLA-DRA, HLA-DRB4, ITGAL, NRCAM, CLDN11, PECAM1, CLDN5,
CLDN1, ICOS |
| Staphylococcus
aureus infection | 1.34E-09 | 14 | C3AR1, C5AR1, FCGR1A,
CFH, HLA-DMA, HLA-DMB, HLA-DOA, HLA-DPB1, HLA-DQA1, HLA-DQB1,
HLA-DRA, HLA-DRB4, CFI, ITGAL |
| Graft-vs.-host
disease | 3.67E-09 | 12 | CD86, HLA-DMA,
HLA-DMB, HLA-DOA, HLA-DPB1, HLA-DQA1, HLA-DQB1, HLA-DRA, HLA-DRB4,
IL1B, IL6, TNF |
| Focal adhesion | 4.98E-09 | 25 | ACTN1, COL1A1,
COL1A2, COL3A1, COL4A1, COL4A2, COL5A1, COL5A2, COL6A1, COL6A3,
COL11A1 COMP, TNC, ITGA1, ITGA2, ITGA5 LAMA4, LAMB1, LAMC1, PGF,
RAC2, THBS1, THBS2, ITGA11, PARVG |
| Asthma | 1.89E-08 | 10 | FCER1G, HLA-DMA,
HLA-DMB, HLA-DOA, HLA-DPB1, HLA-DQA1, HLA-DQB1, HLA-DRA, HLA-DRB4,
TNF |
| Intestinal immune
network for IgA production | 2.65E-08 | 12 | CD86, HLA-DMA,
HLA-DMB, HLA-DOA, HLA-DPB1, HLA-DQA1, HLA-DQB1, HLA-DRA, HLA-DRB4,
IL6, TNFSF13B, ICOS |
| Amoebiasis | 4.21E-08 | 17 | ACTN1, CD14 COL1A1,
COL1A2, COL3A1, COL4A1, COL4A2, COL5A1, COL5A2, COL11A1, IL1B, IL6,
LAMA4, LAMB1, LAMC1, PLCB2, TNF |
| Type I diabetes
mellitus | 7.95E-08 | 11 | CD86, HLA-DMA,
HLA-DMB, HLA-DOA, HLA-DPB1, HLA-DQA1, HLA-DQB1, HLA-DRA, HLA-DRB4,
IL1B, TNF |
TFs regulating target genes associated
with PDR
By integrating the target genes identified in the
present study with the gene regulation data from TRANSFAC, several
associated TFs were identified for the active and inactive FVMs,
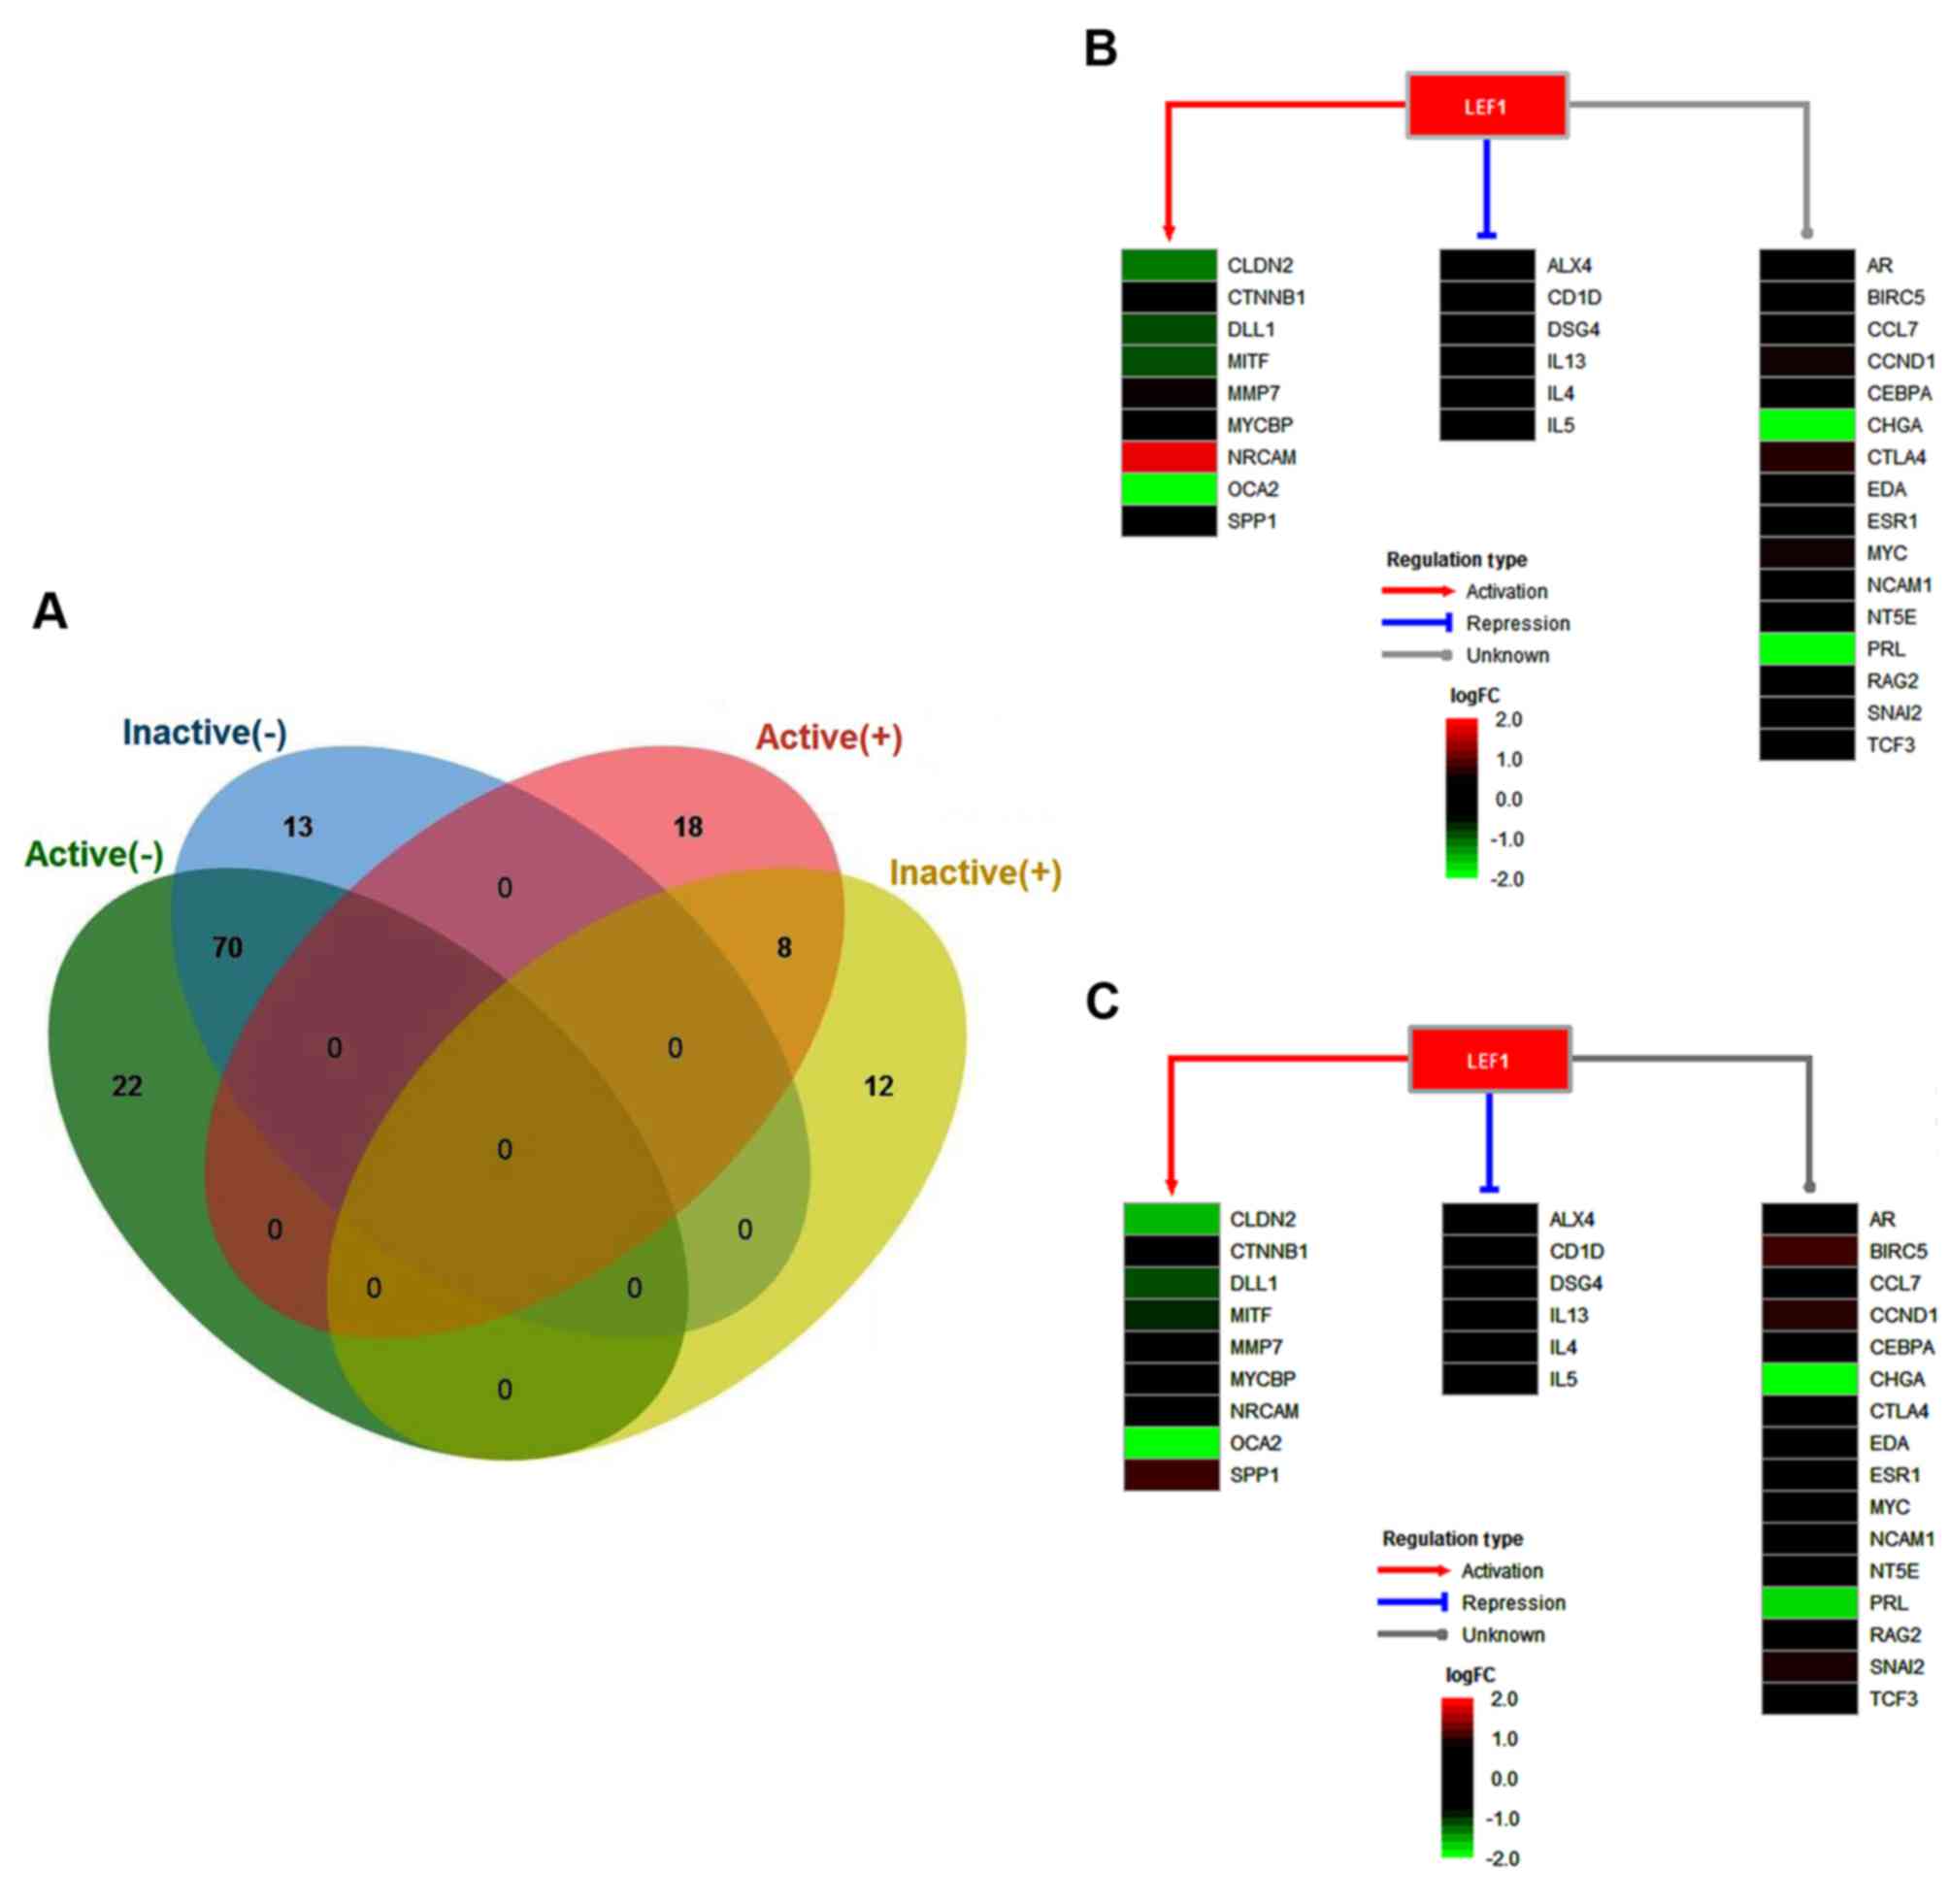
respectively. As a result, a total of 118 TFs were identified for
the active FVMs, including 26 upregulated TFs and 92 downregulated
TFs. For the inactive FVMs, a 103 total TFs were identified,
including 20 upregulated and 83 downregulated TFs. According to the
aforementioned data comparison, there were 78 overlapping TFs,
including eight commonly upregulated and 70 commonly downregulated
TFs (Fig. 3A). Among these, the
transcription factor lymphoid enhancing binding factor-1 (LEF1) was
identified as an important regulator. LEF1 is reported to be a
central regulator of effecting the differentiation and cell number
of invariant natural killer T cells (23). It has been revealed that the
Wnt/β-catenin effector LEF1 may regulate tyrosinase gene
transcription during melanocyte development and differentiation
(24). In the present study, LEF1
was upregulated in active and inactive FVMs, with the ability to
activate nine target genes, including claudin 2, catenin β1 δ-like
1, microphthalmia-associated transcription factor, matrix
metalloproteinase 7, MYC binding protein, neuronal cell adhesion
molecule, OCA2 and secreted phosphoprotein 1 (SPP1). However, the
transcription of six genes, namely ALX4, CD1D, desmoglein 4,
interleukin (IL)13, IL4 and IL5, were repressed by LEF1. The
majority of LEF1 target genes had similar expression levels between
active and inactive FVMs. However, the expression of SPP1 was
significantly higher in the active samples (Fig. 3B), but was not significantly altered
in the inactive samples (Fig. 3C),
when compared with the controls. The co-expression of SPP1 and LEF1
protein was previously investigated by immunohistochemistry using a
tFVM microarray, which demonstrated that LEF1 may serve as a
prognostic biomarker for primary colorectal carcinoma and liver
metastases (25). In the present
study, it was demonstrated that the Wnt/β-catenin effector LEF1
regulating SPP1 may be important in PDR.
In a previous study based on microarray analysis
using Welch's t-test coupled with a multidimensional
false-discovery control by Ishikawa et al (3), only 91 genes were identified to be
significantly upregulated in active FVMs, the majority of which
were clustered in the functional category of angiogenesis. A total
of 89 genes were shown to be significantly upregulated in inactive
FVMs, the majority of which were clustered in the functional
category of metabolism. Furthermore, the ingenuity pathway analysis
revealed that ECM-related molecules, including periostin, tenascin
C, hexabrachion, transforming growth factor β families, and
angiogenic factors, are essential in promoting the development of
FVMs associated with PDR. These genetic factors were also
identified in the list of upregulated genes in active and inactive
FVMs in the present study. A number of previously unreported genes
were reidentified, therefore, these results appeared to be more
systematic and comprehensive, when compared with those of previous
studies. However, due to the lack of relevant molecular biological
experimental data in the present study, the identification of
genetic site information requires further confirmation in future
investigations.
Acknowledgements
Not applicable.
Funding
The present study was supported by the Key
University Science Research Project of Anhui Province (grant no.
KJ2017A021), the Natural Science Foundation Project of Anhui
Province (grant no. 1508085QC63), the Scientific Research
Foundation and Academic & Technology Leaders Introduction
Project, and 211 Project of Anhui University (grant no.
10117700023), the Student Research Training Program of Anhui
University (grant nos. J10118520218 and J10118520307) and the
Education Revitalization Project of Anhui Province: Stem Cell and
Translational Medicine (grant no. Y05201374).
Availability of data and materials
The datasets used and/or analyzed during the current
study are available from the corresponding author on reasonable
request.
Authors' contributions
MTG and KH designed the study. WXL, QZ, ZHH, SLZ and
WWL performed breast cancer data collection. HZ, JW and MTG
performed data analysis. WXL, QZ, KH and MTG wrote the manuscript.
The final version of the manuscript has been read and approved by
all authors, and each author considers the manuscript to represent
honest work.
Ethics approval and consent to
participate
Not applicable.
Consent for publication
Not applicable.
Competing interests
The authors declare that they have no competing
interests.
References
|
1
|
Graham PS, Kaidonis G, Abhary S, Gillies
MC, Daniell M, Essex RW, Chang JH, Lake SR, Pal B, Jenkins AJ, et
al: Genome-wide association studies for diabetic macular edema and
proliferative diabetic retinopathy. BMC Med Genet. 19:712018.
View Article : Google Scholar : PubMed/NCBI
|
|
2
|
Huang YC, Liao WL, Lin JM, Chen CC, Liu
SP, Chen SY, Lin YN, Lei YJ, Liu HT, Chen YJ and Tsai FJ: High
levels of circulating endothelial progenitor cells in patients with
diabetic retinopathy are positively associated with ARHGAP22
expression. Oncotarget. 9:17858–17866. 2018. View Article : Google Scholar : PubMed/NCBI
|
|
3
|
Ishikawa K, Yoshida S, Kobayashi Y, Zhou
Y, Nakama T, Nakao S, Sassa Y, Oshima Y, Niiro H, Akashi K, et al:
Microarray analysis of gene expression in fibrovascular membranes
excised from patients with proliferative diabetic retinopathy.
Invest Ophthalmol Vis Sci. 56:932–946. 2015. View Article : Google Scholar : PubMed/NCBI
|
|
4
|
Nathan DM: Long-term complications of
diabetes mellitus. N Engl J Med. 328:1676–1685. 1993. View Article : Google Scholar : PubMed/NCBI
|
|
5
|
Uhlmann K, Kovacs P, Boettcher Y, Hammes
HP and Paschke R: Genetics of diabetic retinopathy. Exp Clin
Endocrinol Diabetes. 114:275–294. 2006. View Article : Google Scholar : PubMed/NCBI
|
|
6
|
Khalfaoui T, Lizard G, Beltaief O, Colin
D, Ben Hamida J, Errais K, Ammous I, Zbiba W, Tounsi L, Zhioua R,
et al: Immunohistochemical analysis of cellular adhesion molecules
(ICAM-1, VCAM-1) and VEGF in fibrovascular membranes of patients
with proliferative diabetic retinopathy: Preliminary study. Pathol
Biol (Paris). 57:513–517. 2009. View Article : Google Scholar : PubMed/NCBI
|
|
7
|
Beranek M, Kolar P, Tschoplova S, Kankova
K and Vasku A: Genetic variation and plasma level of the basic
fibroblast growth factor in proliferative diabetic retinopathy.
Diabetes Res Clin Pract. 79:362–367. 2008. View Article : Google Scholar : PubMed/NCBI
|
|
8
|
Uthra S, Raman R, Mukesh BN, Rajkumar SA,
Kumari RP, Agarwal S, Paul PG, Lakshmipathy P, Gnanamoorthy P,
Sharma T, et al: Diabetic retinopathy and IGF-1 gene polymorphic
cytosine-adenine repeats in a Southern Indian cohort. Ophthalmic
Res. 39:294–299. 2007. View Article : Google Scholar : PubMed/NCBI
|
|
9
|
Cilenšek I, Mankoč S, Globočnik Petrovič M
and Petrovič D: The 4a/4a genotype of the VNTR polymorphism for
endothelial nitric oxide synthase (eNOS) gene predicts risk for
proliferative diabetic retinopathy in Slovenian patients
(Caucasians) with type 2 diabetes mellitus. Mol Biol Rep.
39:7061–7067. 2012. View Article : Google Scholar : PubMed/NCBI
|
|
10
|
Crispim D, Fagundes NJ, dos Santos KG,
Rheinheimer J, Bouças AP, de Souza BM, Macedo GS, Leiria LB, Gross
JL and Canani LH: Polymorphisms of the UCP2 gene are associated
with proliferative diabetic retinopathy in patients with diabetes
mellitus. Clin Endocrinol (Oxf). 72:612–619. 2010. View Article : Google Scholar : PubMed/NCBI
|
|
11
|
Santos KG, Crispim D, Canani LH, Ferrugem
PT, Gross JL and Roisenberg I: Relationship of endothelial nitric
oxide synthase (eNOS) gene polymorphisms with diabetic retinopathy
in Caucasians with type 2 diabetes. Ophthalmic Genet. 33:23–27.
2012. View Article : Google Scholar : PubMed/NCBI
|
|
12
|
Choi D, Appukuttan B, Binek SJ, Planck SR,
Stout JT, Rosenbaum JT and Smith JR: Prediction of Cis-regulatory
elements controlling genes differentially expressed by retinal and
choroidal vascular endothelial cells. J Ocul Biol Dis Infor.
1:37–45. 2008. View Article : Google Scholar : PubMed/NCBI
|
|
13
|
Gu Y, Ke G, Wang L, Zhou E, Zhu K and Wei
Y: Altered expression profile of circular RNAs in the serum of
patients with diabetic retinopathy revealed by microarray.
Ophthalmic Res. 58:176–184. 2017. View Article : Google Scholar : PubMed/NCBI
|
|
14
|
Edgar R, Domrachev M and Lash AE: Gene
expression omnibus: NCBI gene expression and hybridization array
data repository. Nucleic Acids Res. 30:207–210. 2002. View Article : Google Scholar : PubMed/NCBI
|
|
15
|
Carvalho BS and Irizarry RA: A framework
for oligonucleotide microarray preprocessing. Bioinformatics.
26:2363–2367. 2010. View Article : Google Scholar : PubMed/NCBI
|
|
16
|
Huang da W, Sherman BT and Lempicki RA:
Systematic and integrative analysis of large gene lists using DAVID
bioinformatics resources. Nat Protoc. 4:44–57. 2009. View Article : Google Scholar : PubMed/NCBI
|
|
17
|
Matys V, Kel-Margoulis OV, Fricke E,
Liebich I, Land S, Barre-Dirrie A, Reuter I, Chekmenev D, Krull M,
Hornischer K, et al: TRANSFAC and its module TRANSCompel:
Transcriptional gene regulation in eukaryotes. Nucleic Acids Res.
34(Database Issue): D108–D110. 2006. View Article : Google Scholar : PubMed/NCBI
|
|
18
|
Wingender E, Dietze P, Karas H and Knüppel
R: TRANSFAC: A database on transcription factors and their DNA
binding sites. Nucleic Acids Res. 24:238–241. 1996. View Article : Google Scholar : PubMed/NCBI
|
|
19
|
Karoly ED and Rose RL: Sequencing,
expression, and characterization of cDNA expressed
flavin-containing monooxygenase 2 from mouse. J Biochem Mol
Toxicol. 15:300–308. 2001. View Article : Google Scholar : PubMed/NCBI
|
|
20
|
Scharf ME, Scharf DW, Bennett GW and
Pittendrigh BR: Catalytic activity and expression of two
flavin-containing monooxygenases from Drosophila melanogaster. Arch
Insect Biochem Physiol. 57:28–39. 2004. View Article : Google Scholar : PubMed/NCBI
|
|
21
|
Bennett CF, Kwon JJ, Chen C, Russell J,
Acosta K, Burnaevskiy N, Crane MM, Bitto A, Vander Wende H, Simko
M, et al: Transaldolase inhibition impairs mitochondrial
respiration and induces a starvation-like longevity response in
Caenorhabditis elegans. PLoS Genet. 13:e10066952017. View Article : Google Scholar : PubMed/NCBI
|
|
22
|
Leiser SF, Miller H, Rossner R, Fletcher
M, Leonard A, Primitivo M, Rintala N, Ramos FJ, Miller DL and
Kaeberlein M: Cell nonautonomous activation of flavin-containing
monooxygenase promotes longevity and health span. Science.
350:1375–1378. 2015. View Article : Google Scholar : PubMed/NCBI
|
|
23
|
Carr T, Krishnamoorthy V, Yu S, Xue HH,
Kee BL and Verykokakis M: The transcription factor lymphoid
enhancer factor 1 controls invariant natural killer T cell
expansion and Th2-type effector differentiation. J Exp Med.
212:793–807. 2015. View Article : Google Scholar : PubMed/NCBI
|
|
24
|
Wang X, Liu Y, Chen H, Mei L, He C, Jiang
L, Niu Z, Sun J, Luo H, Li J and Feng Y: LEF-1 regulates tyrosinase
gene transcription in vitro. PLoS One. 10:e01431422015. View Article : Google Scholar : PubMed/NCBI
|
|
25
|
Lin AY, Chua MS, Choi YL, Yeh W, Kim YH,
Azzi R, Adams GA, Sainani K, van de Rijn M, So SK and Pollack JR:
Comparative profiling of primary colorectal carcinomas and liver
metastases identifies LEF1 as a prognostic biomarker. PLoS One.
6:e166362011. View Article : Google Scholar : PubMed/NCBI
|