Introduction
Pregnancy-induced hypertension (PIH) is a
multi-system disease with unknown etiology, including hypertensive
disorder complicated pregnancy such as eclampsia, or preeclampsia
combined with chronic hypertension (1,2).
Symptoms of patients are manifested as facial swelling, leg edema
and headache during pregnancy. In addition, complications of PIH
patients include eclampsia, placental abruption, oliguria, anuria,
blurred vision and hemolysis, elevated liver enzymes and low
platelet count (HELLP) syndrome (3).
Common symptoms of infants born to PIH mothers include intrauterine
death (IUD), intrauterine growth retardation (IUGR), perinatal
asphyxia, neonatal infection, bleeding, and other complications
(4). Advances in modern
biochemistry, histology and enzymology research, changes in the
maternal body and their effects on the fetus can now be accurately
observed (5). However, PIH is the
leading cause of maternal and fetal morbidity in developing
countries due to poor assessment of the health status of pregnant
women. It is reported that more than 60,000 maternal deaths each
year are caused by PIH worldwide (6). The mortality rates of infants with a
low birth weight in the perinatal and neonatal periods were 10% and
40–50%, respectively (7).
PIH is defined as systolic blood pressure (SBP)
>140 mmHg and diastolic blood pressure (DBP) >90 mmHg.
According to different scores, it is subdivided into three stages:
the mild stage (SBP=140–149 mmHg and DBP=90–99 mmHg), the moderate
stage (SBP=150–159 mmHg and DBP=100–109 mmHg) and the severe stage
(SBP ≥160 mmHg and DBP ≥110 mmHg), whose symptoms are manifested as
hypertension and proteinuria (8). At
present, the pathogenesis of PIH is not yet fully elucidated.
Previous studies revealed that the possible pathogeneses are
shallow placenta accreta, trophoblastic ischemia and hypoxia,
vascular endothelial cell injury, immune and inflammatory reaction
disorders and thrombosis (9). Of
these, the placenta plays a key role in the pathogenesis of PIH
(10). In this study, hypertensive
pregnant rats were used as study models to explore the relationship
of the expression of inflammatory cytokines with blood pressure and
urine proteins in the placenta.
Materials and methods
Experimental animals
A total of 135 Spragne-Dawley rats were purchased
from the Hunan Slack Jingda Laboratory Animal Co., Ltd. (Changsha,
China), including 60 females and 75 males, aged 2–3 months and
weighing approximately 200–250 g. The rats were bred in the
specific-pathogen-free (SPF) environment, in which sufficient water
and fodder were guaranteed. The temperature was kept constant at
25°C, the light time was 6 a.m.-6 p.m., the relative humidity was
approximately 70%, and the experiment was started after the rats
were bred for one week to adapt to the environment. The study was
approved by the Ethics Committee of Qilu Hospital of Shandong
University (Jinan, China).
Establishment of PIH rat models
The purchased adult rats were bred in a cage at a
ratio of female:male=4:5. Vaginal secretions of female rats were
scraped at 9:00 every morning, which were then smeared on glass
slides to be observed under a microscope (Olympus Corporation,
Tokyo, Japan). If sperms were found, the day would be recorded as
day 0 of pregnancy, indicating that all the females were pregnant.
These rats were normally bred until day 15 of pregnancy, and then
60 pregnant rats were randomly divided into the normoxia with
normal blood pressure group (control group, n=20), the 10%
hypoxia-induced PIH group (hypertension group, n=20) and the group
in which caudal veins were consecutively administered with an
anti-hypertensive drug, Treprostinil for one week after 10%
hypoxia-induced PIH (treatment group, n=20).
Data collection
The caudal vein blood pressure of the three groups
of pregnant rats was tested on day 15, 18 and 21 of pregnancy with
a rat caudal artery non-invasive blood pressure monitor,
respectively. Specific operation procedures were carried out. Tails
of rats were fixed using rat fixators and heated at a constant
temperature, and the pressurized tail cuff and the pulse transducer
were sequentially placed at the appropriate position of rat tails
to determine the initial pulse level. To measure blood pressure,
the rubber balloon was inflated and pressurized, so that the
pressure within the pressurized tail cuff was increased until the
pulse completely disappeared. Approximately 20 mmHg pressure was
further increased, and then slow deflation for decompression was
conducted until the pulse signal was restored to the initial level.
At this time, systolic blood pressure, diastolic blood pressure,
mean arterial pressure and heart rate were read from the pressure
capsule or recording system. Measurement was continuously conducted
five times, and the average value was taken as a measurement value,
followed by collection of 24 h urine proteins on day 15, 18 and 21
of pregnancy. On day 22 of pregnancy, chloral hydrate was used for
anesthesia, and pregnant rats were sacrificed via cervical
dislocation. The typical placenta of the two uterine horns was
dissected and rinsed with saline, which was then absorbed by the
filter paper and stored at −80°C in a refrigerator for standby
application.
Detection of messenger ribonucleic
acid (mRNA) levels of interleukin-6 (IL-6) and tumor necrosis
factor-α (TNF-α) by reverse transcription polymerase chain reaction
(RT-PCR)
Rat placental tissues were removed on day 22 of
pregnancy, and the total RNA was extracted with TRIzol reagent
(Invitrogen, Carlsbad, CA, USA) according to the manufacturer's
protocol. The extracted total RNA was dissolved in diethyl
pyrocarbonate (DEPC)-treated water. The concentration of RNA was
measured at a wavelength of 260 nm using spectrophotometry (Bio-Rad
Laboratories, Inc., Hercules, CA, USA). Complementary
deoxyribonucleic acid (cDNA) (1 µg) was synthesized using the
Takara Reverse Transcription kit (Takara Bio, Inc., Otsu, Japan;
cat. no.: 639505, Japan). ReverTra Ace quantitative PCR (qPCR) RT
kit (Toyobo, Osaka, Japan; cat. no.: FSQ-101) was used to measure
the mRNA level of each index. Reaction conditions were: 50°C for 10
min; 95°C for 5 min; 95°C for 15 sec followed by 60°C for 30 sec; a
total of 40 cycles. Glyceraldehyde-3-phosphate dehydrogenase
(GAPDH) was taken as the internal reference. The relative
expression level of each index was calculated as: 2−∆Cq
[∆Cq = Cq (target gene) - Cq (GAPDH)]. Primer sequences of each
target gene and internal reference used were: GAPDH (forward:
GATGCTGGTGCTGAGTATGTCG; reverse: TGGTGCAGGATGCATTGCTGA); IL-6
(forward: AATCTGCTCTGGTCTTCTGGAG; reverse: GTTGGATGGTCTTGGTCCTTAG);
TNF-α (forward: GACTTTAAGGGTTACCTGGGTTG; reverse:
TCACATGCGCCTTGATGTCTG).
Detection of protein levels of IL-6 and TNF-α in
placenta tissues by western blot analysis and immunohistochemistry.
Placenta tissues of the rats were cut into pieces and homogenized.
Then an appropriate amount of radioimmunoprecipitation assay (RIPA)
lysis buffer (Beyotime Institute of Biotechnology, Guangzhou,
China) was added and homogenized with the mixed solution of 1%
cocktail protease (Proteintech Group, Inc., Chicago, IL, USA).
After centrifugation at 13,000 × g for 30 min, the supernatant was
taken to determine its protein concentration. Protein samples (40
µg) were separated by sodium dodecyl sulfate polyacrylamide gel
electrophoresis (SDS-PAGE). The total protein membrane was
transferred using polyvinylidene fluoride (PVDF), and the bands
were incubated using the primary antibodies and anti-rabbit
secondary antibodies of IL-6 (1:800; Abcam, Cambridge, UK; cat. no.
ab6672) and TNF-α (1:600; Abcam, cat. no. ab6671). Hypersensitive
chemiluminescence (Millipore, Billerica, MA, USA) was used to
detect the abundance of the target protein under an enhanced
chemiluminescence (ECL) system (Millipore). Image Lab software
(Bio-Rad Laboratories, Inc., Hercules, CA, USA) was used to analyze
the gray level of the target protein. The relative content of the
target protein was the ratio of the gray level of the target
protein to the corresponding internal parameter bands. The results
were analyzed by independent t-test.
Tissue samples were fixed in 4% neutral formalin for
12 h, dehydrated by gradient ethanol and embedded in paraffin, and
then serially sectioned at 4 µm. The slices were dewaxed and
hydrated. After 30 min of permeation with 5% Triton and 15 min of
microwave-treated antigen retrieval, the slices were incubated with
3% H2O2 deionized water for 10 min to block
the action of endogenous peroxidase. Subsequently, the slices were
dropwise added with 100 µl primary antibodies of IL-6 and TNF-α
(diluted at 1:500, Santa Cruz Biotechnology, Inc., Santa Cruz, CA,
USA) and incubated at 4°C overnight. Then the slices were washed
with phosphate-buffered saline (PBS), dropwise added with
horseradish peroxidase-labeled goat anti-rabbit secondary
polyclonal antibody (1:1,000; cat. no. ab6721; Abcam), and
incubated for 30 min at room temperature, followed by
3,3′-diaminobenzidine (DAB) color development with PBS as a
negative control. Four different fields of view of each slice were
randomly selected, and the optical density value under each field
of view was measured, respectively.
Statistical analysis
Statistical Product and Service and Solutions (SPSS)
10.0 software was used for data analysis. Measurement data were
expressed as mean ± SD. ANOVA was used for comparison between
multiple groups and the post hoc test was SNK test. Correlation
analyses of inflammatory cytokines with blood pressure and urine
proteins were conducted using Pearson's correlation analysis.
Quantification analysis was performed using an unpaired Student's
t-test. P<0.05 was considered to indicate a statistically
significant difference.
Results
Comparisons of the average blood
pressure and urine protein in the three groups of rats
At different time points (day 15, 18 and 21 of
pregnancy), blood pressure and urine proteins were measured,
respectively, and the average value was calculated. As shown in
Table I, compared with those in the
control group, blood pressure and urine proteins in the
hypertension group were significantly increased (P<0.05).
However, the treatment group was given anti-hypertensive drugs
after inducing hypertension. There were no statistically
significant differences in blood pressure and urine proteins at
different time points between the control group and the treatment
group (P>0.05).
 | Table I.Measurement results at three
time-periods of the average arterial pressure and urine protein in
three groups of rats. |
Table I.
Measurement results at three
time-periods of the average arterial pressure and urine protein in
three groups of rats.
|
| Blood pressure
(mmHg) | Urine proteins
(mg/ml) |
|---|
|
|
|
|
|---|
| Group | 15 days | 18 days | 21 days | 15 days | 18 days | 21 days |
|---|
| Control group | 100.3±3 | 101.2±2.5 | 102.3±2.5 | 155.3±13.6 | 165.3±5.1 | 165.3±5.1 |
| Hypertension
group | 102.8±2 |
146.6±2.1a |
156.6±2.1a |
166.3±6.9a |
566.3±7.3b |
566.3±7.3b |
| Treatment group | 106.2±3 | 103.3±3.2 | 110.3±3.2 | 145.3±8.6 | 153.3±7.9 | 153.3±7.9 |
| P-value | >0.05 | <0.05 | <0.05 | >0.05 | <0.05 | <0.05 |
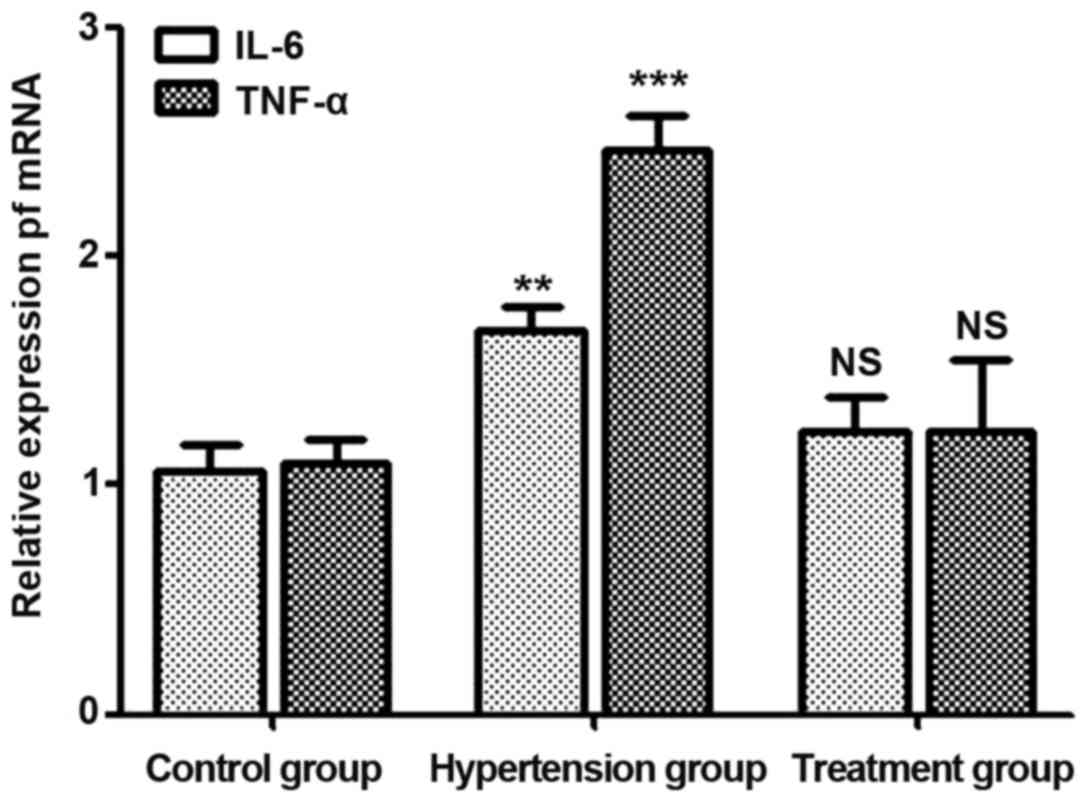
mRNA levels of IL-6 and TNF-α in
placenta tissues of pregnant rats
On day 21 of pregnancy, placenta tissues were
extracted and ground for RNA extraction. mRNA levels of IL-6 and
TNF-α were detected. Results (Fig.
1) showed that mRNA levels of IL-6 and TNF-α in the
hypertension group were higher than those in the control group
(P<0.05), while there were no statistically significant
differences in mRNA levels of IL-6 and TNF-α between the treatment
group and the control group (P>0.05).
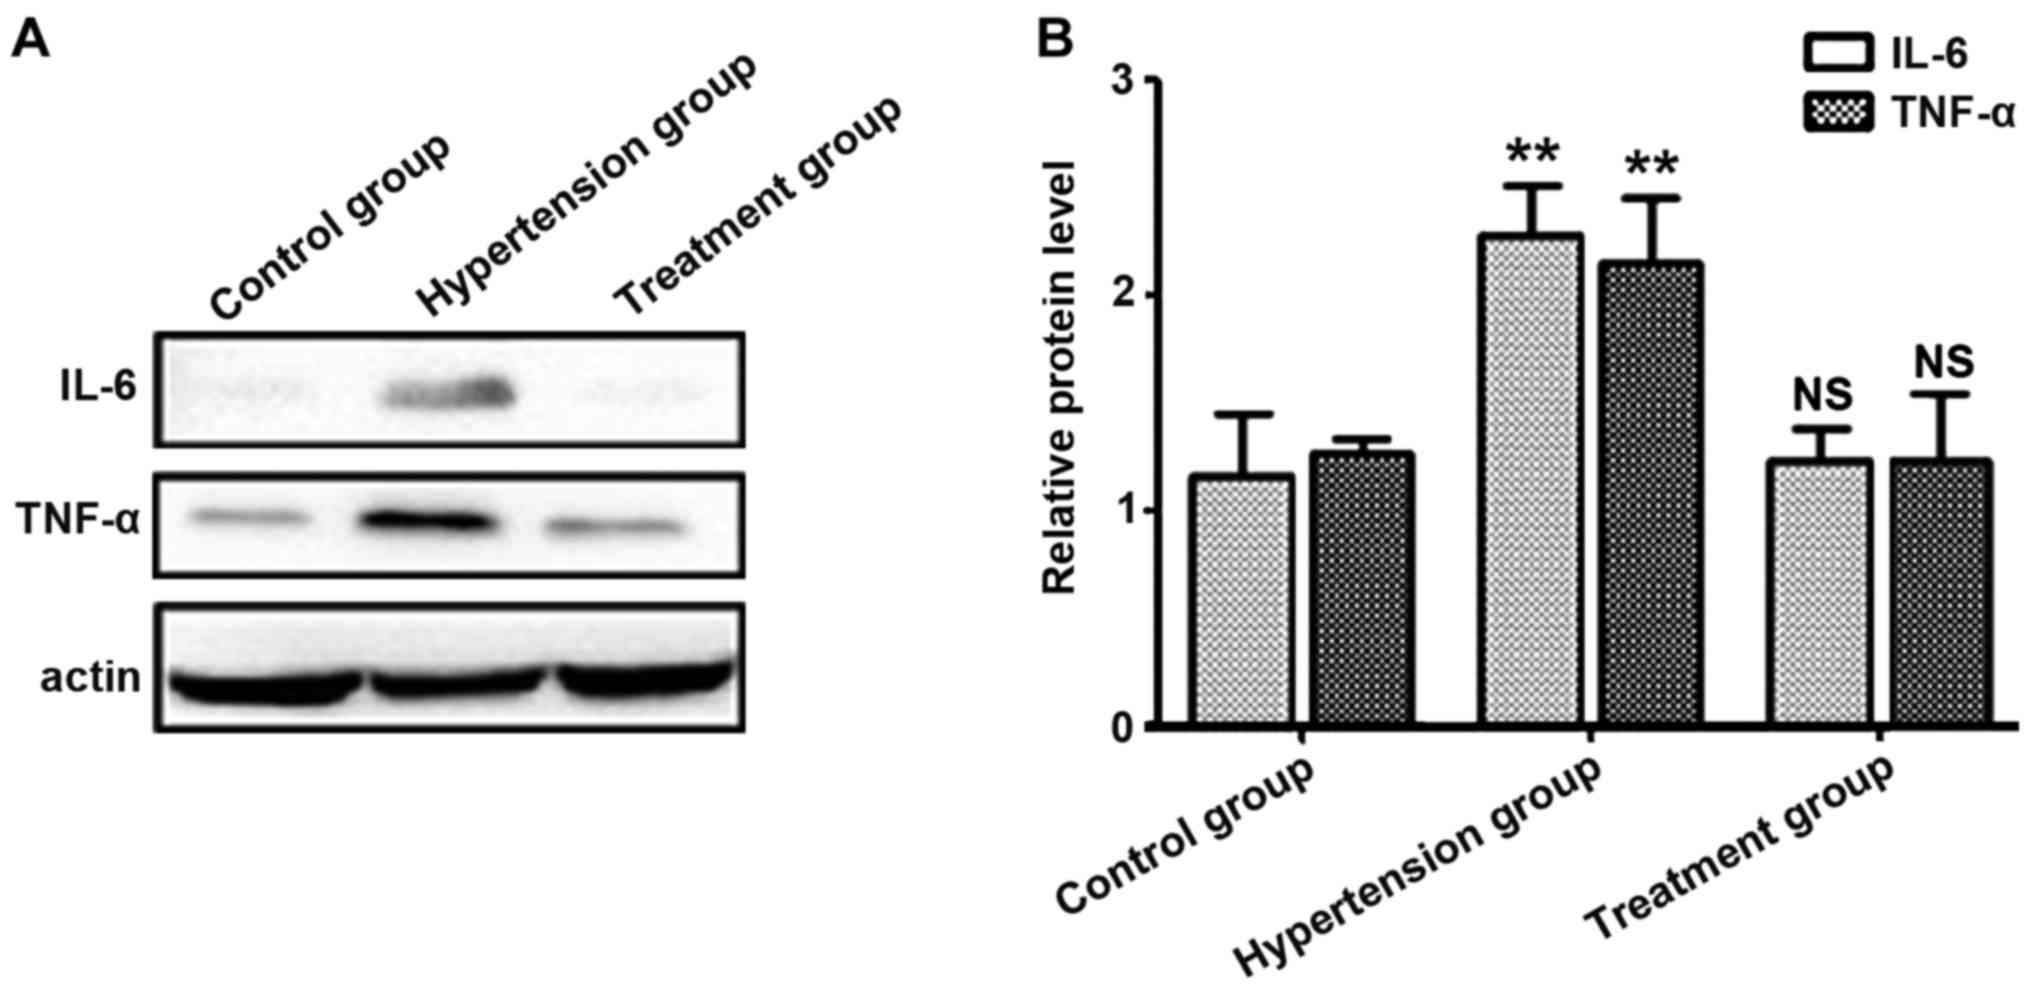
Protein levels of IL-6 and TNF-α in
placenta tissues of pregnant rats
Proteins in placenta tissues were extracted, and
protein levels of IL-6 and TNF-α were detected. Results showed that
the average protein levels of IL-6 and TNF-α in the hypertension
group were higher than those in the control group (P<0.05),
while there were no statistically significant differences in
protein levels of IL-6 and TNF-α between the treatment and control
groups, suggesting that the expression levels of IL-6 and TNF-α are
positively correlated with PIH (Fig.
2).
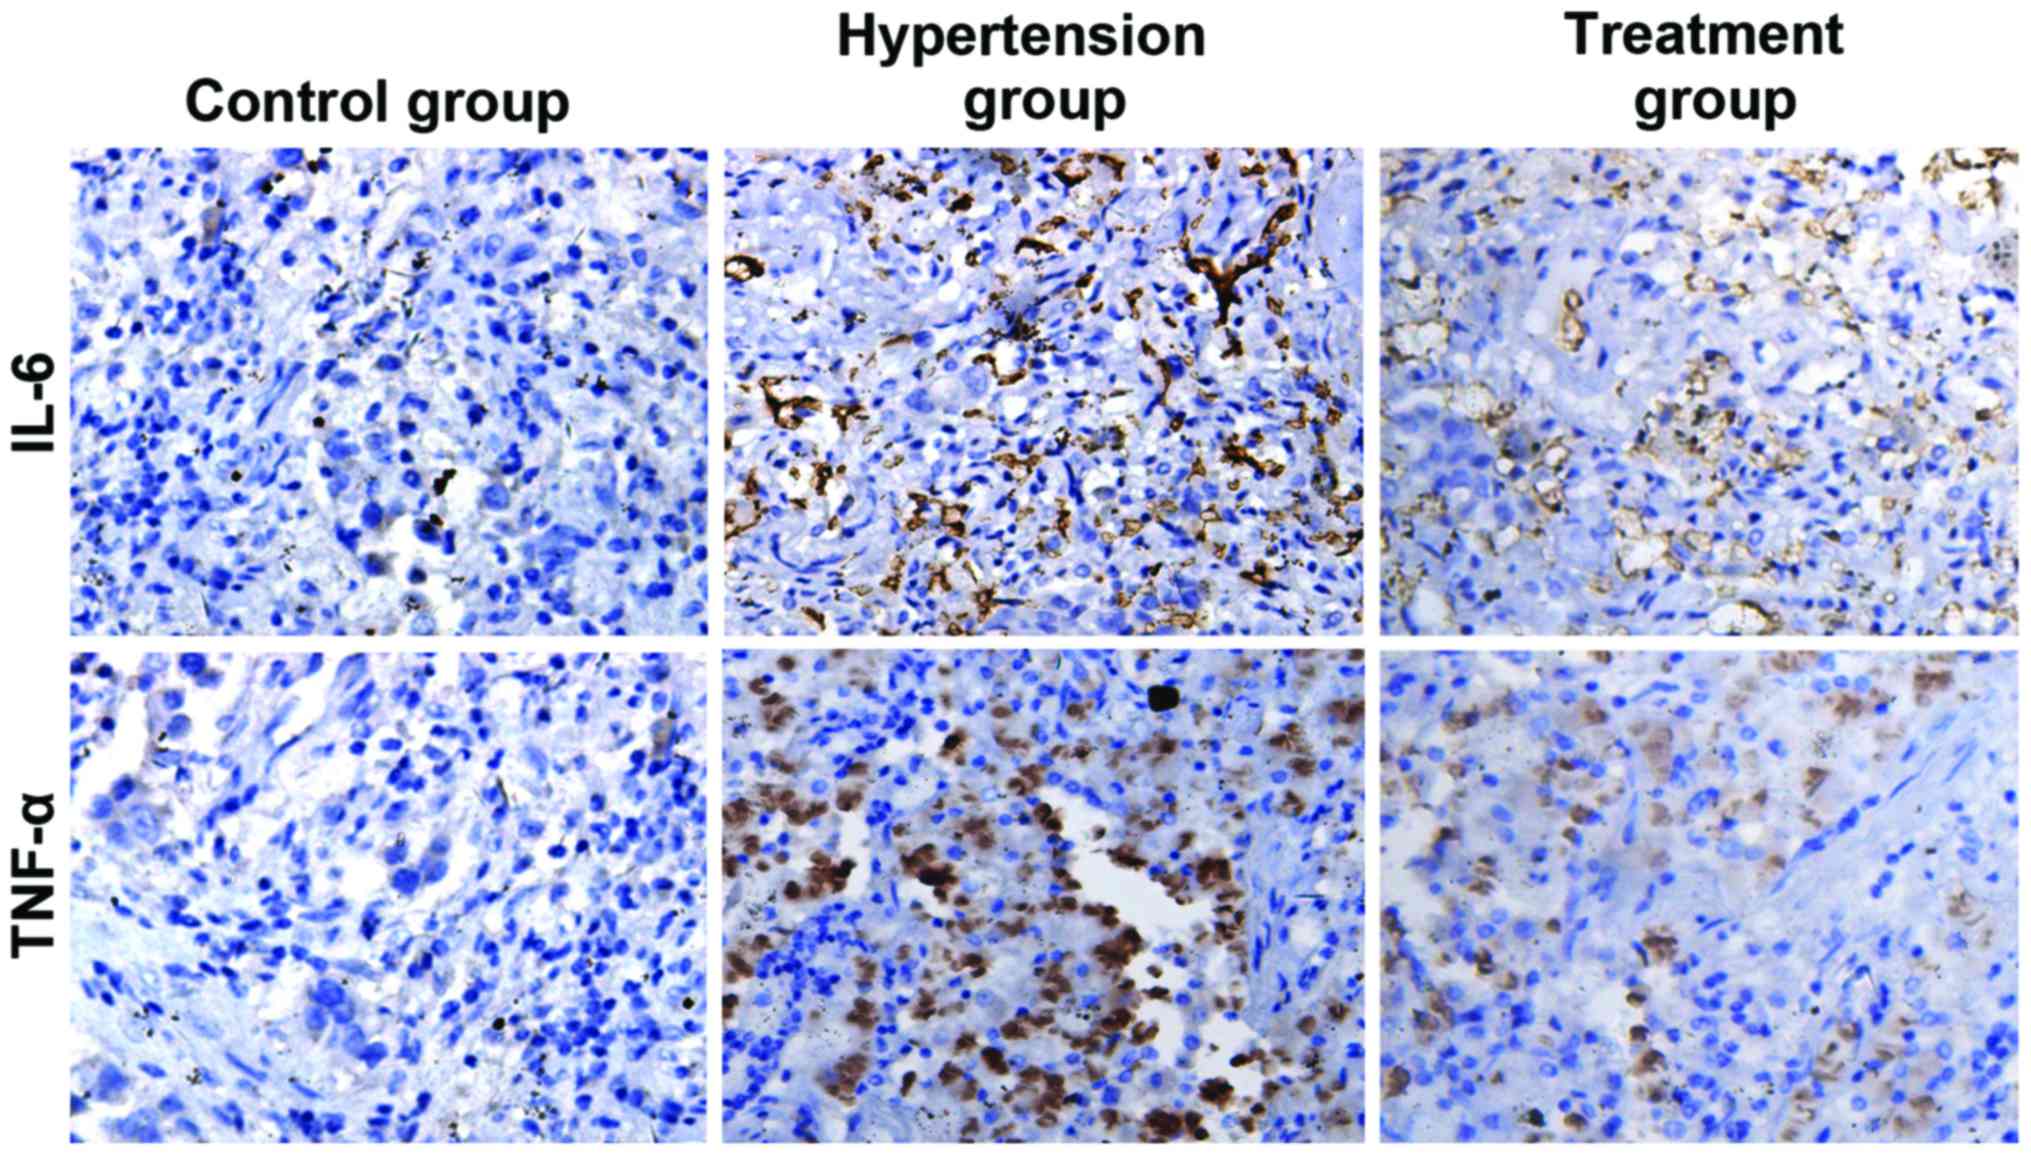
Detection of the expression levels of
IL-6 and TNF-α in placenta tissues by immunohistochemistry
Placenta tissues were isolated, fixed and embedded
in paraffin. Slices were used to detect the expression levels of
IL-6 and TNF-α in placental tissues using immunohistochemistry. As
shown in Fig. 3 and Table II, IL-6 and TNF-α were negatively
expressed in the control group but positively expressed in the
hypertension group at a high degree, and the expression levels of
IL-6 and TNF-α in the hypertension group were significantly higher
than those in the control group (P<0.05). IL-6 and TNF-α were
positively expressed in the treatment group at a low degree, and
the expression levels of IL-6 and TNF-α in the treatment group were
significantly lower than those in the hypertension group
(P<0.05).
| Table II.Comparison of the optical density
values of IL-6 and TNF-α in placenta tissues among the three
groups. |
Table II.
Comparison of the optical density
values of IL-6 and TNF-α in placenta tissues among the three
groups.
| Target | Control group | Hypertension
group | Treatment group |
|---|
| IL-6 | 35.6±12.8 |
282.1±57.5a | 66.33b |
| TNF-α | 39.9±13.1 |
346.5±49.6a | 56.28b |
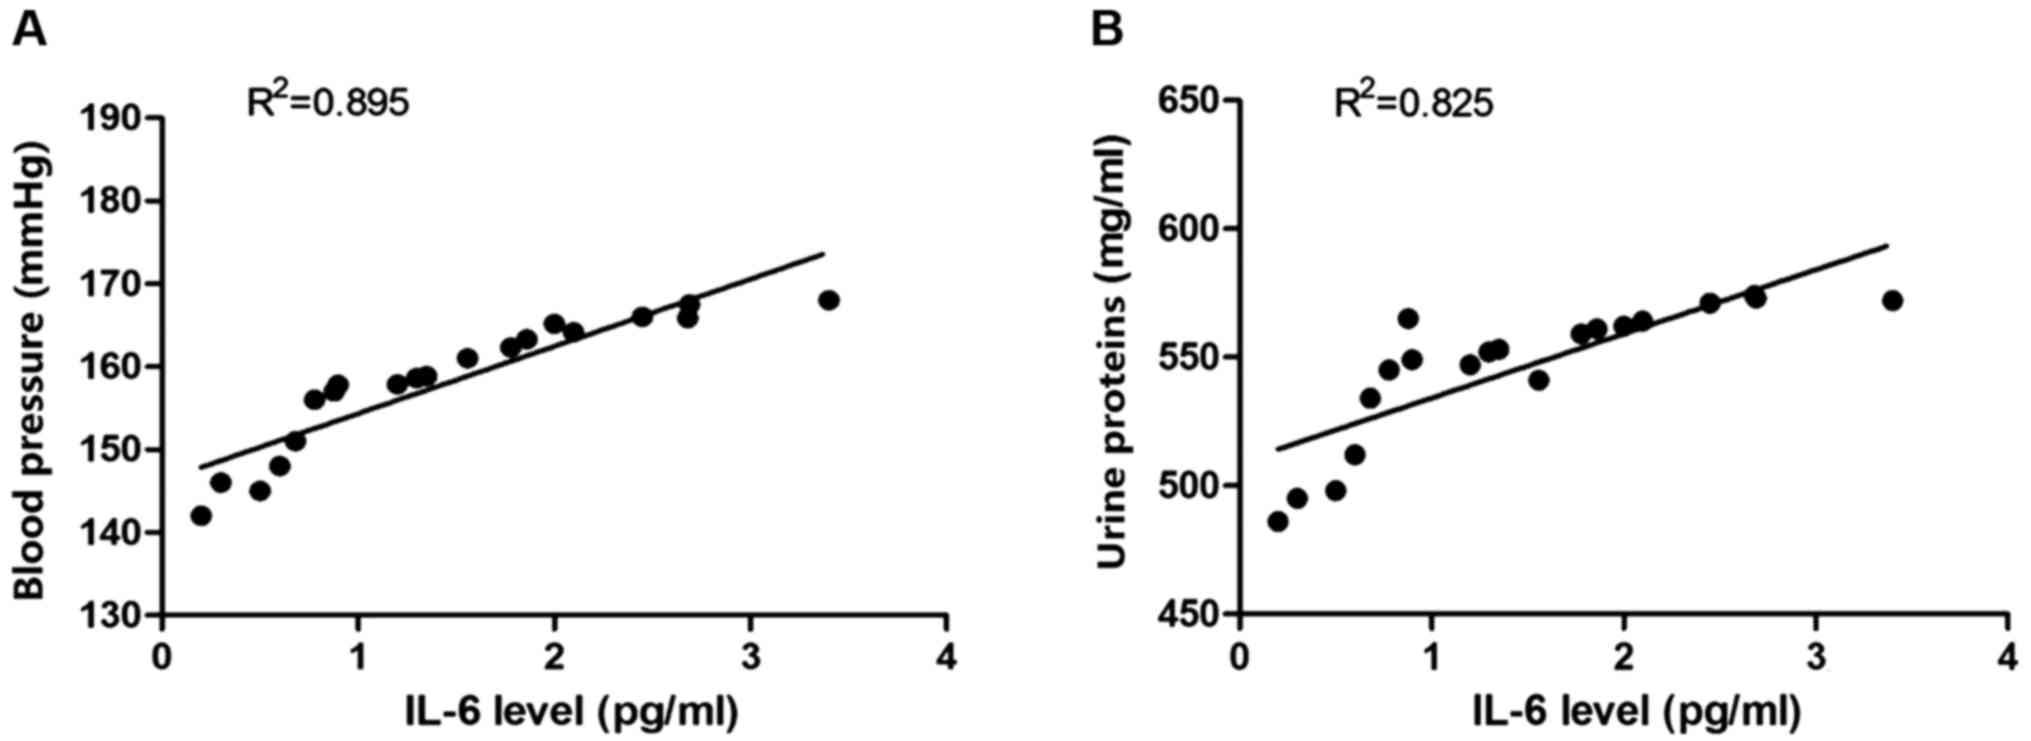
Correlation analyses of IL-6 level in
placenta tissues with blood pressure and urine proteins
Placental proteins were extracted, and the
expression level of IL-6 proteins was detected. The correlation
analysis of the expression level of IL-6 with the corresponding
blood pressure of rats was conducted. Pearson's correlation
analysis was used to analyze the correlation between IL-6 and blood
pressure, and between IL-6 level and urine proteins. Results showed
that the IL-6 protein level was positively correlated with blood
pressure and urine proteins (Fig.
4).
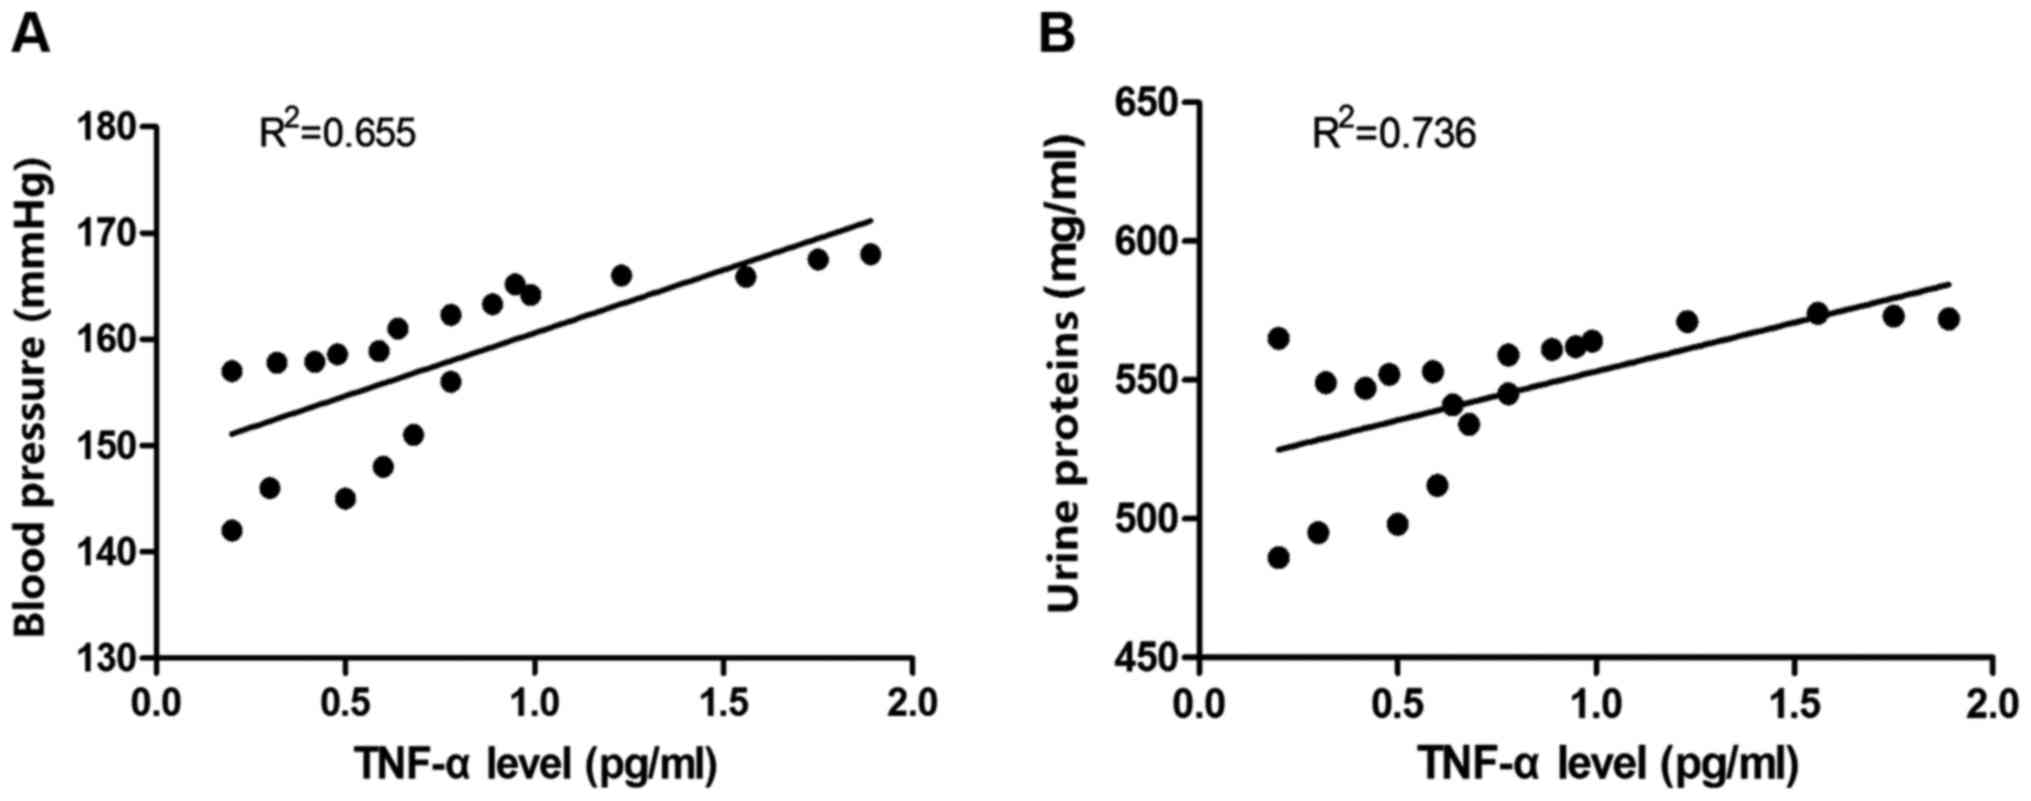
Correlation analysis of TNF-α level in
placenta tissues with blood pressure and urine proteins
Placental proteins were extracted, and the
expression level of TNF-α proteins was detected. The correlation
analysis of the expression level of TNF-α with the corresponding
blood pressure of rats was conducted. Pearson's correlation
analysis was used to analyze the correlation between TNF-α and
blood pressure, and between TNF-α level and urine proteins. Results
revealed that the TNF-α protein level was positively correlated
with blood pressure and urine proteins (Fig. 5).
Discussion
Hypoxia induction method was used to establish the
model of PIH in this study, and the expression levels of blood
pressure, urine proteins and inflammatory cytokines in placenta
tissues were further measured in order to analyze the correlation
of the expression of inflammatory cytokines in placenta tissue with
blood pressure and urine proteins. The main purpose of this study
was to provide a scientific basis and a new study perspective for
the prevention of PIH in the first trimester of pregnancy.
PIH, especially preeclampsia (PE), is considered a
multifactorial disease. There are many theories about PIH
pathogenesis, and their common feature is that the placenta plays a
key role (11). The ‘two-stage
model’ theory holds that placental implantation, vascularization or
dysfunction and the role of maternal factors can lead to PIH
(12). Factors associated with PIH
pathophysiology include cardiovascular adaptations and
vasoconstriction, genetic predisposition, poor immune tolerance of
the placenta to maternal tissues, platelet activation and vascular
endothelial dysfunction (13). In
addition, a study has shown that the co-existing PIH metabolic
disorders can lead to endothelial dysfunction, hyperlipidemia and
insulin resistance, which are associated with PIH (14). Sgambati et al found that
compared with those with normal pregnancy, the reduction of the
level of the angiogenic factor [vascular endothelial growth factor
(VEGF)] in umbilical cord blood of patients with PIH is inhibited,
and the ratio of angiopoietin 1/pro-angiogenin 2 is significantly
reduced (15). Abnormalities in
immune factors such as autoantibodies, oxidative stress and natural
killer (NK) cells can lead to placental dysfunction and impaired
placental perfusion. The latter, as a stimulus for the placenta
releasing anti-angiogenesis and inflammatory mediators, will
eventually lead to endothelial dysfunction and organ damage
(16). The increased numbers of
activated monocytes and macrophages in the endometrium of PIH
patients and the increased production of antioxidants, redox
factors and reactive oxygen species (ROS) lead to vascular
endothelial dysfunction in PIH patients (17). A study has shown that NK cell
function of patients with early-onset severe preeclampsia is
associated with the production of cytokines (18).
According to clinical reports, the possible
pathogeneses of PIH patients include the excessive inflammation
reactions of the matrix on the uterine placenta, a large amount of
cytokines released by the placenta, and the production of various
inflammatory cytokines such as TNF-α and IL-6 in immunoactivated
endothelial cells and lymphocytes in blood circulation, which
promote various immune responses. Endothelial cells interact with
inflammatory cells in the body and promote the development of
hypertension during pregnancy (19,20).
In this study, hypoxia-induced PIH model was applied
to measure blood pressure and the concentration of 24 h urine
proteins in each group on day 15, 18 and 21 of pregnancy,
respectively. On day 21 of pregnancy, the experiment was
terminated, the placenta was taken, the mRNA and protein expression
levels of IL-6 and TNF-α were measured, respectively, and the
expression level of tissues was detected by immunohistochemistry.
Compared with those in the control group, the expression levels of
IL-6 and TNF-α in the PIH group were significantly increased, and
immunohistochemistry results revealed that the expression levels of
IL-6 and TNF-α were also significantly increased, proving that
inflammatory cytokines, IL-6 and TNF-α are positively correlated
with blood pressure and the concentration of urine proteins.
Acknowledgements
Not applicable.
Funding
No funding was recieved.
Availability of data and materials
The datasets used and/or analyzed during the current
study are available from the corresponding author on reasonable
request.
Authors' contributions
XQJ and SX established PIH rat models. MRT performed
PCR. YYM was responsible for western blot analysis and
immunohistochemistry. All authors read and approved the final
manuscript.
Ethics approval and consent to
participate
The study was approved by the Ethics Committee of
Qilu Hospital of Shandong University (Jinan, China).
Patient consent for publication
Not applicable.
Competing interests
The authors declare that they have no competing
interests.
References
|
1
|
Sibai BM: Diagnosis and management of
gestational hypertension and preeclampsia. Obstet Gynecol.
102:181–192. 2003. View Article : Google Scholar : PubMed/NCBI
|
|
2
|
Buchbinder A, Sibai BM, Caritis S,
Macpherson C, Hauth J, Lindheimer MD, Klebanoff M, Vandorsten P,
Landon M, Paul R, et al: National Institute of Child Health and
Human Development Network of Maternal-Fetal Medicine Units: Adverse
perinatal outcomes are significantly higher in severe gestational
hypertension than in mild preeclampsia. Am J Obstet Gynecol.
186:66–71. 2002. View Article : Google Scholar : PubMed/NCBI
|
|
3
|
Barton JR, O'brien JM, Bergauer NK,
Jacques DL and Sibai BM: Mild gestational hypertension remote from
term: Progression and outcome. Am J Obstet Gynecol. 184:979–983.
2001. View Article : Google Scholar : PubMed/NCBI
|
|
4
|
Salonen Ros H, Lichtenstein P, Lipworth L
and Cnattingius S: Genetic effects on the liability of developing
pre-eclampsia and gestational hypertension. Am J Med Genet.
91:256–260. 2000. View Article : Google Scholar : PubMed/NCBI
|
|
5
|
Naeye RL and Friedman EA: Causes of
perinatal death associated with gestational hypertension and
proteinuria. Am J Obstet Gynecol. 133:8–10. 1979. View Article : Google Scholar : PubMed/NCBI
|
|
6
|
Koopmans CM, Bijlenga D, Groen H, Vijgen
SM, Aarnoudse JG, Bekedam DJ, van den Berg PP, de Boer K,
Burggraaff JM, Bloemenkamp KW, et al HYPITAT study group, :
Induction of labour versus expectant monitoring for gestational
hypertension or mild pre-eclampsia after 36 weeks' gestation
(HYPITAT): A multicentre, open-label randomised controlled trial.
Lancet. 374:979–988. 2009. View Article : Google Scholar : PubMed/NCBI
|
|
7
|
Ros HS, Cnattingius S and Lipworth L:
Comparison of risk factors for preeclampsia and gestational
hypertension in a population-based cohort study. Am J Epidemiol.
147:1062–1070. 1998. View Article : Google Scholar : PubMed/NCBI
|
|
8
|
Hermida RC, Ayala DE, Mojón A, Fernández
JR, Alonso I, Silva I, Ucieda R and Iglesias M: Blood pressure
patterns in normal pregnancy, gestational hypertension, and
preeclampsia. Hypertension. 36:149–158. 2000. View Article : Google Scholar : PubMed/NCBI
|
|
9
|
Vambergue A, Nuttens MC, Goeusse P,
Biausque S, Lepeut M and Fontaine P: Pregnancy induced hypertension
in women with gestational carbohydrate intolerance: The diagest
study. Eur J Obstet Gynecol Reprod Biol. 102:31–35. 2002.
View Article : Google Scholar : PubMed/NCBI
|
|
10
|
Redman CWG and Sargent IL: Pre-eclampsia,
the placenta and the maternal systemic inflammatory response - A
review. Placenta. 24 Suppl A:S21–S27. 2003. View Article : Google Scholar : PubMed/NCBI
|
|
11
|
Roberts JM and Redman CWG: Pre-eclampsia:
More than pregnancy-induced hypertension. Lancet. 341:1447–1451.
1993. View Article : Google Scholar : PubMed/NCBI
|
|
12
|
Majumdar S, Dasguptha H, Bhattacharya K
and Bhattacharya A: A study of placenta in normal and hypertensive
pregnancies. J Anat Soc India. 54:1–9. 2005.http://medind.nic.in/jae/t05/i2/jaet05i2p34.pdf
|
|
13
|
Xiong X, Demianczuk NN, Saunders LD, Wang
FL and Fraser WD: Impact of preeclampsia and gestational
hypertension on birth weight by gestational age. Am J Epidemiol.
155:203–209. 2002. View Article : Google Scholar : PubMed/NCBI
|
|
14
|
Seely EW and Solomon CG: Insulin
resistance and its potential role in pregnancy-induced
hypertension. J Clin Endocrinol Metab. 88:2393–2398. 2003.
View Article : Google Scholar : PubMed/NCBI
|
|
15
|
Sgambati E, Marini M, Zappoli Thyrion GD,
Parretti E, Mello G, Orlando C, Simi L, Tricarico C, Gheri G and
Brizzi E: VEGF expression in the placenta from pregnancies
complicated by hypertensive disorders. BJOG. 111:564–570. 2004.
View Article : Google Scholar : PubMed/NCBI
|
|
16
|
Peraçoli JC, Rudge MVC and Peraçoli MTS:
Tumor necrosis factor-alpha in gestation and puerperium of women
with gestational hypertension and pre-eclampsia. Am J Reprod
Immunol. 57:177–185. 2007. View Article : Google Scholar : PubMed/NCBI
|
|
17
|
LaMarca BD, Ryan MJ, Gilbert JS, Murphy SR
and Granger JP: Inflammatory cytokines in the pathophysiology of
hypertension during preeclampsia. Curr Hypertens Rep. 9:480–485.
2007. View Article : Google Scholar : PubMed/NCBI
|
|
18
|
Sargent IL, Borzychowski AM and Redman
CWG: NK cells and human pregnancy - An inflammatory view. Trends
Immunol. 27:399–404. 2006. View Article : Google Scholar : PubMed/NCBI
|
|
19
|
Hermida RC, Ayala DE, Mojón A, Fernández
JR, Silva I, Ucieda R and Iglesias M: Blood pressure excess for the
early identification of gestational hypertension and preeclampsia.
Hypertension. 31:83–89. 1998. View Article : Google Scholar : PubMed/NCBI
|
|
20
|
Borzychowski AM, Sargent IL and Redman
CWG: Inflammation and pre-eclampsiaSeminars in Fetal and Neonatal
Medicine. 11. WB Saunders; Philadelphia: pp. 309–316. 2006,
View Article : Google Scholar : PubMed/NCBI
|