Introduction
Hepatitis B virus (HBV) infection is a worldwide
health problem that affects >0.35 billion individuals globally
(1). Patients with chronic hepatitis
B infection (CHB) have an increased risk of progressive end-stage
liver disease, including liver cirrhosis and hepatocellular
carcinoma (HCC). Anti-viral therapy may effectively inhibit HBV
replication, alleviate the disease and ultimately prevent disease
progression (2).
The recommended treatment guidelines proposed by the
American Association for the Study of Liver Diseases (2), the European Association for the Study
of the Liver (3) and the Asian
Pacific Association for the Study of the Liver (4) all indicate that CHB patients with a
Knodell histology activity index of ≥4 or moderate/severe
necroinflammation [Scheuer grade (G) ≥2] and fibrosis (grade S ≥2)
require anti-viral therapy. Liver biopsy (LB), the golden standard
for evaluating liver pathology (4),
has certain limitations owing to inter- and intra-observer
variability, its invasive nature, pain, sampling errors and
non-dynamic assessment of liver histopathology. FibroScan (5,6) and
serum non-invasive biomarkers, including aspartate aminotransferase
(AST) to platelet (PLT) ratio index (7) and Fibrosis-4 [based on age, alanine
transaminase (ALT), AST and PLT] (8), have been reported to have high
diagnostic accuracy in identifying liver fibrosis and cirrhosis.
However, these biomarkers were less useful in diagnosing liver
necroinflammation, and no non-invasive biomarker for predicting
liver necroinflammation has been recommended by recent guidelines.
Thus, additional novel non-invasive biomarkers to assess liver
necroinflammation and initiation of anti-viral therapy are urgently
required.
Circulating microRNAs (miRs), including miR-122
(9,10), miR-124 (11) and miR-125b (12), as well as intracellular HBV
covalently closed circular DNA (13), quantitative hepatitis B core antibody
(14), the PIPS index (based on
phosphatidylserine and phosphatidylinositol) (15) and inflammatory activity scoring
models (16), were reported to be
significant predictors for liver necroinflammation in chronic HBV
patients. However, several of these biomarkers are difficult to
determine in clinical practice, particularly in resource-limited
settings, and it has remained elusive whether they are able to
independently predict liver necroinflammation in CHB patients with
ALT ≤2 times the upper limit of normal (ULN). The aim of the
present study was to develop and validate a simple model based on
routine blood indexes for predicting significant liver
necroinflammation according to a modified Scheuer scoring system
(17) in CHB patients with ALT ≤2
ULN. The indexes established may be used to determine whether
anti-viral treatment should be initiated and may spare certain
patients from unnecessary liver biopsy, particularly in developing
countries.
Patients and methods
Patients
A retrospective study was performed on a set of CHB
patients from Shanghai between January 2006 and September 2016 who
presented at the Department of Infectious Diseases of Huashan
Hospital, Fudan University (Shanghai, China). Another retrospective
independent study of consecutive CHB patients from the First
Hospital of Quanzhou, Fujian Medical University (Quanzhou, China)
who underwent LB between October 2005 and August 2015 was selected
with the same inclusion and exclusion criteria (18), which were as follows: (1) All CHB patients were positive for
hepatitis B surface antigen (HBsAg) for >6 months (19); (2)
Patients with any other types of viral hepatitis (HAV, HCV or HDV)
or human immunodeficiency virus infection, drug-induced hepatitis,
autoimmune hepatitis, decompensated cirrhosis, primary biliary
cirrhosis, non-alcoholic steatohepatitis and Wilson's disease were
excluded; (3) None of the patients
had thyroid disease, heart disease or kidney disease. The
demographics and laboratory parameters were recorded within 1 week
prior to LB. Written informed consent was obtained from each
patient prior to LB and all trials were approved by the Ethics
Committees of Huashan Hospital, Fudan University (Shanghai, China)
and the First Hospital of Quanzhou, Fujian Medical University
(Quanzhou, China).
Data collection
The Patients' demographic data and results of
laboratory tests were recorded within 7 days following LB,
including age, gender, white blood cell count (WBC), granulocyte
ratio (GR), red blood cell count (RBC), hemoglobin (Hgb), platelet
count (PLT), prothrombin time (PT) and international normalized
ratio (INR). Serum albumin (ALB), globulin (GLB), total bilirubin
(TBil), ALT, aspartate aminotransferase (AST), alkaline phosphatase
(ALP) and γ-glutamyl transpeptidase (GGT) were detected using an
automatic biochemical analyzer (Hitachi 7600P; Hitachi, Tokyo,
Japan) for the Shanghai set and an automatic biochemical analyzer
(Beckman LX-20; Beckman Coulter, Brea, CA) for the Quanzhou set.
HBsAg, anti-HBs, hepatitis B e antigen (HBeAg), anti-HBe, anti-HBc,
anti-HAV and anti-HCV were determined by an Architect QT assay
(Architect i2000 SR; Abbott Core Laboratory, Lake Forest, IL, USA)
for the Shanghai and Quanzhou sets. Serum HBV DNA was determined
using a commercial Real-time polymerase chain reaction (PCR) kit on
a Light Cycler 480 Real-time PCR system (Roche Diagnostics, Basel,
Switzerland) for the Shanghai set and on a PE 9700 Thermal Cycler
(Perkin Elmer, Inc., Waltham, MA, USA) for the Quanzhou set in
accordance with the manufacturer's protocols. An ALT level of ≤40
U/l or 80 U/l in the experimental assessment and validation cohort
were defined as ALT ≤1 ULN or ≤2 ULN, respectively.
Liver biopsy
Percutaneous LB under ultrasound guidance was
performed using 16 G needles (MAX-CORE® MC1616;
BARD® Peripheral Vascular, Inc., Tempe, AZ, USA) for the
Shanghai set and disposable needles (Manan Super-Core; Medical
Device Technologies Co., Ltd, Gainesville, FL, USA) for the
Quanzhou set. The mean number of portal tracts was 10 (range, 8–18)
and samples with a length of >1.5 cm were obtained for diagnosis
(range, 1.7–3.6 cm). The specimens were formalin-fixed,
paraffin-embedded and H&E stained for histological analysis.
The histological grading for liver necroinflammation (G0-G4) was
performed according to Scheuer's scoring system (17) by specialized pathologists.
Moderate/severe necroinflammation was considered if G≥2.
Statistical analysis
The data were analyzed using SPSS 22.0 (IBM Corp.,
Armonk, NY, USA). Continuous variables were expressed as the median
and interquartile range and compared using the Mann-Whitney U-test.
Categorical variables were compared using the chi-square test.
Correlations were analyzed by calculating Spearman's rank
correlation coefficient. A multiple logistic regression analysis
was performed for all the factors significantly associated with
liver necroinflammatory activity on univariate analyses, and a new
predictive model was selected using stepwise-forward logistic
regression. The diagnostic efficacy was evaluated by drawing the
receiver operating characteristic (ROC) curve and determining the
area under the curve (AUC), and the diagnostic accuracy was
evaluated by determining the sensitivity, specificity, positive
predictive value (PPV) and negative predictive value (NPV).
P<0.05 was considered to indicate a statistically significant
difference.
Results
Patient characteristics
A total of 740 patients with chronic HBV infection
from Huashan Hospital (Shanghai, China; n=330) and the First
Hospital of Quanzhou (Quanzhou, China; n=410) who had undergone LB
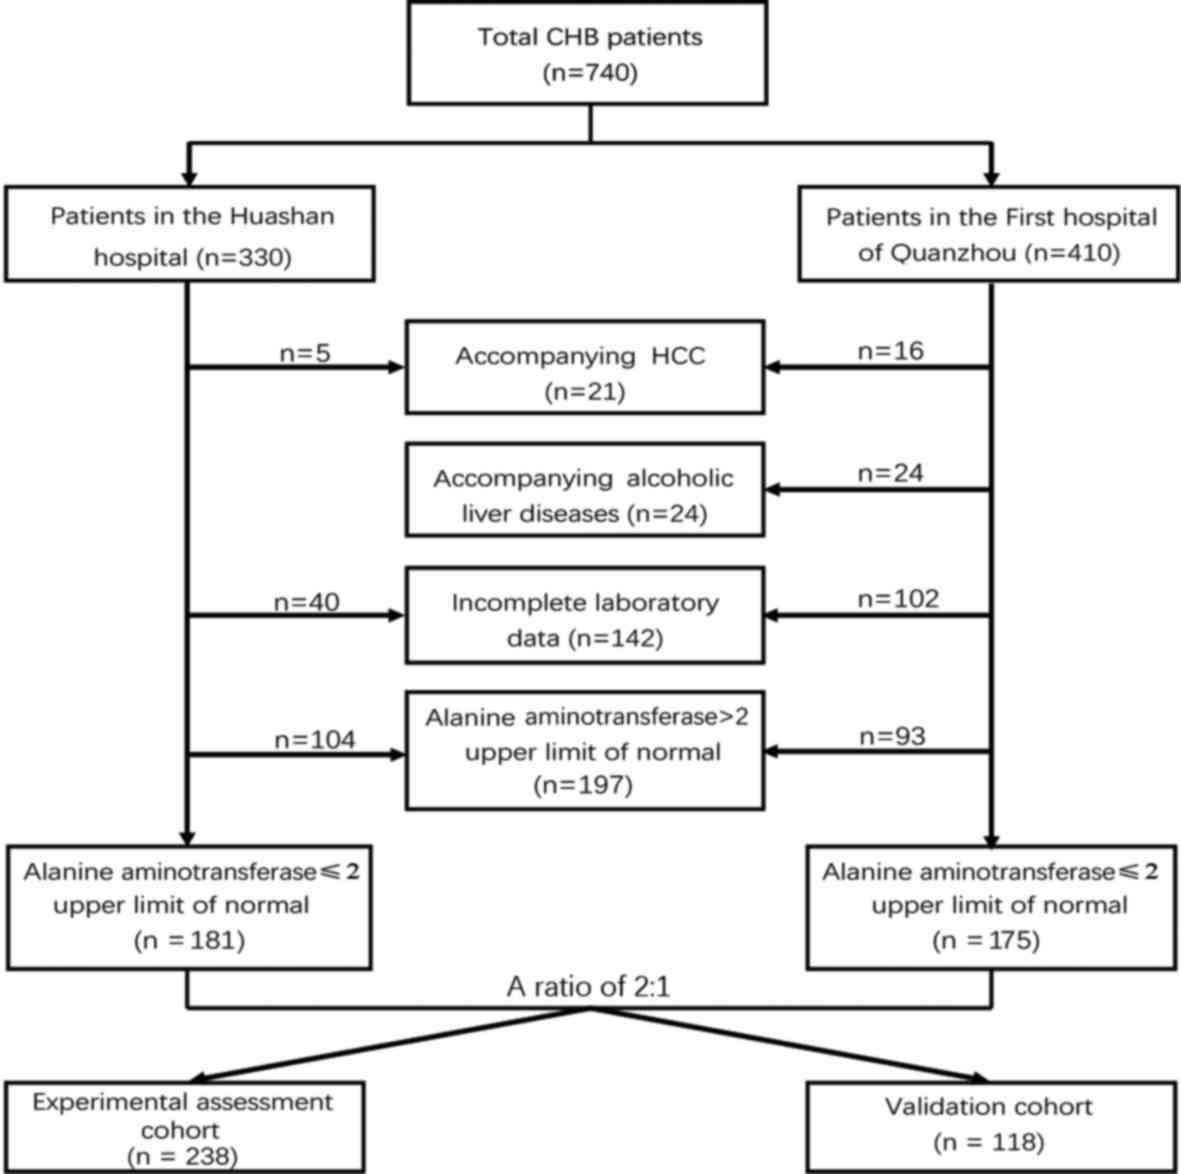
were enrolled in the present study. As presented in Fig. 1, a total of 149 patients from Huashan
Hospital were excluded owing to accompanying HCC (n=5),
insufficient laboratory data (n=40) and elevated ALT levels (ALT ≥2
ULN; n=104). Similarly, 235 subjects from the First Hospital of
Quanzhou were excluded due to HCC (n=16) and alcoholic liver
disease (n=24), incomplete laboratory data (n=102) and elevated ALT
levels (n=93). The final study population, consisting of 356
patients, was randomly divided into an experimental assessment
cohort (n=238) and a validation cohort (n=118) at a ratio of
2:1.
The baseline characteristics of all CHB patients in
the experimental assessmentand validation cohorts are presented in
Table I. The two cohorts were well
matched in terms of their baseline characteristics. The stages of
liver necroinflammation were also similar between the two cohorts
(Table I).
 | Table I.Baseline characteristics of the study
population in the experimental assessment set and in validation
set. |
Table I.
Baseline characteristics of the study
population in the experimental assessment set and in validation
set.
| Variable | Normal ranges | Experimental
assessment cohort (n=238) | Validation cohort
(n=118) | P-value |
|---|
| Male sex | – | 166 (69.70) | 60 (50.80) | <0.001 |
| Age (years) | – | 34.00
(26.00–41.25) | 32.50
(27.00–40.00) | 0.856 |
| ALB (g/l) | 40–55 | 42.90
(36.80–46.00) | 42.00
(34.25–45.05) | 0.312 |
| GLB (g/l) | 20–40 | 31.90
(28.08–36.38) | 31.60
(29.00–37.95) | 0.491 |
| TBil (µmol/l) | 3.4–39.7 | 13.90
(10.70–19.60) | 13.85
(9.48–18.80) | 0.448 |
| ALT (IU/l) | 9–40 | 37.00
(26.00–52.00) | 38.00
(26.75–3.25) | 0.701 |
| AST (IU/l) | 15–40 | 29.00
(23.25–37.75) | 28.00
(22.75–35.00) | 0.178 |
| GGT (IU/l) | 10–60 | 18.00
(13.00–34.50) | 19.50
(13.00–30.75) | 0.852 |
| ALP (IU/l) | 45–125 | 69.00
(56.00–85.00) | 73.00
(59.50–85.00) | 0.172 |
| PT (sec) | 10.7–13.1 | 11.80
(11.10–12.40) | 11.50
(10.90–12.10) | 0.052 |
| INR | 0.92–1.15 | 1.03
(0.99–1.08) | 1.04
(0.97–1.09) | 0.742 |
| WBC
(109/l) | 3.5–9.5 | 5.70
(4.82–6.98) | 5.74
(4.90–6.90) | 0.736 |
| GR (%) | 40–75 | 58.71
(51.80–64.65) | 60.10
(52.35–66.15) | 0.313 |
| Lym (%) | 20–50 | 32.50
(26.45–38.40) | 32.20
(24.60–36.00) | 0.080 |
| RBC
(1012/l) | 4.3–5.8 | 4.80
(4.44–5.17) | 4.92
(4.37–5.21) | 0.572 |
| Hgb (g/l) | 130–175 | 146.00
(134.00–157.00) | 151.00
(136.00–159.00) | 0.153 |
| PLT
(109/l) | 125–350 | 196.00
(165.25–232.75) | 202.00
(164.50–238.00) | 0.613 |
|
HBeAg+ | 0–1 | 150 (63.0) | 90 (76.3) | 0.012 |
| HBV DNA (lg
IU/ml) | 2.74–9 | 4.72
(3.70–7.07) | 6.36
(3.76–8.07) | 0.055 |
| Necroinflammation
stagea |
|
|
|
|
| G0 |
| 44 (18.5) | 18 (15.3) |
|
| G1 |
| 75 (31.5) | 33 (28.0) |
|
| G2 |
| 70 (29.4) | 45 (38.1) |
|
| G3 |
| 27 (11.3) | 18 (15.3) |
|
| G4 |
| 22 (9.2) | 4 (3.4) | 0.120 |
|
≥G2 |
| 118 (49.6) | 67 (56.8) | 0.201 |
Predictors and regression models
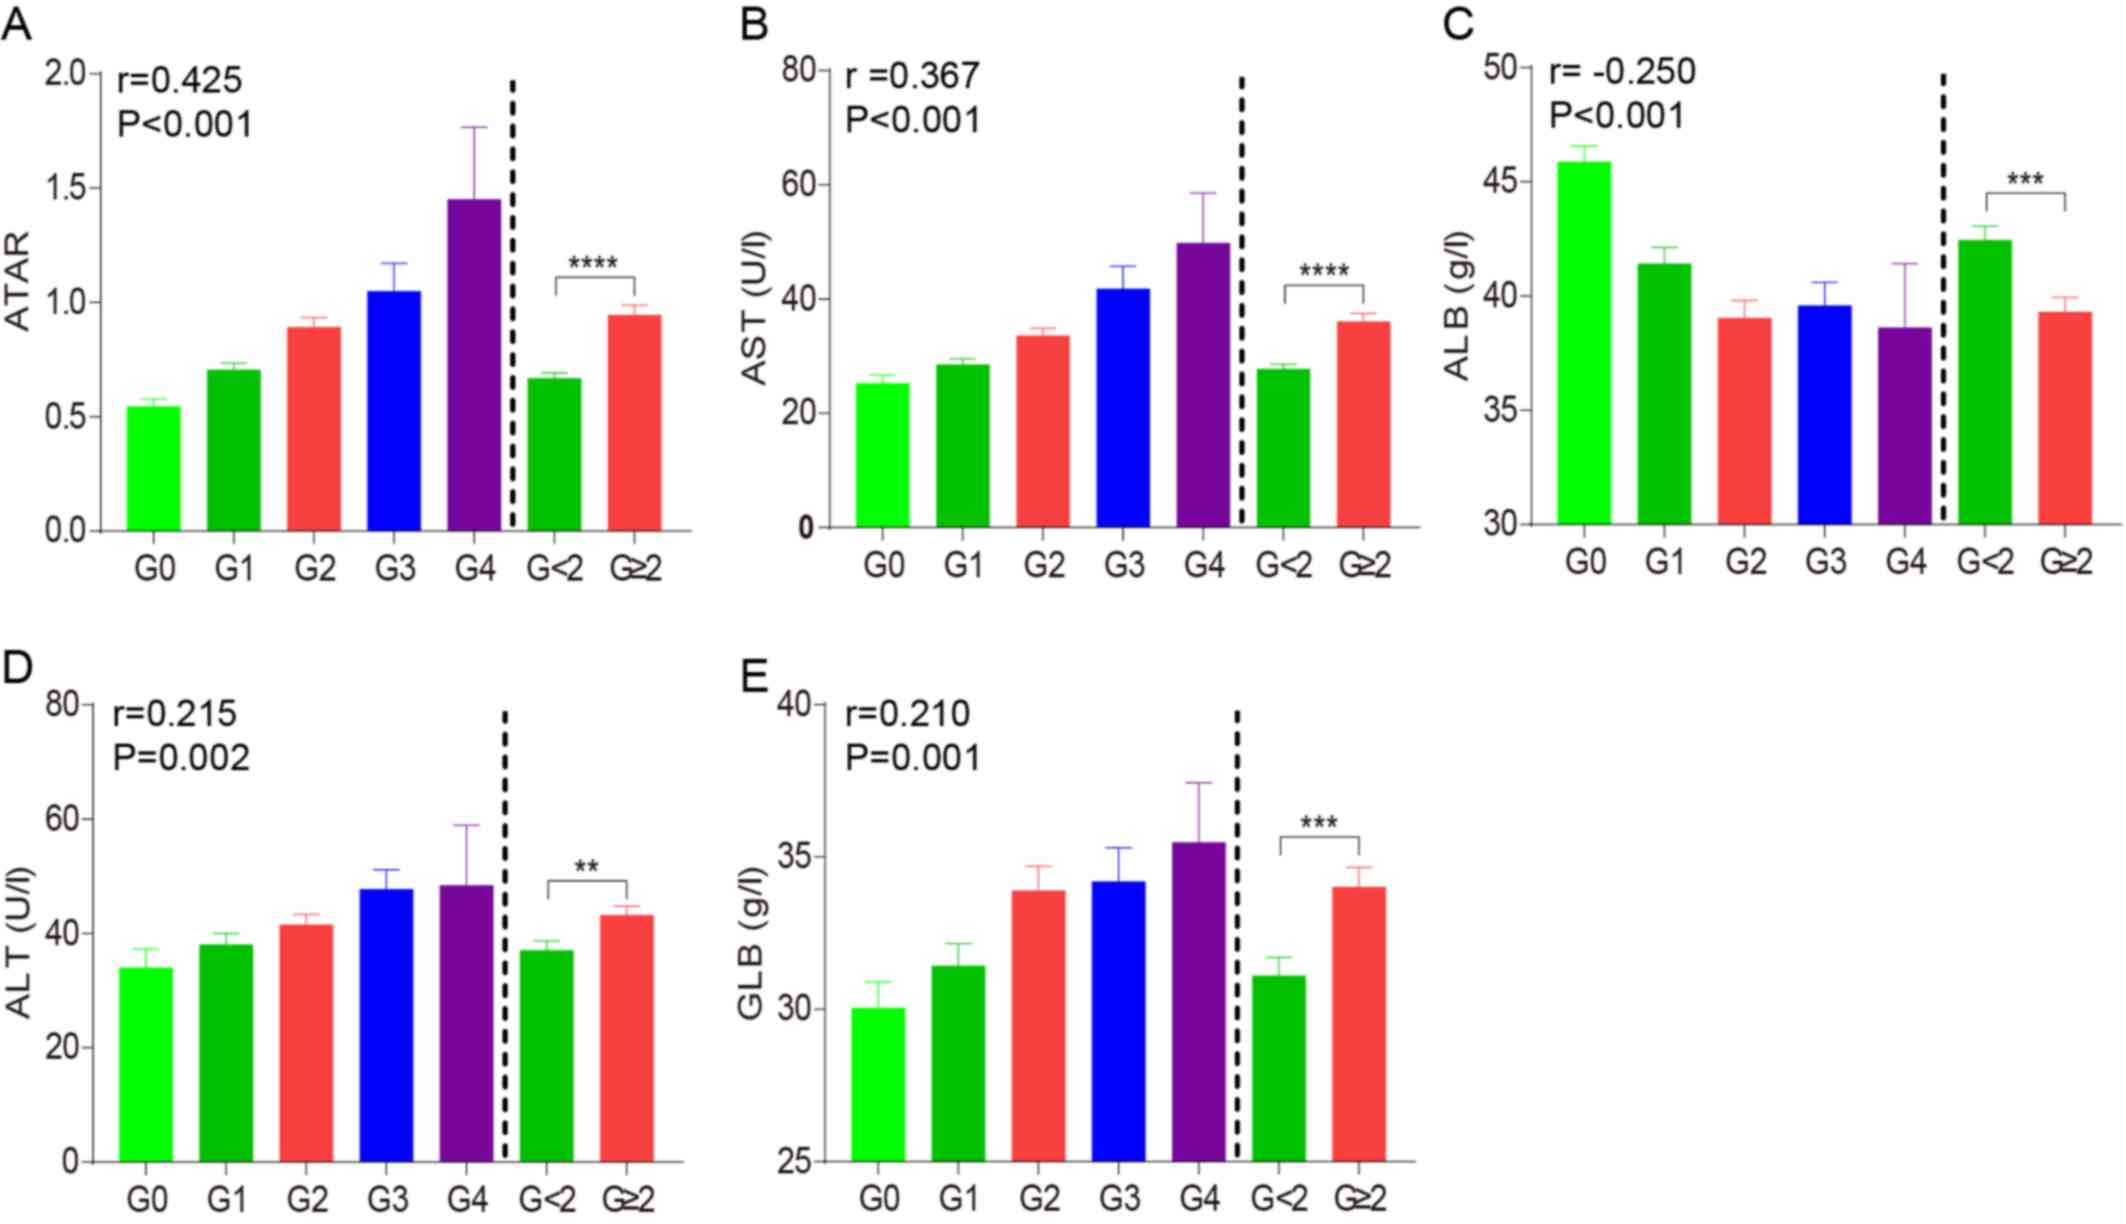
In the experimental assessment cohort, ALB, GLB, ALT
and AST were significantly different between moderate/severe liver
necroinflammation groups (G≥2) and mild liver necroinflammation
groups (G<2) (Fig. 2), and
univariate analysis revealed that ALB (P=0.005), GLB (P=0.002), ALT
(P=0.010) and AST (P<0.001) were predictive factors of G≥2.
(Table II). However, no differences
were observed for the other indicators (P>0.05). The
step-forward multiple regression analysis revealed that only AST
(P<0.001) and ALB (P=0.002) were independently correlated with
G≥2. AST (r=0.367, P<0.001) was positively associated with liver
necroinflammation, while the ALB (r=−0.250, P<0.001) was
negatively correlated with liver necroinflammation. To improve the
prediction of significant liver necroinflammation, a final multiple
regression model incorporating AST and ALB was developed: The AST
(U/l)/ALB (g/l) ratio (ATAR). This proposed ATAR value
progressively increased with ascending liver necroinflammation
stage, with a higher correlation coefficient than AST or ALB alone
(r=0.425, P<0.001; Fig. 2A-C).
The median ATAR in the G≥2 group was obviously higher than that in
the G<2 group (0.95 vs. 0.67, P<0.001; Fig. 2A). Therefore, the new ATAR model
based on AST and ALB levels is a good independent indicator for
reflecting the degree of liver necroinflammation.
| Table II.Univariate and multivariate analyses
of the association between biomarkers and liver inflammation. |
Table II.
Univariate and multivariate analyses
of the association between biomarkers and liver inflammation.
|
| Univariate
analysis | Multivariate
analysis |
|---|
|
|
|
|
|---|
| Variable | OR (95% CI) | P-value | OR (95% CI) | P-value |
|---|
| ALB | 0.940
(0.901–0.981) | 0.005 | 0.098
(0.885–0.972) | 0.002 |
| GLB | 1.072
(1.025–1.121) | 0.002 |
|
|
| ALT | 1.020
(1.005–1.035) | 0.010 |
|
|
| AST | 1.068
(1.038–1.099) | <0.001 | 1.006
(1.033–1.101) | <0.001 |
ATAR has an improved predictive value
for G≥2 over that of other markers in patients with CHB with ALT ≤2
ULN
In the experimental assessment cohort (n=238), the
distribution of histopathological stages of liver necroinflammation
was as follows: G0, 44 (18.5%); G1, 75 (31.5%); G2, 70 (29.4%); G3,
27 (11.3%); and G4, 22 (9.2%; Table
I). Except for ALB, the ATAR and GLB, ALT and AST increased
with increasing liver necroinflammation stage. For the prediction
of G≥2, the AUC for ATAR (0.721, 95% CI: 0.656–0.780) was markedly
larger than that for ALB (0.632, 95% CI: 0.563–0.696; P=0.039 vs.
ATAR), GLB (0.633, 95% CI: 0.564–0.697; P=0.029 vs. ATAR) and ALT
(0.602, 95% CI: 0.537–0.665; P=0.001 vs. ATAR), but only slightly
larger than that for AST (0.682, 95% CI: 0.619–0.741; P=0.082 vs.
ATAR; Table III). Furthermore,
ATAR demonstrates the best sensitivity (71.19%) for predicting G≥2
than ALB (46.61%), GLB (41.18%), ALT (56.72%) and AST (60.61%). The
best cut off values were as follows: 0.707 for ATAR, 39.9 for ALB,
35 for GLB, 38 for ALT and 29 for AST.
| Table III.Diagnostic accuracy of various
indices in patients with ALT ≤2 ULN or ALT ≤1 ULN. |
Table III.
Diagnostic accuracy of various
indices in patients with ALT ≤2 ULN or ALT ≤1 ULN.
|
| ALT ≤2 ULN | ALT ≤1 ULN |
|---|
|
|
|
|
|---|
| Model | Experimental
assessment cohort (n=238) | Validation cohort
(n=118) | Experimental
assessment cohort (n=130) | Validation cohort
(n=63) |
|---|
| ATAR |
| AUC
(95% CI) | 0.721
(0.656–0.780) | 0.770
(0.683–0.843) | 0.728
(0.638–0.806) | 0.709
(0.581–0.817) |
| Cut-off
value | 0.707 | 0.707 | 0.640 | 0.640 |
|
Sensitivity/specificity
(%) | 71.19/65.31 | 71.64/78.00 | 70.91/72.58 | 59.38/77.42 |
| PPV/NPV
(%) | 67.24/69.39 | 76.51/73.34 | 72.11/70.69 | 72.45/65.59 |
|
Positive/negative LR | 2.05/0.44 | 3.26/0.36 | 2.59/0.40 | 2.63/0.52 |
|
Correctly classified (%) | 71.59 | 81.35 | 70.18 | 73.08 |
| ALB |
| AUC
(95% CI) | 0.632
(0.563–0.696) | 0.724
(0.633–0.802) | 0.672
(0.580–0.756) | 0.689
(0.560–0.800) |
| Cut-off
value | 39.9 | 39.9 | 42.5 | 42.5 |
|
Sensitivity/specificity
(%) | 46.61/80.61 | 50.75/86.00 | 69.09/61.29 | 71.87/67.74 |
| PPV/NPV
(%) | 70.62/60.16 | 78.38/63.59 | 63.50/66.48 | 69.02/70.66 |
|
Positive/negative LR | 2.4/0.66 | 3.62/0.57 | 1.78/0.50 | 2.23/0.42 |
|
Correctly classified (%) | 69.23 | 78.57 | 60.66 | 68.75 |
| GLB |
| AUC
(95% CI) | 0.633
(0.564–0.697) | 0.601
(0.506–0.690) | 0.629
(0.536–0.716) | 0.539
(0.409–0.665) |
| Cut-off
value | 35 | 35 | 34.8 | 34.8 |
|
Sensitivity/specificity
(%) | 41.18/84.21 | 41.79/82.00 | 46.55/80.00 | 40.63/80.65 |
| PPV/NPV
(%) | 72.28/58.88 | 69.89/58.48 | 69.95/59.95 | 67.74/57.60 |
|
Positive/negative LR | 2.61/0.70 | 2.32/0.71 | 2.33/0.67 | 2.1/0.74 |
|
Correctly classified (%) | 66.56 | 73.68 | 69.23 | 68.41 |
| ALT |
| AUC
(95% CI) | 0.602
(0.537–0.665) | 0.577
(0.482–0.667) | 0.550
(0.460–0.637) | 0.519
(0.389–0.646) |
| Cut-off
value | 38 | 38 | 26 | 26 |
|
Sensitivity/specificity
(%) | 56.72/62.50 | 53.73/56.86 | 57.14/59.70 | 56.25/48.39 |
| PPV/NPV
(%) | 60.85/59.08 | 55.47/55.13 | 58.64/58.21 | 52.15/52.52 |
|
Positive/negative LR | 1.51/0.69 | 1.25/0.81 | 1.42/0.72 | 1.09/0.90 |
|
Correctly classified (%) | 66.09 | 62.07 | 56.25 | 52.94 |
| AST |
| AUC
(95% CI) | 0.682
(0.619–0.741) | 0.697
(0.606–0.778) | 0.660
(0.572–0.741) | 0.677
(0.548–0.790) |
| Cut-off
value | 29 | 29 | 27 | 27 |
|
Sensitivity/specificity
(%) | 60.61/68.27 | 55.22/74.51 | 46.03/82.09 | 37.50/80.65 |
| PPV/NPV
(%) | 65.64/63.41 | 67.58/62.41 | 71.99/60.33 | 65.96/56.34 |
|
Positive/negative LR | 1.91/0.58 | 2.17/0.60 | 2.57/0.66 | 1.94/0.86 |
|
Correctly classified (%) | 70.80 | 74 | 69.05 | 66.67 |
| Comparison of
AUC |
| ATAR
vs. ALB | 0.039 | 0.297 | 0.282 | 0.695 |
| ATAR
vs. GLB | 0.029 | 0.005 | 0.043 | 0.054 |
| ATAR
vs. ALT | 0.001 | <0.001 | 0.006 | 0.021 |
| ATAR
vs. AST | 0.082 | 0.023 | 0.149 | 0.491 |
In the validation cohort (n=118), the distribution
of histopathological staging of liver necroinflammation was as
follows: G0, 18 (15.3%); G1, 33(28.0%); G2, 45 (38.1%); G3, 18
(15.3%); and G4, 4 (3.4%; Table I).
For predicting G≥2, the AUC for ATAR (0.770, 95% CI: 0.683–0.843)
was markedly higher than that for GLB (0.601, 95% CI: 0.506–0.690;
P=0.005), ALT (0.577, 95% CI: 0.482–0.667; P<0.001) and AST
(0.697, 95% CI: 0.606–0.778; P=0.023), but only slightly higher
than that of ALB (0.724, 95% CI: 0.633–0.802; P=0.297 vs. ATAR;
Table III). The best cut-off value
for ATAR, GLB, ALB, ALT and AST were the same as in the
experimental assessment cohort. In short, compared to other
markers, the novel ATAR model had the highest AUC for predicting
moderate/severe liver necroinflammation.
Predictive performance of ATAR in
patients with ALT ≤1 ULN
In the clinical setting, numerous CHB patients with
ALT ≤1 ULN have an existing severe liver necroinflammation, which
eventually progresses to cirrhosis or HCC. Therefore, the present
study determined whether ATAR may be used for predicting G≥2 in
patients with ALT ≤1 ULN. The experimental assessment cohort
contained 130 patients (54.62%) with ALT ≤1 ULN, of which 63
(48.46%) were staged as G≥2. In the validation cohort, 63 patients
(53.39%) had normal ALT levels, of which 32 (50.79%) were staged as
G≥2.
As in patients with slightly elevated ALT, the ATAR
also performed well in patients with normal ALT from the
experimental assessment cohort and displayed a higher AUC (0.728,
95% CI 0.638–0.806) in predicting G≥2 than ALB (0.672, 95% CI:
0.580–0.756; P=0.282), GLB (0.629, 95% CI: 0.536–0.716; P=0.043),
ALT (0.550, 95% CI: 0.460–0.637; P=0.006) and AST (0.660, 95% CI
0.572–0.741, P=0.149; Table III).
The similar phenomenon was also observed in the validation cohort
(Table III). For predicting G≥2,
the AUC for ATAR (0.709, 95% CI: 0.581–0.817) was markedly higher
than that for ALT (0.519, 95% CI: 0.389–0.646; P=0.021), but only
slightly higher than that of GLB (0.539, 95% CI: 0.409–0.665;
P=0.054), ALB (0.689, 95% CI: 0.560–0.800; P=0.695) and AST (0.677,
95% CI: 0.548–0.790; P=0.491; Table
III). For predicting G≥2, the best cut-off value was 0.640 for
ATAR, 42.5 for ALB, 34.8 for GLB, 26 for ALT and 27 for AST in the
experimental assessment and validation cohort. These results
indicate that ATAR is more specific than the other clinical markers
in predicting liver necroinflammation in patients with ALT ≤1
ULN.
Predictive performance of ATAR in
HBeAg+ and HBeAg− CHB patients
To validate whether ATAR may be used for predicting
G≥2 in CHB patients with different HBeAg status, the diagnostic
performance of ATAR compared with that of the other markers was
assessed in HBeAg+ patients and HBeAg−
patients separately (Fig. 3). In the
population with ALT ≤2 ULN, 240 patients (67.41%) were positive for
HBeAg, of which 134 (55.83%) were staged as G≥2. Furthermore, 116
patients (32.59%) were negative for HBeAg, of which 66 (56.90%)
were staged as G≥2. Of the patients with ALT ≤1 ULN, 131 (66.88%)
were positive for HBeAg and 62 (33.12%) were negative, of which 59
(45.04%) and 34 (54.83%) patients were staged as G≥2, respectively.
For predicting G≥2, the ATAR displayed the highest AUC (0.738, 95%
CI: 0.641–0.821) in HBeAg+ patients with ALT ≤2 ULN
among the markers assessed, including ALB (0.670, 95% CI:
0.569–0.760; P=0.439), GLB (0.586, 95% CI: 0.484–0.716; P=0.073),
ALT (0.551, 95% CI: 0.449–0.651; P<0.001) and AST (0.665, 95%
CI: 0.565–0.756; P=0.006; Fig. 3A).
Similarly, in HBeAg+ patients with ALT ≤1 ULN, the AUC
of ATAR (0.722, 95% CI: 0.559–0.824) was significantly higher than
that of ALT (0.515, 95% CI: 0.390–0.639; P=0.007) and AST (0.642,
95% CI: 0.516–0.756; P=0.035), but only slightly higher than that
of GLB (0.584, 95% CI: 0.457–0.703; P=0.174) and ALB (0.677, 95%
CI: 0.552–0.786; P=0.642; Fig. 3C).
However, the ATAR did not display the highest AUC neither in
HBeAg− patients with ALT ≤2 ULN or ALT ≤1 ULN (Fig. 3B and D).
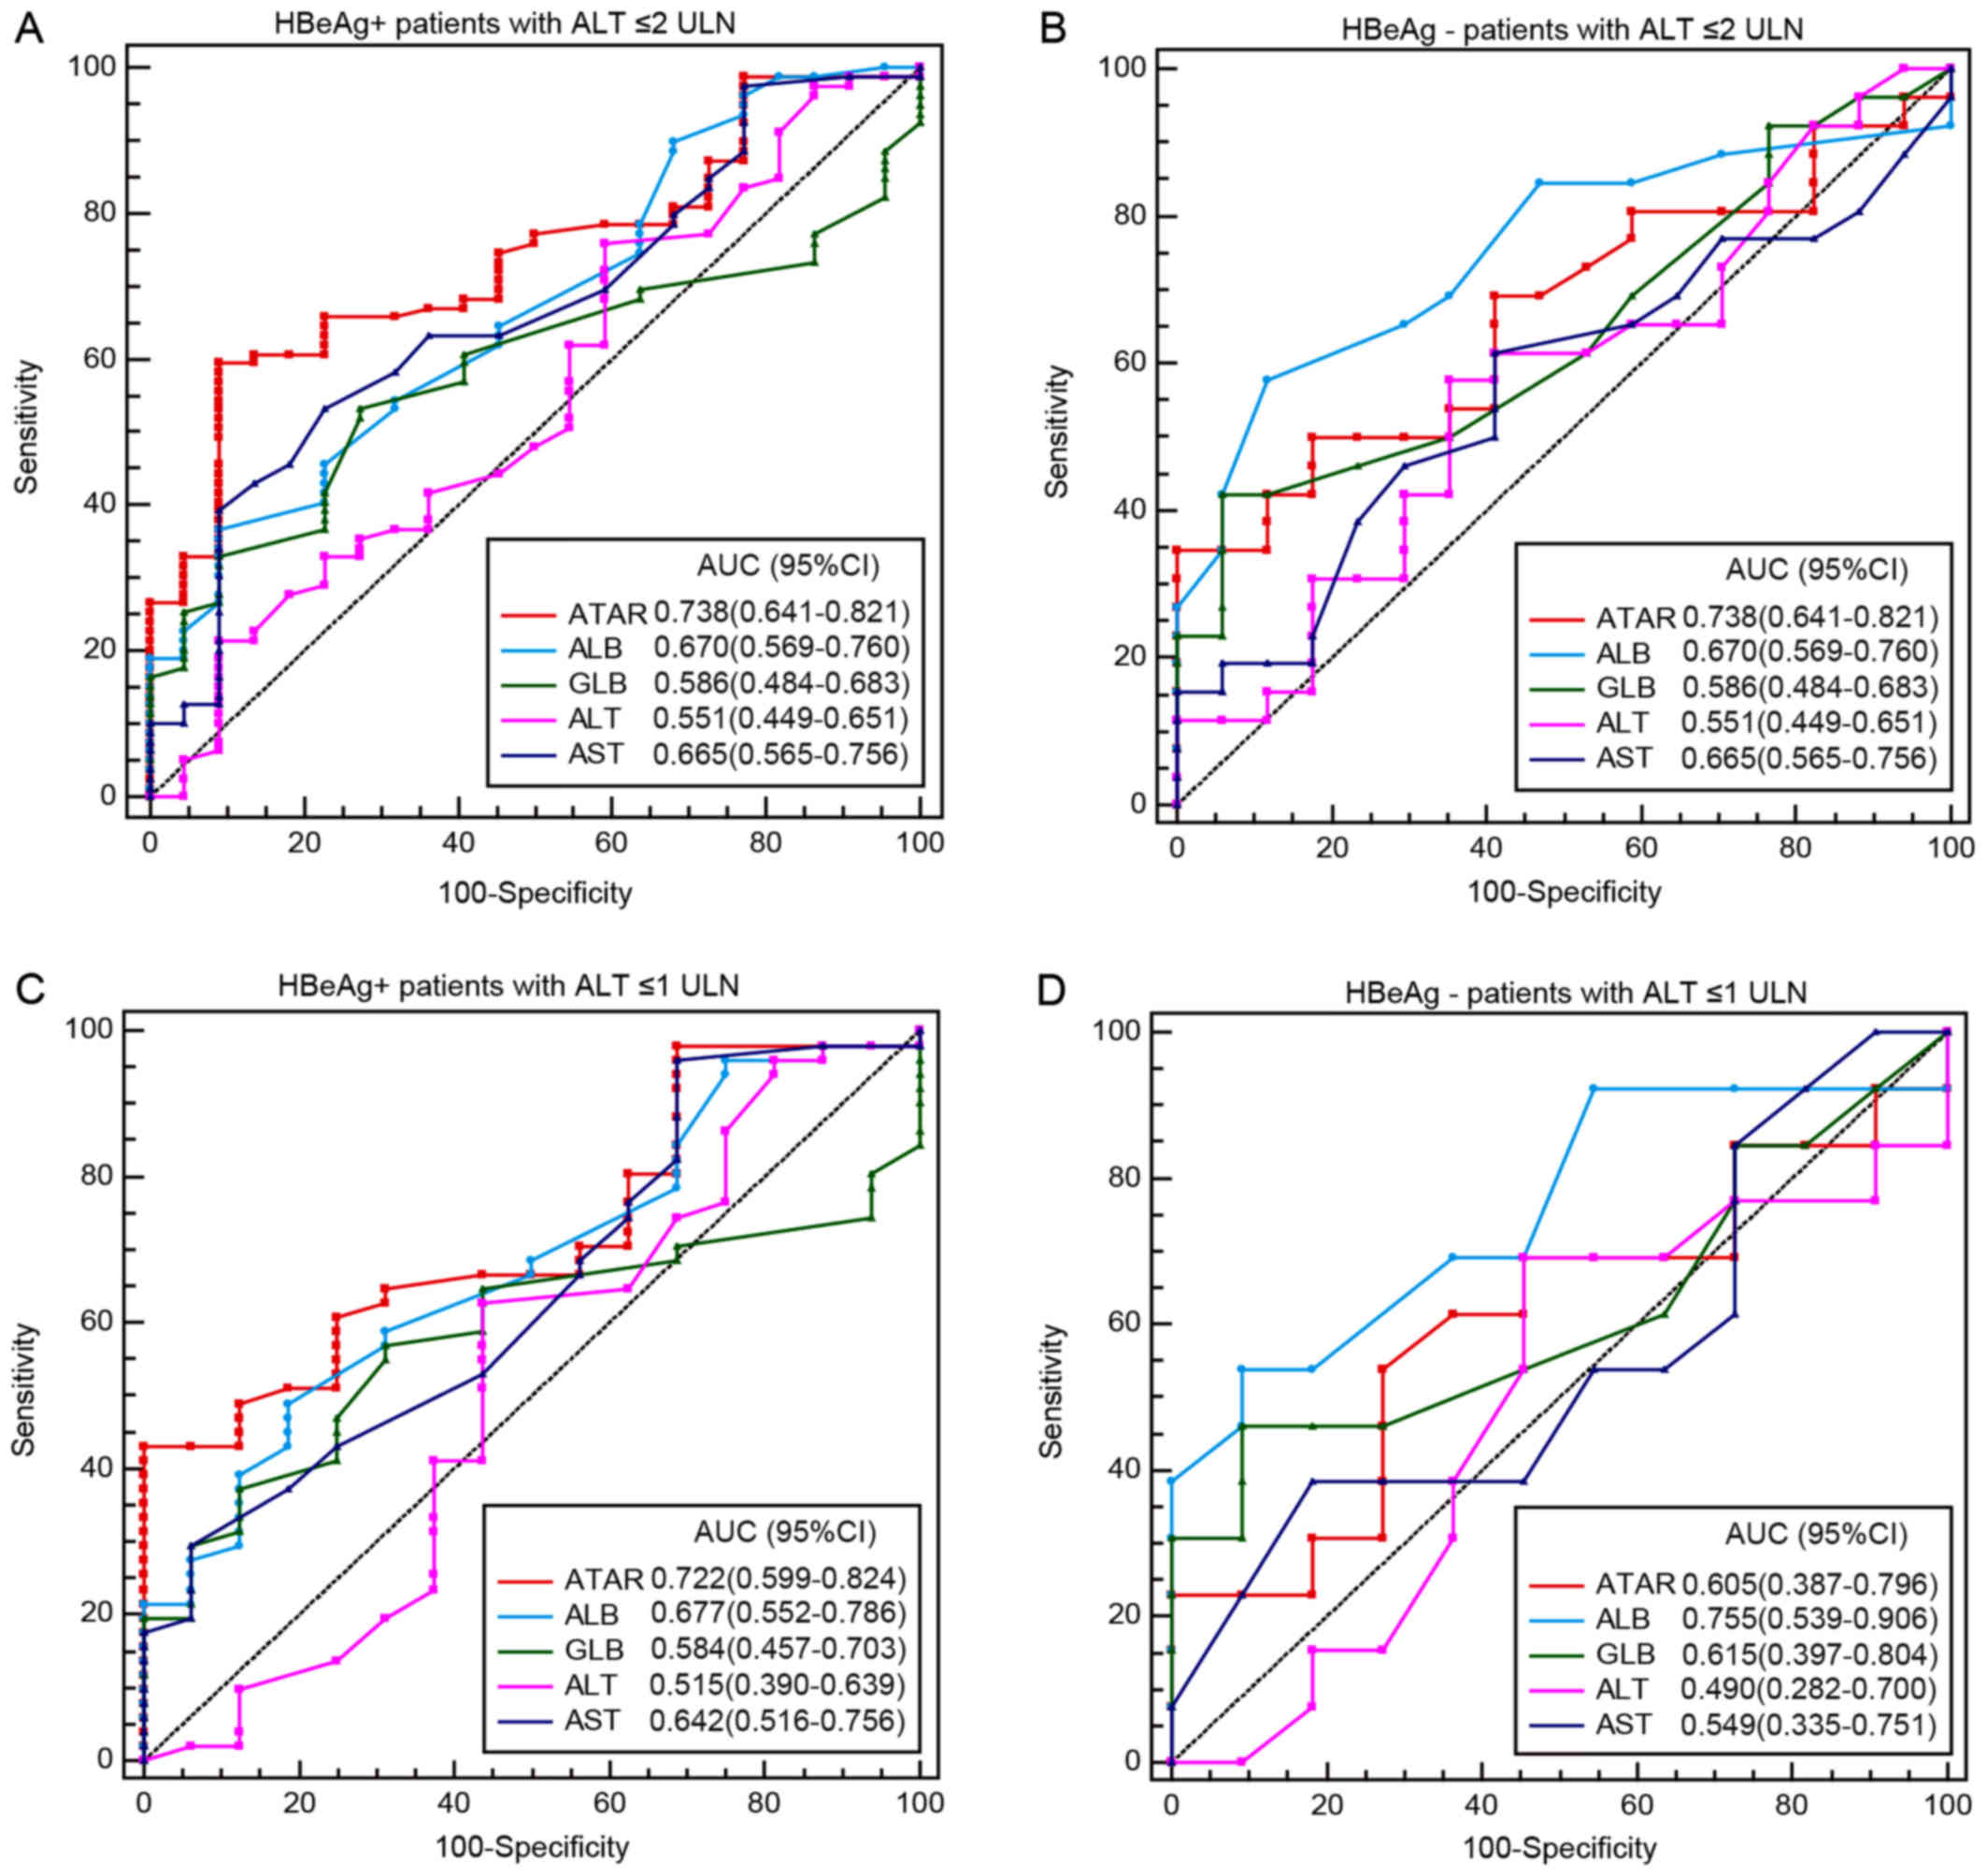 | Figure 3.Receiver operating characteristic
curves of non-invasive biomarkers, including the ATAR ratio and the
levels of AST, ALB, ALT and GLB for prediction of significant liver
necroinflammation in HBeAg+ patients with (A) ALT ≤2 ULN
(the cut-off values were as follows: 0.617 for ATAR, 41.9 for ALB,
30 for GLB, 22 for ALT and 29 for AST), (B) HBeAg−
patients with ALT ≤2 ULN (the cut-off values were as follows: 0.830
for ATAR, 43 for ALB, 34 for GLB, 37 for ALT and 25 for AST), (C)
HBeAg+ patients with ALT ≤1 ULN (the cut-off values were
as follows: 0.617 for ATAR, 42.9 for ALB, 30 for GLB, 32 for ALT
and 16 for AST) and (D) HBeAg− patients with ALT ≤1 ULN
(the cut-off values were as follows: 0.5 for ATAR, 42. for ALB, 34
for GLB, 26 for ALT and 18 for AST). AST, aspartate
aminotransferase; ATAR, AST to ALB ratio; ALB, albumin; ALT,
aminotransferase; GLN, globulin; ULN, upper limit of normal; AUC,
area under curve; CI, confidence interval; HBeAg, hepatitis B e
antigen. |
Discussion
Accurate assessment of liver necroinflammation is
essential for the determination of appropriate anti-viral treatment
and the prognosis for patients with CHB. However, the lack of an
accurate, easily applied and reproducible model for assessment of
liver inflammation remains a major limitation in clinical practice.
In the present study, a non-invasive model (named as ATAR) was
constructed to predict liver necroinflammation in patients with ALT
≤2 ULN. It successfully predicted G≥2 for 71.59% of patients in the
experimental assessment cohort, 81.35% in the validation cohort and
73.86% in the entire cohort. Therefore, the ATAR may be a potential
efficient non-invasive index to predict liver necroinflammation and
determine whether to initiate anti-viral treatment in patients with
ALT ≤2 ULN.
At present, the degree of liver necroinflammation
and therapeutic judgment for anti-viral therapy are mainly
reflected by the levels of ALT, which are affected by numerous
factors. Numerous studies have indicated that ALT levels are not in
parallel to liver inflammation. For instance, as certain CHB
patients with normal ALT levels have an existing liver
inflammation, they fail to receive anti-viral therapy on time, thus
gradually progressing to cirrhosis or HCC. In the experimental
assessment cohort, >50% of patients with normal ALT levels had
significant liver necroinflammation, which is similar to the result
of a previous study (11). Thus, the
early diagnosis of liver necroinflammation has an important role
not only in the therapeutic assessment of HBV infection but also in
the control of disease progression (20).
Apart from LB and FibroScan, numerous non-invasive
models have been established to estimate liver fibrosis or
cirrhosis with high accuracy. However, only a small number of them
were further identified as good predictors for liver
necroinflammation. Therefore, the present study was performed to
develop a simple index derived from routine blood parameters to
predict liver necroinflammation in Chinese CHB patients. AST and
ALB were identified as independent predictors of liver
necroinflammation and ATAR was proposed as the ratio of these two
parameters. Serum AST had been widely used to evaluate liver
necroinflammation due to its association with mitochondrial injury
(7). Serum ALB is also associated
with liver necroinflammation, as its production is affected by
liver injury (21). In addition, ALT
is commonly used to evaluate the severity of liver
necroinflammation, with increases in ALT levels indicating
histopathological changes in the liver, even in patients with ALT
within the normal range (22). Serum
GLB is also synthesized in the liver and the concentration of GLB
changes after exposure to HBV (23).
In the experimental assessment cohort, the ATAR displayed a better
diagnostic value than AST, ALB, GLB and ALT. The sensitivity and
specificity of the ATAR in predicting liver necroinflammation were
71.19 and 65.31%, respectively, at a cut-off value of 0.707. Of
note, ATAR also performed well in patients with ALT ≤1 ULN in the
experimental assessment as well as validation cohorts, where it
displayed the highest AUC in predicting liver necroinflammation
among all indexes assessed. However, ATAR only displayed a better
diagnostic value than AST, ALB, GLB and ALT in HBeAg+
patients, but not in HBeAg− CHB patients, regardless of
their ALT levels being ≤2 or ≤1 ULN.
Several limitations were noted in the present study.
First, it is a retrospective study and the sample size is
relatively small, and the cohorts are not representative of the
entirety of CHB patients in China. Furthermore, the percentage of
male patients and the ratio of patients positive for HBeAg differed
between the two cohorts, which may lead to differences in results
between the two groups. Lastly, we did not determine whether ATAR
was an independent predictor for liver necroinflammation using
multivariate regression.
In conclusion, the present study indicated that the
ATAR is a novel and simple independent indicator for predicting
moderate/severe liver necroinflammation in CHB patients with ALT ≤2
and ≤1 ULN. By applying the pre-defined cutoffs, most of the
patients were correctly classified with regard to their requirement
of anti-viral therapy. Thus, the new ATAR model comprising the
common blood test parameters AST and ALB may be a promising
non-invasive surrogate marker to determine whether anti-viral
treatment should be initiated, particularly in developing
countries.
Acknowledgements
Not applicable.
Funding
The present study was supported by the National
Natural Science Foundation of China (grant nos. 81400625, 81670528
and 81672009), the Shanghai Pujiang Program (grant no. 17PJD005),
the National Science and Technology Major Project of China (grant
nos. 2017ZX10202202 and 2017ZX10202203-007), the Fujian province
Natural Science Foundation of China (grant nos. 2015J01413 and
2016Y9065) and the Chinese foundation for hepatitis prevention and
control (grant no. TQGB 20150092).
Availability of data and materials
The datasets used and/or analyzed during the current
study are available from the corresponding author on reasonable
request.
Authors' contribution
XY and XW searched, identified and reviewed the
literature, collected the data and wrote the manuscript; RM, ZSu
and JZ conceived the current study, identified and reviewed the
literature, interpreted the data and wrote the manuscript; JLi, YZ,
JLo and WZ collected the data; PJ, JW and BZ searched and
identified the literature; QJ, FY and ZSh interpreted the data,
gave critical comments and revised the manuscript. All authors have
made an intellectual contribution to the manuscript and approved
the final version.
Ethics approval and consent to
participate
Written informed consent was obtained from each
patient prior to LB and all trials were approved by the Ethics
Committees of Huashan Hospital, Fudan University and the First
Hospital of Quanzhou, Fujian Medical University.
Patient consent for publication
Not applicable.
Competing interests
The authors declare that they have no competing
interests.
References
|
1
|
Wong GL, Wong VW, Choi PC, Chan AW, Chim
AM, Yiu KK, Chan HY, Chan FK, Sung JJ and Chan HL: Metabolic
syndrome increases the risk of liver cirrhosis in chronic hepatitis
B. Gut. 58:111–117. 2009. View Article : Google Scholar : PubMed/NCBI
|
|
2
|
Terrault NA, Lok ASF, McMahon BJ, Chang
KM, Hwang JP, Jonas MM, Brown RS Jr, Bzowej NH and Wong JB: Update
on prevention, diagnosis, and treatment of chronic hepatitis B:
AASLD 2018 hepatitis B guidance. Hepatology. 67:1560–1599. 2018.
View Article : Google Scholar : PubMed/NCBI
|
|
3
|
European Association for the Study of the
Liver. Electronic address, . simpleeasloffice@easloffice.eu;
European Association for the Study of the Liver. EASL 2017 Clinical
Practice Guidelines on the management of hepatitis B virus
infection. J Hepatol. 67:370–398. 2017. View Article : Google Scholar : PubMed/NCBI
|
|
4
|
Sarin SK, Kumar M, Lau GK, Abbas Z, Chan
HL, Chen CJ, Chen DS, Chen HL, Chen PJ, Chien RN, et al:
Asian-pacific clinical practice guidelines on the management of
hepatitis B: A 2015 update. Hepatol Int. 10:1–98. 2016. View Article : Google Scholar : PubMed/NCBI
|
|
5
|
Castera L: Noninvasive methods to assess
liver disease in patients with hepatitis B or C. Gastroenterology.
142:1293–1302.e4. 2012. View Article : Google Scholar : PubMed/NCBI
|
|
6
|
Verveer C, Zondervan PE, Ten Kate FJ,
Hansen BE, Janssen HL and de Knegt RJ: Evaluation of transient
elastography for fibrosis assessment compared with large biopsies
in chronic hepatitis B and C. Liver Int. 32:622–628. 2012.
View Article : Google Scholar : PubMed/NCBI
|
|
7
|
Wai CT, Greenson JK, Fontana RJ,
Kalbfleisch JD, Marrero JA, Conjeevaram HS and Lok AS: A simple
noninvasive index can predict both significant fibrosis and
cirrhosis in patients with chronic hepatitis C. Hepatology.
38:518–526. 2003. View Article : Google Scholar : PubMed/NCBI
|
|
8
|
Sterling RK, Lissen E, Clumeck N, Sola R,
Correa MC, Montaner J, Sulkowski S M, Torriani FJ, Dieterich DT,
Thomas DL, et al: Development of a simple noninvasive index to
predict significant fibrosis in patients with HIV/HCV coinfection.
Hepatology. 43:1317–1325. 2006. View Article : Google Scholar : PubMed/NCBI
|
|
9
|
Bala S, Petrasek J, Mundkur S, Catalano D,
Levin I, Ward J, Alao H, Kodys K and Szabo G: Circulating microRNAs
in exosomes indicate hepatocyte injury and inflammation in
alcoholic, drug-induced, and inflammatory liver diseases.
Hepatology. 56:1946–1957. 2012. View Article : Google Scholar : PubMed/NCBI
|
|
10
|
Arataki K, Hayes CN, Akamatsu S, Akiyama
R, Abe H, Tsuge M, Miki D, Ochi H, Hiraga N, Imamura M, et al:
Circulating microRNA-22 correlates with microRNA-122 and represents
viral replication and liver injury in patients with chronic
hepatitis B. J Med Virol. 85:789–798. 2013. View Article : Google Scholar : PubMed/NCBI
|
|
11
|
Wang JY, Mao RC, Zhang YM, Zhang YJ, Liu
HY, Qin YL, Lu MJ and Zhang JM: Serum microRNA-124 is a novel
biomarker for liver necroinflammation in patients with chronic
hepatitis B virus infection. J Viral Hepat. 22:128–136. 2015.
View Article : Google Scholar : PubMed/NCBI
|
|
12
|
Li F, Zhou P, Deng W, Wang J, Mao R, Zhang
Y, Li J, Yu J, Yang F, Huang Y, et al: Serum microRNA-125b
correlates with hepatitis B viral replication and liver
necroinflammation. Clin Microbiol Infect. 22:384.e1–384.e10. 2016.
View Article : Google Scholar
|
|
13
|
Liang LB, Zhu X, Yan LB, Du LY, Liu C,
Liao J and Tang H: Quantitative intrahepatic HBV cccDNA correlates
with histological liver inflammation in chronic hepatitis B virus
infection. Int J Infect Dis. 52:77–82. 2016. View Article : Google Scholar : PubMed/NCBI
|
|
14
|
Li J, Zhang TY, Song LW, Qi X, Yu XP, Li
FH, Zhou P, Qin YL, Yang L, Zhao JH, et al: Role of quantitative
hepatitis B core antibody levels in predicting significant liver
inflammation in chronic hepatitis B patients with normal or
near-normal alanine aminotransferase levels. Hepatol Res.
48:E133–E145. 2018. View Article : Google Scholar : PubMed/NCBI
|
|
15
|
Huang H, Sun Z, Pan H, Chen M, Tong Y,
Zhang J, Chen D, Su X and Li L: Serum metabolomic signatures
discriminate early liver inflammation and fibrosis stages in
patients with chronic hepatitis B. Sci Rep. 6:308532016. View Article : Google Scholar : PubMed/NCBI
|
|
16
|
Hong MZ, Ye L, Jin LX, Ren YD, Yu XF, Liu
XB, Zhang RM, Fang K and Pan JS: Noninvasive scoring system for
significant inflammation related to chronic hepatitis B. Sci Rep.
7:437522017. View Article : Google Scholar : PubMed/NCBI
|
|
17
|
Desmet VJ, Gerber M, Hoofnagle JH, Manns M
and Scheuer PJ: Classification of chronic hepatitis: Diagnosis,
grading and staging. Hepatology. 19:1513–1520. 1994. View Article : Google Scholar : PubMed/NCBI
|
|
18
|
Chinese Society of Hepatology, Chinese
Medical Association, ; Chinese Society of Infectious Diseases,
Chinese Medical Association, . Hou JL and Lai W: The guideline of
prevention and treatment for chronic hepatitis B: A 2015 update.
Zhonghua Gan Zang Bing Za Zhi. 23:888–905. 2015.(In Chinese).
PubMed/NCBI
|
|
19
|
European Association For The Study Of The
Liver, . EASL clinical practice guidelines: Management of chronic
hepatitis B. J Hepatol. 50:227–242. 2009. View Article : Google Scholar : PubMed/NCBI
|
|
20
|
Xiao G, Zhu S, Xiao X, Yan L, Yang J and
Wu G: Comparison of laboratory tests, ultrasound, or magnetic
resonance elastography to detect fibrosis in patients with
nonalcoholic fatty liver disease: A meta-analysis. Hepatology.
66:1486–1501. 2017. View Article : Google Scholar : PubMed/NCBI
|
|
21
|
Gao S, Li XY, Fan YC, Sun FK, Han LY, Li
F, Ji XF and Wang K: A noninvasive model to predict liver histology
in HBeAg-positive chronic hepatitis B with alanine aminotransferase
≤2 upper limit of normal. J Gastroenterol Hepatol. 32:215–220.
2017. View Article : Google Scholar : PubMed/NCBI
|
|
22
|
Li YP, Li CY and Chen YP: Independent
predictive factors for significant liver histological changes in
patients with HBeAg-positive high-viral-load chronic HBV infection
and a normal alanine aminotransferase level. J Clin Hepatol.
32:42016.
|
|
23
|
Chen LY, Wang J, Wang WY, Tang H and Feng
P: Correlation between serological indices and liver histological
pathology in patients with HBV infection. Sichuan Da Xue Xue Bao.
Yi Xue. 46:641–644. 2015.(In Chinese).
|