Introduction
Lung ground-glass opacity (GGO) presents as a mild
increase in the density of the lung on the high resolution computed
tomography (HRCT), while bronchial vascular bundles were visible
(1). GGO is a non-specific
characteristic that may be associated with various diseases,
including bronchioloalveolar carcinoma (BAC) (2). In the mediastinal window of a computed
tomography (CT) scan, GGO is hardly seen or only the solid part of
the lung is visible. These signs can also be shown in inflammation,
edema, hemorrhage, fibrosis, cancer and multiple other diseases
(3). On a CT scan, four types of GGO
may be observed: Type I, which was a simple ground glass-like
shadow; type II, uneven density is observed; type III, central high
density is observed with peripheral burring GGO; and type IV,
nodular GGO is observed (4).
However, with the development of HRCT, the detection and diagnosis
rate of lung GGO lesions has improved significantly (5). In this paper, a retrospective analysis
of 106 cases was performed to compare and analyze focal GGO lesions
with their corresponding pathology results, with the aim of
improving diagnosis and differential diagnosis, as well as the
accuracy of pre-surgery diagnosis of GGO.
Materials and methods
Participants
A total of 106 cases with clinical diagnosis and CT
scan of focal GGO were recruited at the Affiliated Hospital of
Qingdao University (Qingdao, China) from January 2008 to July 2014,
including 74 males and 32 females. The average age was 56.0±11.1
years, ranging from 41 to 78 years old. Among them, 43 cases showed
no prior clinical symptoms, and were diagnosed at the time of
routine physical examination. There were 57 cases with cough or
sputum, 63 cases with chest pain or chest tightness, 28 cases with
hemoptysis and 36 cases with difficulty breathing. All patients
underwent pulmonary multislice spiral CT examination, and 46
patients had a chest-enhanced CT scan. Patients received surgery
(lobectomy, segmentectomy or partial lung resection) to remove
tumor. Prior written and informed consent was obtained from all
patients and the study was approved by the ethics review board of
Qingdao University.
CT scan
Philips Brilliance 64-slice CT and Philips
Brilliance 256 iCT layer spiral CT scanners (Philips Medical
Systems B.V., Eindhoven, The Netherlands) were used. Patients were
scanned in the supine position at end-expiration. Scan range was
from the apex to the base of the lung, including both sides of the
chest wall and axillary. The scan parameters were as follows: Tube
voltage, 120–140 kV; tube current, 50–80 mA; reconstructed slice
thickness, 0.3–1 mm. A high-resolution reconstruction algorithm was
used with lung window and mediastinal window, including lung window
of +700 to −700 HU and mediastinal window of 50 to 300 HU. After
the CT scan, patients were injected with non-ionic iodinated
contrast medium iohexol (350 mgI/ml, 1.0–1.5 ml/kg, flow rate of
3–4 ml/sec) into the ulnar vein with a binocular high-pressure
syringe for an enhanced CT scan. Patients were scanned at 25 and 75
sec after injection, for the vascular and parenchymal phases,
respectively. GGO was categorized into four types according to CT
scan observation: Type I; type II III and IV, as described
previously (3).
Image analysis
The scan images were adjusted for cross-sectional,
sagittal, coronal and beveled sections to evaluate the shape of the
lesion and its relationship with adjacent trachea. After
adjustment, the CT images were read with a double-blind method by
two experienced physicians. The location, size, shape (round, oval,
irregular), edges (lobulated, burring, spinous process), side
surface (clear, rough, fuzzy) and surroundings (vascular
convergence, pleural indentation) of lesions were analyzed with
plain and enhanced CT scan. Disagreements were discussed between
these two physicians to reach to an agreement.
Determination of BAC content
Resected tumor tissues were fixed in 4% neutral
formaldehyde at room temperature for 24–48 h and embedded in
paraffin. Subsequently, the tumor tissues (5-µm thick sections)
were stained with hematoxylin (for 3–5 min at room temperature) and
eosin (for 1–4 min at room temperature) according to routine
procedure. Five fields under high magnification (×100) were
randomly selected. The BAC content relative to the whole tumor was
evaluated and calculated as previously described (6). The tumors were categorized into four
types based on BAC content: Type I, BAC content in ≥90% of lesion
area; type II, BAC content in 50–89% of lesion area; type III, BAC
content in 10–49% of lesion area; and type IV, BAC content of
<10% lesion area.
Statistical analysis
SPSS 17.0 software (SPSS, Inc., Chicago, IL, USA)
was used to compare CT scan and pathology results with
χ2 test analysis. Spearman rank correlation analysis was
used to analyze the correlation between CT value and BAC content.
P<0.05 was considered to indicate a statistically significant
difference.
Results
Image characteristics of GGO
To determine the characteristics of lung lesions,
HRCT scans were performed. As shown in Table I, among the 106 cases, there were 28
lesions in the right upper lobe, 21 lesions in the right middle
lobe, 15 lesions in the right lower lobe, 19 lesions in the left
upper lobe, 15 lesions in the left middle lobe and 8 lesions in the
left lower lobe. Of the 106 cases, there were 12 lesions with
diameter <1.0 cm, 36 lesions with diameter of 1.0–1.5 cm, 25
lesions with diameter of 1.6–2.0 cm, 19 lesions with diameter of
2.0–2.5 cm and 14 lesions with diameter of 2.5–3.0 cm. There were
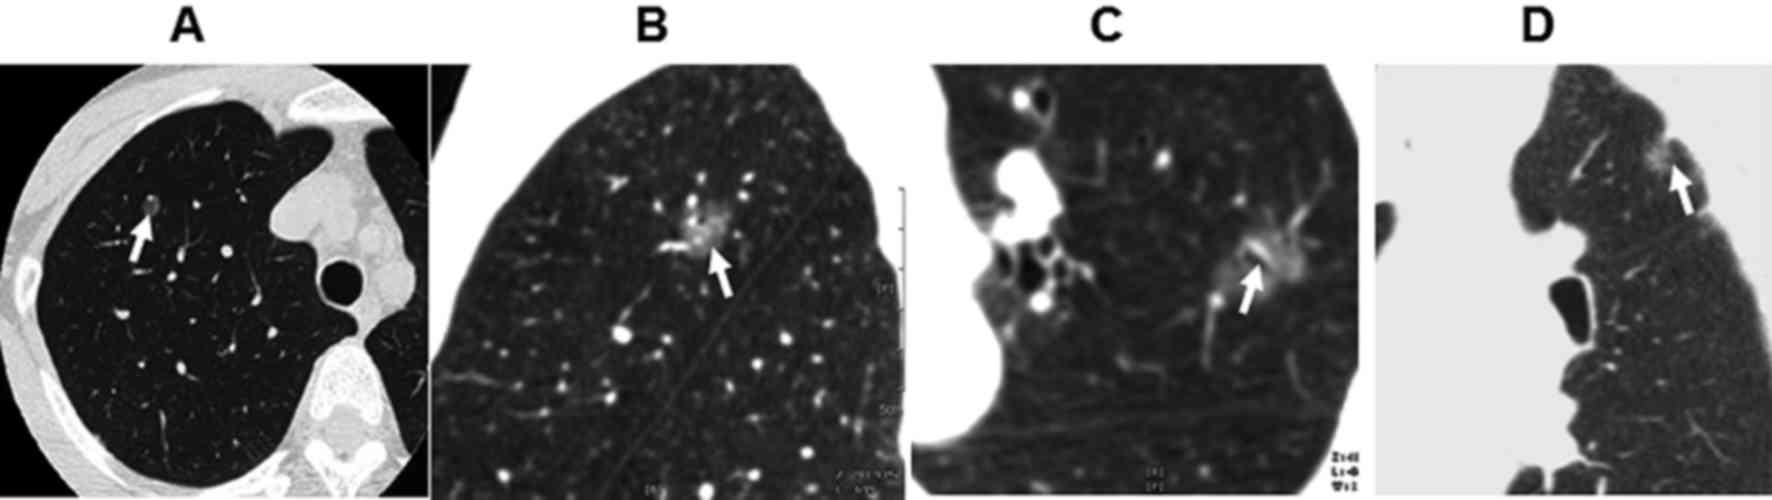
20 lesions of round shape (Fig. 1A),
68 of oval shape and 18 lesions of irregular shape. There were 56
lesions with burring edge (Fig. 1B)
and 32 lesions with leaf edge. There were 28 cases of air
bronchogram (Fig. 1C) and 37 cases
of pleural indentation surrounding the lesions (Fig. 1D). There were 16 patients with
lesions of 20–55 HU in enhanced CT scan. There was no obvious
necrosis or calcification in all cases.
 | Table I.Computed tomography characteristics of
all cases. |
Table I.
Computed tomography characteristics of
all cases.
|
| Occurrence |
|---|
|
|
|
|---|
| Variable | n | % |
|---|
| Lesion location |
|
|
| Right
upper lobe | 28 | 26.4 |
| Right
middle lobe | 21 | 19.8 |
| Right
lower lobe | 15 | 14.2 |
| Left
upper lobe | 19 | 17.9 |
| Left
middle lobe | 15 | 14.2 |
| Left
lower lobe | 8 | 7.5 |
| Lesion diameter
(cm) |
|
|
|
<1.0 | 12 | 11.3 |
|
1.0–1.5 | 36 | 34.0 |
|
1.6–2.0 | 25 | 23.6 |
|
2.0–2.5 | 19 | 17.9 |
|
2.5–3.0 | 14 | 13.2 |
| Lesion shape |
|
|
|
Round | 20 | 18.8 |
| Oval | 68 | 64.1 |
|
Irregular | 18 | 16.9 |
| Lesion edge |
|
|
|
Burring | 56 | 52.8 |
| Leaf | 32 | 30.1 |
| Air bronchogram | 28 | 26.4 |
| Pleural
indentation | 37 | 34.9 |
CT classification and pathology of
focal GGO
To determine the association between GGO and its
pathology, GGO was categorized into four types according to CT
scans: Type I is simple GGO (47 cases, as in Fig. 2A-D); type II is uneven density GGO
(34 cases, as in Fig. 2E and F),
type III is central high density with peripheral burring GGO (19
cases) and type IV is nodule GGO (17 cases, as in Fig. 2G and H). Pathology of type IV GGO
revealed the tumor was solid, with no air filling, proliferation of
elastic fibers and interrupted or destroyed reticular structure in
the tumor. The CT findings, pathology results and statistical
analysis are shown in Table II. The
malignancy ratio was 68.0% in GGO type I, 61.7% in type II, 73.6%
in type III and 70.5% in type IV. As shown in Table II, the malignancy ratio in GGO types
III and IV was higher than that in types I and II. This finding
suggested that CT scan is of clinical importance in the diagnosis
of GGO.
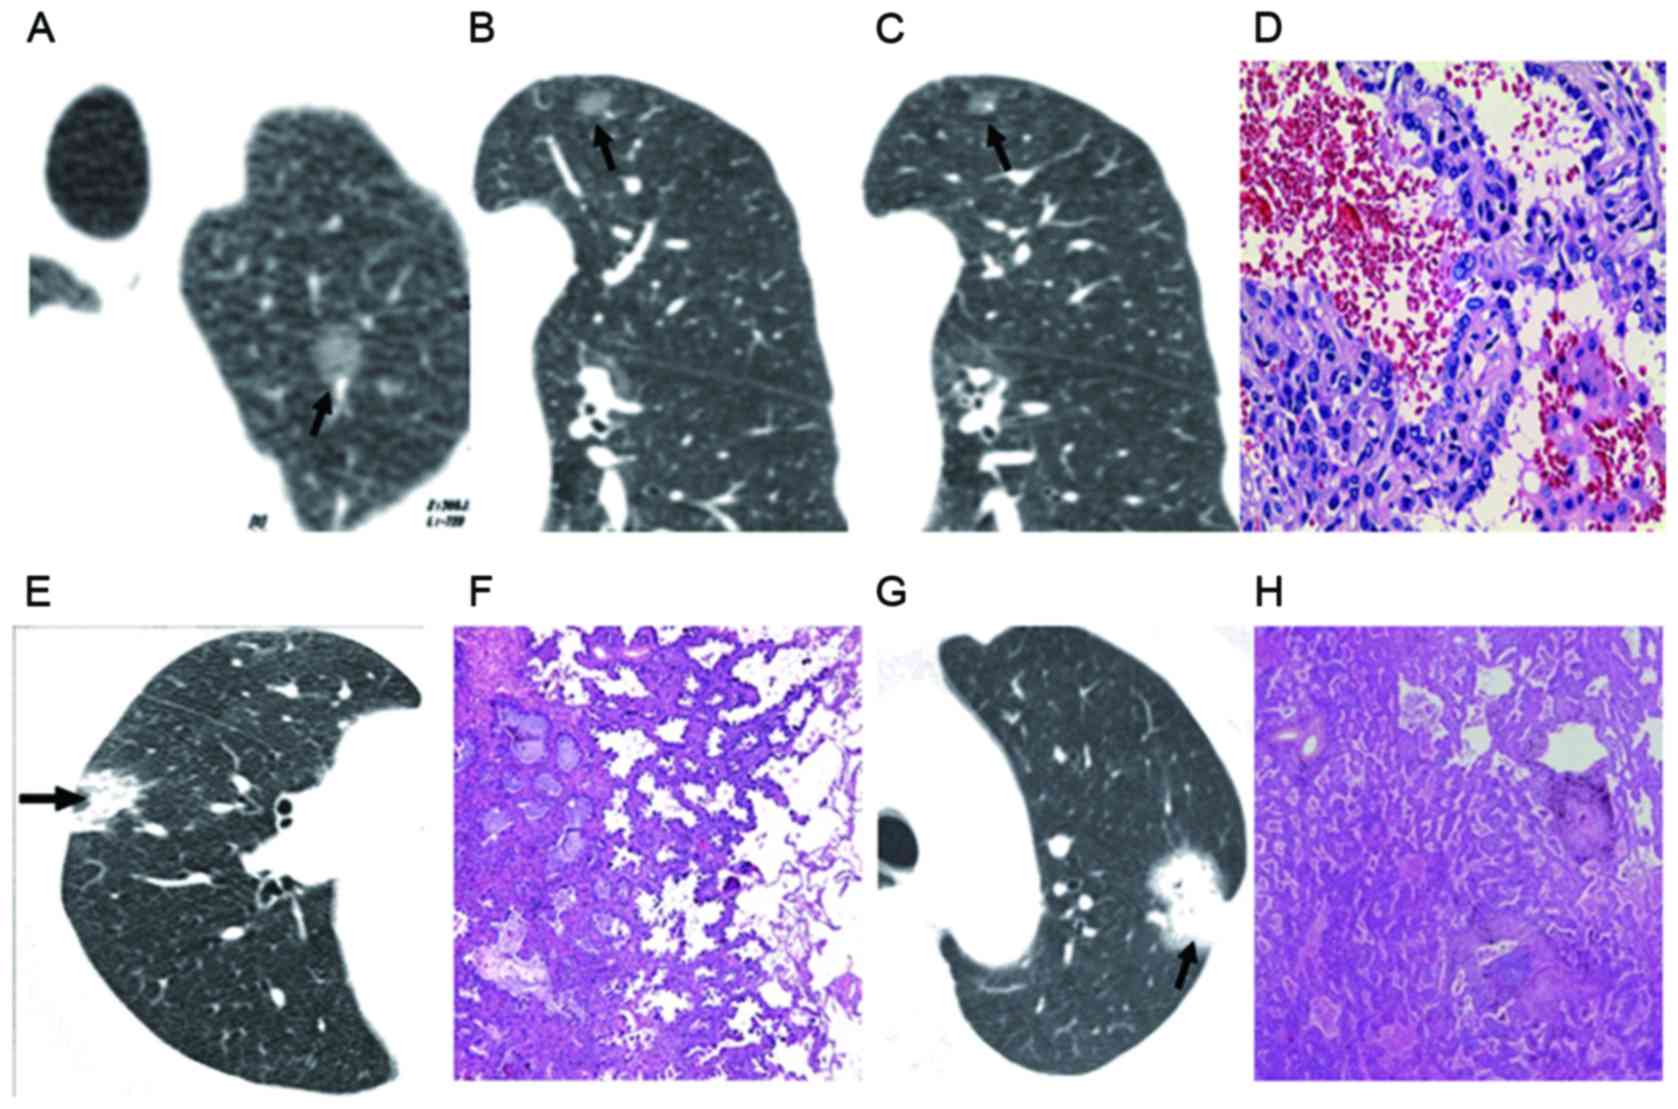 | Figure 2.GGO CT classifications. (A) and (B)
Simple GGO nodules in the upper lobe with clear boundary and shape,
without burring. (A) GGO type IV and (B) type III were indicated.
(C) Bronchial vascular bundle shown in GGO type II. (D) Pathology
demonstrated incomplete filling of air cavity, mild interstitial
thickening and partial alveolar depression, with pathology of BAC
(GGO type I). Magnification, ×100. (E) CT image showed nodules of
uneven density (GGO type I). (F) Pathology indicated alveolar
collapse and severe hyperplasia of elastic fibers in tumor (GGO
type II). (G) CT image showed nodules of homogeneous soft tissue
density (GGO type IV). Magnification, ×100. (H) Pathology showed
elastic fiber proliferation in tumor with interrupted and destroyed
reticular structure, and pathology of lung cancer. Magnification,
×100. GGO, ground-glass opacity; CT, computed tomography; BAC,
bronchioalveolar carcinoma. Arrows indicate the lesions. |
| Table II.Statistical analysis of CT and
pathology of the 106 cases. |
Table II.
Statistical analysis of CT and
pathology of the 106 cases.
|
|
|
| Pathology |
|
|
|---|
|
|
|
|
|
|
|
|---|
| CT
classification | n | Malignancy ratio
(%) | Benign | Malignant | χ2 | P-value |
|---|
| I | 47 | 68.0 | 12 | 32 | 14.370 | <0.05 |
| II | 34 | 61.7 | 11 | 21 |
|
|
| III | 19 | 73.6 | 5 | 14 |
|
|
| IV | 17 | 70.5 | 4 | 12 |
|
|
Correlation analysis between GGO CT
value and BAC content
To determine the correlation of GGO CT value and BAC
content, Spearman rank correlation analysis was conducted. As
mentioned earlier, the tumor categorized into four types based on
BAC content, including Type I (n=26), Type II (n=24), Type III
(n=16) and Type IV (n=13) (Table
III). The CT values were all negatively correlated with BAC
content. Furthermore, this correlation was significant
(P<0.05).
| Table III.Correlation of different CT value and
BAC content. |
Table III.
Correlation of different CT value and
BAC content.
|
| BAC content |
|
|---|
|
|
|
|
|---|
| CT range (HU) | Type I (n=26) | Type II (n=24) | Type III (n=16) | Type IV (n=13) | r value | P-value |
|---|
| −300 | 0.90 | 0.66 | 0.67 | 0.38 | −0.678 | <0.001 |
| −350 | 0.87 | 0.69 | 0.58 | 0.36 | −0.689 | <0.001 |
| −400 | 0.83 | 0.58 | 0.47 | 0.32 | −0.641 | <0.001 |
| −450 | 0.79 | 0.57 | 0.38 | 0.28 | −0.653 | <0.001 |
| −500 | 0.77 | 0.48 | 0.34 | 0.24 | −0.643 | <0.001 |
| −550 | 0.78 | 0.43 | 0.30 | 0.21 | −0.638 | <0.001 |
Discussion
GGO is a hazy, dense shadow in the lung that appears
on high-resolution CT of the bronchus or pulmonary vasculature.
This manifestation is non-specific and can be seen in inflammation,
injury, edema, hemorrhage, focal fibrosis, cancer or atypical
adenomatous hyperplasia (4). GGO
formation results in incomplete filling of air cavity, mild
interstitial thickening and partial alveolar depression (7). An increasing number of patients are
clinically diagnosed with lung GGO, for unknown reasons (8). Timely detection and diagnosis of GGO is
critical to future treatment and prognosis.
GGO lesions can be caused by numerous pathology
changes, which generally present as incomplete filling of the
alveolar cavity with cells and liquids (such as edema and
hemorrhage) (9), or lung
interstitial thickening due to inflammation, edema, fibrosis or
cancer (10). At end-expiration, the
volume of alveolar air is reduced, lung interstitial volume is
normal and the number of alveolar follicles in the alveolar unit
increases (10). However, with a
small amount of liquid or early gas-liquid presence in alveoli, and
restricted spatial resolution of high-resolution CT, it is hard to
distinguish these pathology changes from the thickening of the
alveolar walls (11).
In the current paper, focal GGO was divided into
four types based on CT characteristics. There were 47 cases of type
I, presenting as clear boundary with leaf edges or burring on CT.
There were 11 cases (all type I) of peripheral GGO, with lesions
below visceral pleura and away from the vascular bundle. Their
pathology showed tumor cells grew along the alveolar wall with no
alveolar collapse and mild hyperplasia of elastic fibers in tumor.
Of the 47 cases of simple GGO, 12 cases were BAC. There were 34
cases of type II, presenting as uneven GGO on CT. Pathology showed
that tumor cells grew along the alveolar wall, with scattered
alveolar collapse, severe hyperplasia of elastic fibers and
complete network structure within the tumor. There were 19 cases of
type III, presenting as central high-density and peripheral GGO on
CT. Pathology showed alveolar collapse, proliferation of elastic
fibers in tumor center, fractured reticular structure of elastic
fibers and growth of tumor cells along the wall. There were 17
cases of type IV, presenting as homogeneous soft nodules on CT.
Different types of GGO on CT show differences in pathology
(12). In the current study,
malignance accounted for 68.0% in type I, 61.7% in type II, 73.6%
in type III and 70.5% in type IV. The malignance rate in types III
and IV was higher than that in types I and II, which showed the
clinical importance of the CT evaluation of GGO.
Lung GGO is usually associated with atypical
adenomatous hyperplasia (AAH) and BAC. It has previously been
reported that AAH is a precancerous lesion of lung cancer (13). This type generally consists of
smaller lesions, with no leaf or burring edges on CT. In the
current study, 9 cases had these characteristics. Simple GGO can
also be BAC. There were 27 cases of simple GGO, but pathology
showed lung cancer with pathology of tumor cell growing along the
alveolar wall (14). The BAC lesions
were larger than AAH, with high density, air bronchogram, burring
and leaf edges, thus these two types of cancer can be
differentiated by CT. Yang et al reported that out of 55
cases of BAC, 56% showed air bronchogram (15). If BAC is of peripheral type, pleural
indentation may be visible (16).
Solid GGO is generally shown in adenocarcinoma, which is usually
larger than an AHH lesion. BAC can also show heterogeneous density
with strips or patchy shadows and pleural indentation, with a
smaller proportion of solid GGO compared with adenocarcinoma
(17). It has been reported that
mixed GGO density is of higher lung cancer incidence (18). Therefore, mixed GGO density should be
considered as high-risk, and surgical intervention is highly
recommended.
GGO can also be a sign of inflammation, thus regular
follow-up is important to determine the nature of the lesions and
further treatment. When GGO shows on a CT scan, inflammation should
be ruled out first. Kodama et al (19) showed that focal GGO resulting from
acute inflammation or hemorrhage can be resolved in the first three
months of follow-up. If the size or density of the lesion increases
within 3–6 months, it is necessary to determine the nature of the
lesions. If the lesion has remained the same size or slightly
increased, combined with cancer history, malignancy is of a higher
possibility. If the lesion has burring or leaf edges, lung biopsy
should be conducted for diagnosis. In the follow-up, regardless of
the GGO size, if soft tissue has increased, adenocarcinoma is
possible and surgical intervention is recommended (20). It has previously been shown that CT
is of high specificity and moderate sensitivity in the diagnosis of
focal lung nodules (21). With the
development and wide application of CT examination, it can be used
as the primary tool for the inspection of focal pulmonary
nodules.
Acknowledgements
The authors would like to thank Professor Jizheng
Lin from the Department of Radiology, Affiliated Hospital of
Qingdao University (Qingdao, China) for his value help to this
manuscript.
Funding
No funding was received.
Availability of data and materials
All data generated or analyzed during this study are
included in this published article.
Authors' contributions
HLY performed the experiments, analyzed the data and
wrote the manuscript. SHL, CYZ and SKL provided technical help for
the experiments and were involved in drafting the manuscript. JNR
and JLZ participated in acquisition of data, and, analysis and
interpretation of data. WJX conceived and designed the experiments,
wrote the manuscript and gave final approval of the version to be
published. All authors read and approved the final manuscript.
Ethics approval and consent to
participate
Prior written and informed consent was obtained from
all patients and the study was approved by the ethics review board
of Qingdao University.
Consent for publication
Not applicable.
Competing interests
The authors declare that they have no competing
interests.
References
|
1
|
Austin JH, Müller NL, Friedman PJ, Hansell
DM, Naidich DP, Remy-Jardin M, Webb WR and Zerhouni EA: Glossary of
terms for CT of the lungs: Recommendations of the Nomenclature
Committee of the Fleischner Society. Radiology. 200:327–331. 1996.
View Article : Google Scholar : PubMed/NCBI
|
|
2
|
Kim HK, Choi YS, Kim J, Shim YM, Lee KS
and Kim K: Management of multiple pure ground-glass opacity lesions
in patients with bronchioloalveolar carcinoma. J Thorac Oncol.
5:206–210. 2010. View Article : Google Scholar : PubMed/NCBI
|
|
3
|
Hua Y: CT differential diagnosis of
infective and non-infective diseases of the lung. Shanghai Medical
Imaging. 12:337–339. 2009.(In Chinese).
|
|
4
|
Song Y and Zhan P: Management and
differential diagnosis of ground-glass opacity pulmonary lesions.
Zhonghua Jie He He Hu Xi Za Zhi. 32:808–809. 2009.(In Chinese).
PubMed/NCBI
|
|
5
|
Sergiacomi G, Cicciò C, Boi L, Velari L,
Crusco S, Orlacchio A and Simonetti G: Ground-glass opacity:
High-resolution computed tomography and 64-multi-slice computed
tomography findings comparison. Eur J Radiol. 74:479–483. 2010.
View Article : Google Scholar : PubMed/NCBI
|
|
6
|
Okada M, Nishio W, Sakamoto T, Uchino K,
Hanioka K, Ohbayashi C and Tsubota N: Correlation between computed
tomographic findings, bronchioloalveolar carcinoma component, and
biologic behavior of small-sized lung adenocarcinomas. J Thorac
Cardiovasc Surg. 127:857–861. 2004. View Article : Google Scholar : PubMed/NCBI
|
|
7
|
Engeler CE, Tashjian JH, Trenkner SW and
Walsh JW: Ground-glass opacity of the lung parenchyma: A guide to
analysis with high-resolution CT. AJR Am J Roentgenol. 160:249–251.
1993. View Article : Google Scholar : PubMed/NCBI
|
|
8
|
Kobayashi Y and Mitsudomi T: Management of
ground-glass opacities: Should all pulmonary lesions with
ground-glass opacity be surgically resected? Transl Lung Cancer
Res. 2:354–363. 2013.PubMed/NCBI
|
|
9
|
Liu C: MSCT presentations of pulmonary
ground-glass opacity. Chin Imag J Integ Trad West Med. 4:228–230.
2013.(In Chinese).
|
|
10
|
Bao R and Sun D: CT diagnosis and
differential diagnosis of pulmonary nodular ground-glass opacity.
Int J Med Radiol. 31:213–216. 2008.(In Chinese).
|
|
11
|
Remy-Jardin M, Giraud F, Remy J, Copin MC,
Gosselin B and Duhamel A: Importance of ground-glass attenuation in
chronic diffuse infiltrative lung disease: Pathologic-CT
correlation. Radiology. 189:693–698. 1993. View Article : Google Scholar : PubMed/NCBI
|
|
12
|
Nishio R, Akata S, Saito K, Ohira T,
Tsuboi M, Hirano T, Ikeda N, Kotake F, Kato H and Abe K: The ratio
of the maximum high attenuation area dimension to the maximum tumor
dimension may be an index of the presence of lymph node metastasis
in lung adenocarcinomas 3 cm or smaller on high-resolution computed
tomography. J Thorac Oncol. 2:29–33. 2007. View Article : Google Scholar : PubMed/NCBI
|
|
13
|
Wang J, Zhang H, Ma X and Wu N: Atypical
adenomatous hyperplasia of the lung: Correlation of radiographic
and pathologic findings. Chin J Radiol. 41:483–486. 2007.(In
Chinese).
|
|
14
|
Kakinuma R, Ohmatsu H, Kaneko M, Kusumoto
M, Yoshida J, Nagai K, Nishiwaki Y, Kobayashi T, Tsuchiya R,
Nishiyama H, et al: Progression of focal pure ground-glass opacity
detected by low-dose helical computed tomography screening for lung
cancer. J Comput Assist Tomogr. 28:17–23. 2004. View Article : Google Scholar : PubMed/NCBI
|
|
15
|
Yang ZG, Sone S, Takashima S, Li F, Honda
T, Maruyama Y, Hasegawa M and Kawakami S: High-resolution CT
analysis of small peripheral lung adenocarcinomas revealed on
screening helical CT. AJR Am J Roentgenol. 176:1399–1407. 2001.
View Article : Google Scholar : PubMed/NCBI
|
|
16
|
Liu J, Shen J, Yang C, He P, Guan Y, Liang
W and He J: High incidence of EGFR mutations in pneumonic-type
non-small cell lung cancer. Medicine (Baltimore). 94:e5402015.
View Article : Google Scholar : PubMed/NCBI
|
|
17
|
Nambu A, Araki T, Taguchi Y, Ozawa K,
Miyata K, Miyazawa M, Hiejima Y and Saito A: Focal area of
ground-glass opacity and ground-glass opacity predominance on
thin-section CT: Discrimination between neoplastic and
non-neoplastic lesions. Clin Radiol. 60:1006–1017. 2005. View Article : Google Scholar : PubMed/NCBI
|
|
18
|
Fan L, Li Q, Liu S, Yu H, Li Q and Xiao X:
Multi-detector computed tomography features of pulmonary mixed
ground-glass opacity nodules. J Pract Radiol. 27:46–50. 2011.(In
Chinese).
|
|
19
|
Kodama K, Higashiyama M, Yokouchi H,
Takami K, Kuriyama K, Kusunoki Y, Nakayama T and Imamura F: Natural
history of pure ground-glass opacity after long-term follow-up of
more than 2 years. Ann Thorac Surg. 73:386–393. 2002. View Article : Google Scholar : PubMed/NCBI
|
|
20
|
Yun S, Shu YH and Jun GL: Investigation of
High-resolution CT findings in bronchioloalveolar carcinoma. Chin J
Med Imag Technol. 12:0152002.
|
|
21
|
Zhang CY, Yu HL, Li X and Sun YY:
Diagnostic value of computed tomography scanning in differentiating
malignant from benign solitary pulmonary nodules: A meta-analysis.
Tumor Biol. 35:8551–8558. 2014. View Article : Google Scholar
|