Introduction
Endarterectomy, often performed on the carotid,
femoral, aortic and pulmonary arteries, is a surgical procedure
that removes part of the arterial inner lining along with an
adherent atherosclerotic plaque, which aims to recanalize the
occluded vessel and restore vascular supply to the tissue (1,2). As one
of the most frequently performed peripheral arterial surgeries, it
has been demonstrated that the 30-day post-carotid endarterectomy
mortality was 1.40% [95% confidence interval (CI) 1.34–1.47] from
2001 to 2002 and 1.17% (CI, 1.10–1.24) from 2007 to 2008 (3). A recent study has revealed a 3.4%
30-day mortality following isolated common femoral endarterectomy
(4). However, the mortality rate of
emergency carotid revascularization has risen to ~10% in Germany
under routine conditions (5).
Considering the severity of patient illness in intensive care
units, it is not uncommon for there to be a poorer outcome for
those who undergo endarterectomy, although associated
epidemiological data are limited. As the clinical outcome
prediction of critically ill patients may contribute to individual
patient management (6), it is
necessary to determine useful predictors for such patients. The
international normalized ratio (INR) is a routine coagulation test,
which has been determined to be a predictor of several clinical
conditions, including mortality in patients with trauma (7,8), risk
stratification for patients with acute ischemic stroke that are
treated with warfarin (9) and
mortality in patients with sepsis (10). However, to the best of our knowledge,
it remains unknown whether the INR on admission could serve as a
reliable predictor of long-term outcome for critically ill patients
who undergo endarterectomy following admission. Therefore, the
current study extracted data from a publicly accessible database of
critical care medicine to investigate the prognostic predictive
value of INR.
Patients and methods
Database
The Medical Information Mart for Intensive Care III
database is a large, publicly available database consisting of
de-identified data for patients that were hospitalized in the
intensive care unit at Beth Israel Deaconess Medical Centre
(Boston, MA, USA) between 2001 and 2012 (11). Access to this database was approved
by the institutional review board of Beth Israel Deaconess Medical
Centre and Massachusetts Institute of Technology Affiliates
(Boston, MA, USA). No informed consent was required.
Patients
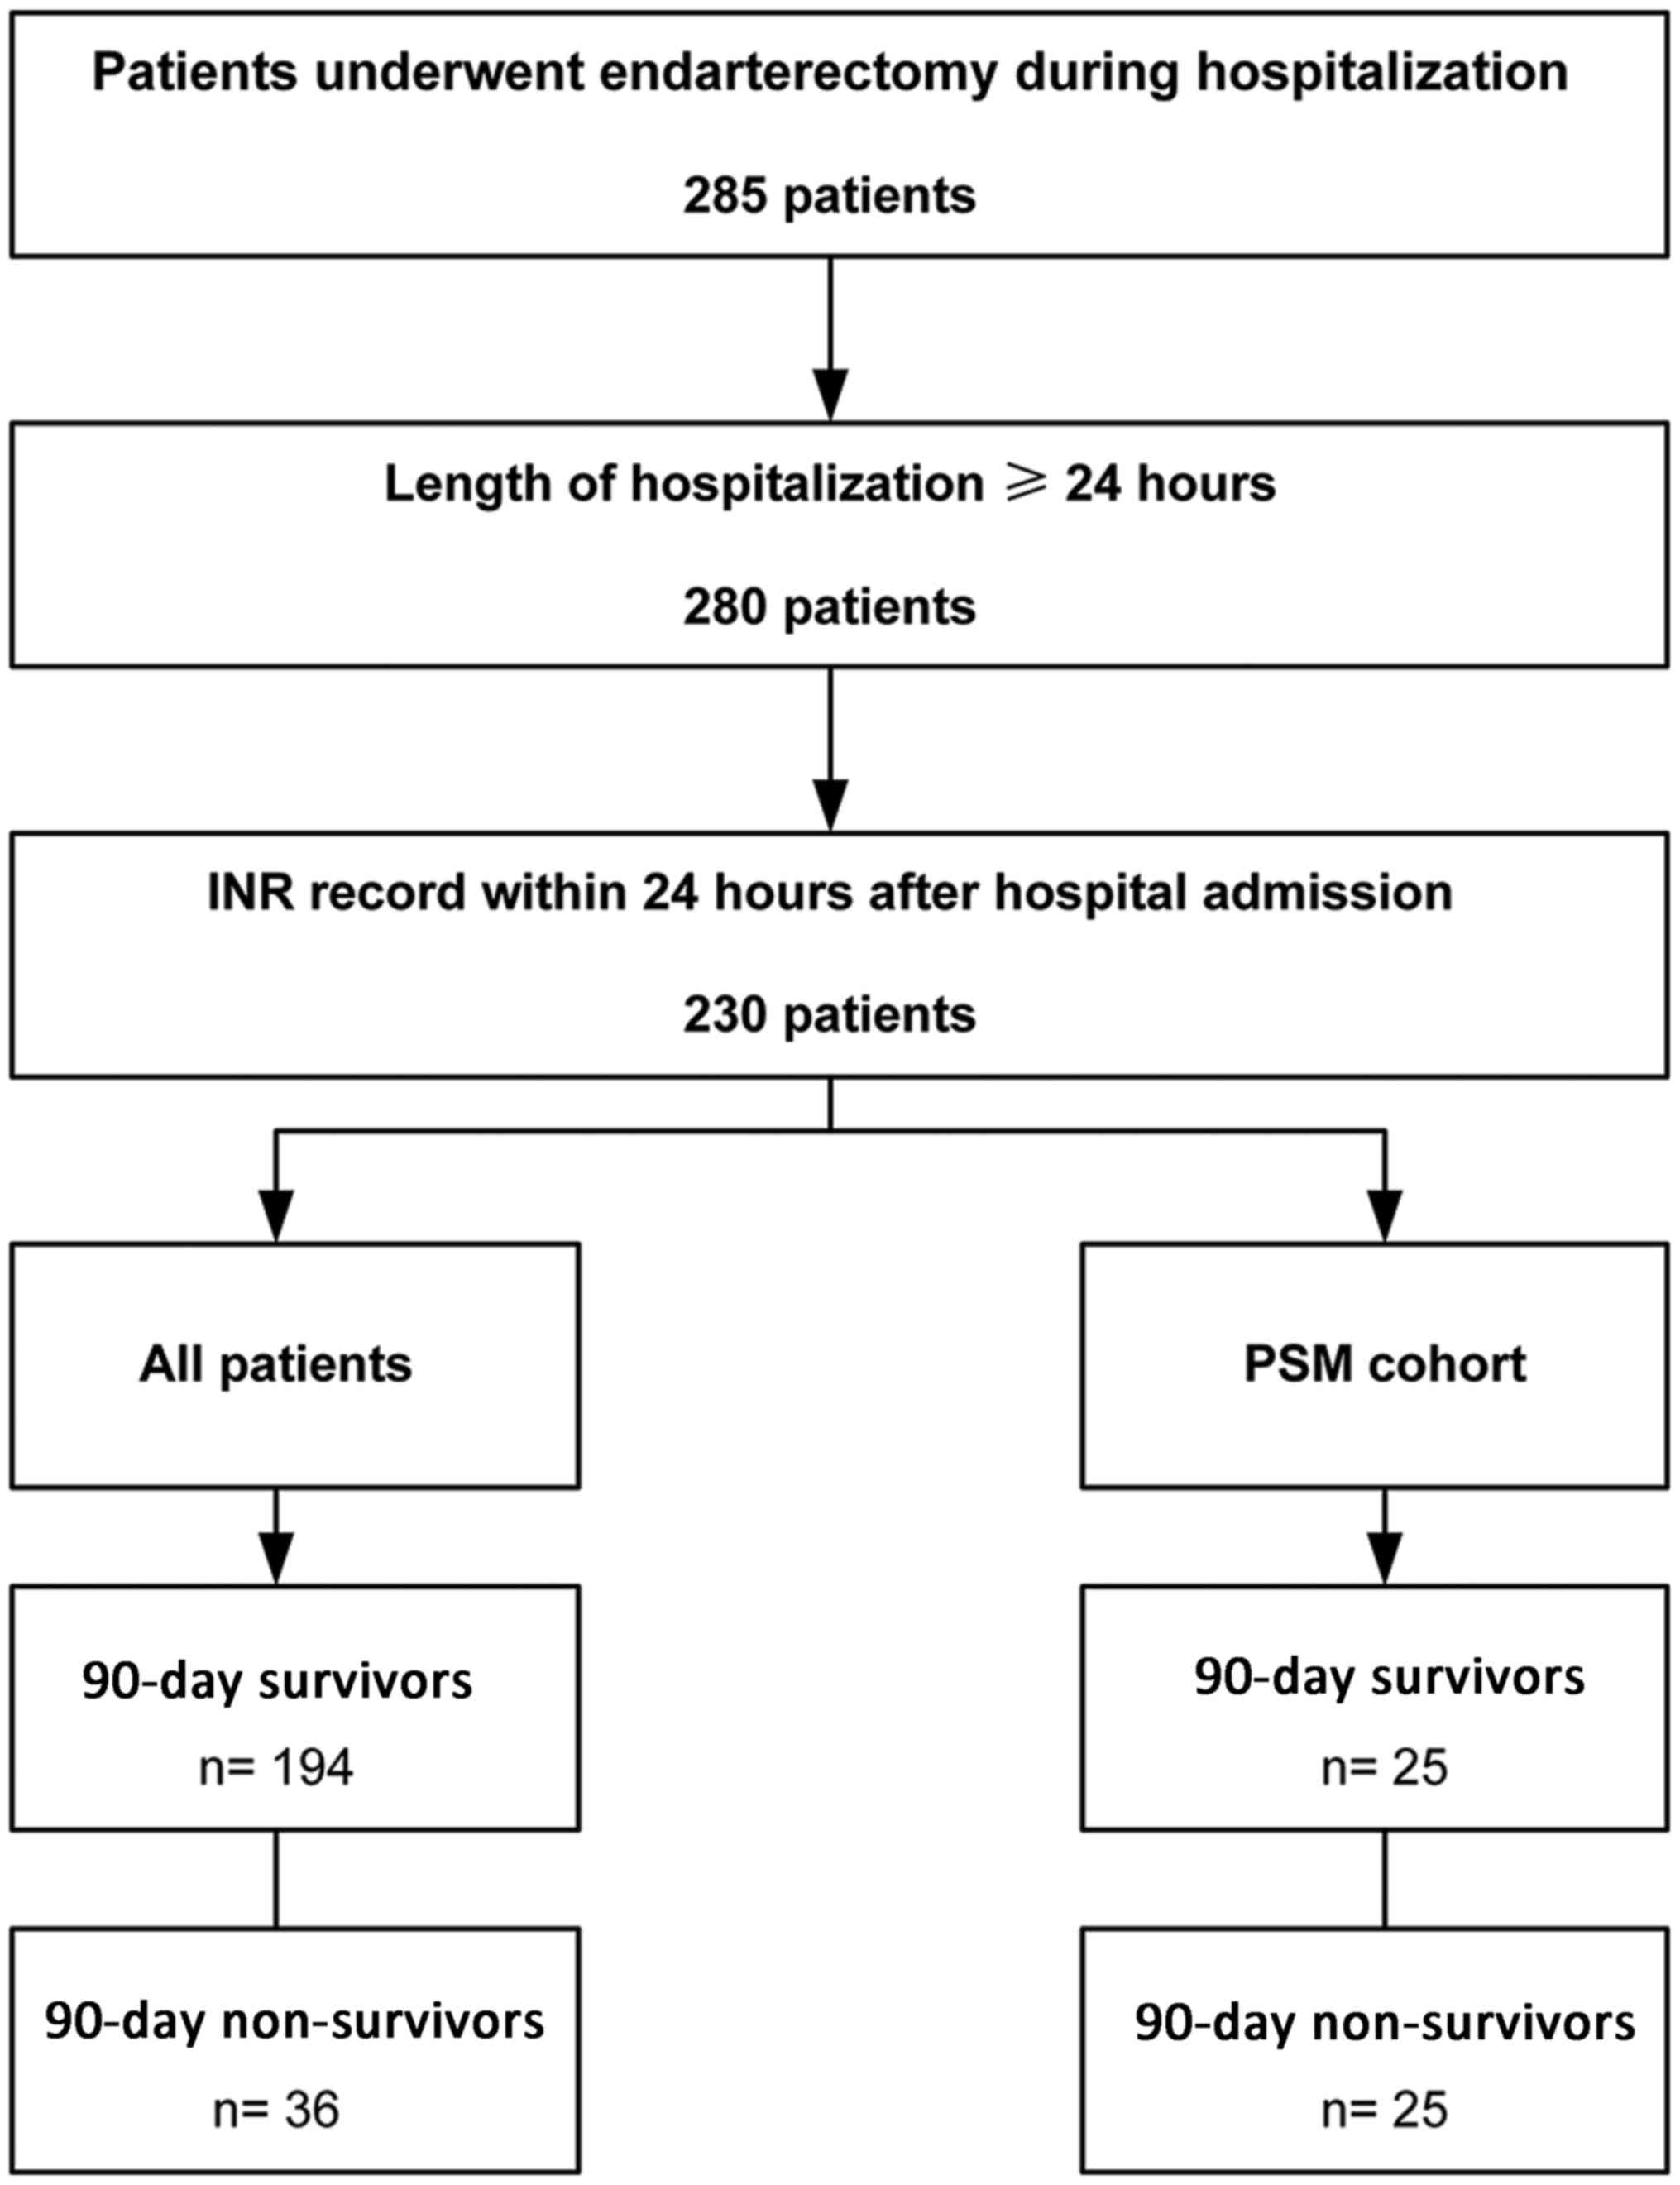
Patients with endarterectomy records during
hospitalization were identified by International Classification of
Diseases, Ninth Revision procedure codes (381.0–381.6, 381.8) and
included. Patients that were ≥18 years of age who remained in
hospital for ≥1 day were included into the present study. Patients
were excluded from the current study if their INR records were
obtained >24 h following hospitalization (Fig. 1). A total of 230 patients were
included into the present study. The median age of the patients was
74.61 years (IQR 67.33–81.34 years) and 121 of the 230 cases
(52.61%) were male.
Variables
Structured Query Language was applied to extract
data from the database primarily using codes obtained from the
Medical Information Mart for Intensive Care Code Repository
(github.com/MIT-LCP/mimic-code)
(12). The following variables were
extracted or calculated: Age, sex, 90-day mortality, hospital
mortality, length of hospital stay, INR, simplified acute
physiology score II (SAPS II) (13),
Elixhauser comorbidities (14), the
Elixhauser Comorbidity Index (SID30) (15), primary diagnosis and type of
endarterectomy. Missing components for the calculation of SAPS II
were treated as normal (usually 0) (12).
Outcomes
The 90-day mortality following hospital admission
was selected as the primary outcome prior to data extraction and
analysis. Hospital mortality was considered to be the secondary
outcome. The length of hospitalization was calculated only for
statistical description.
Propensity score matching (PSM)
Patients were categorized as survivors or
non-survivors according to their 90-day survival status following
hospital admission. The propensity score for each patient was
calculated to estimate the probability of mortality in the first 90
days following hospital admission using multivariable logistic
regression models that adjusted the following covariates: Age, sex,
SAPS II, SID30, type of endarterectomy and comorbidities, which
included the following: Congestive heart failure, cardiac
arrhythmia, valvular disease, pulmonary circulation disorder,
peripheral vascular disorder, hypertension, paralysis, other
neurological diseases, chronic pulmonary disease, uncomplicated
diabetes, complicated diabetes, hypothyroidism, renal failure,
liver disease, lymphoma, metastatic cancer, solid tumor, rheumatoid
arthritis, coagulopathy, obesity, weight loss, fluid and
electrolyte disorders, blood loss anemia, deficiency anemia,
alcohol abuse, drug abuse, psychosis and depression. Matching was
performed using a 1:1 matching protocol without replacement
(greedy-matching algorithm), with a caliper width equal to 0.05 of
the standard deviation of the logit of the propensity score.
Statistical analysis
Data are presented as the median and interquartile
range (IQR) for continuous variables and as numbers and percentages
for categorical variables. The comparisons of continuous and
categorical variables were performed using Kruskal Wallis and
Χ2 (or Fisher's exact) tests, respectively. Receiver
operating characteristic (ROC) curves were performed to evaluate
the prognostic predictive value of INR for 90-day mortality and
hospital mortality. The best cut-off value was determined using
Youden's Index and patients were subsequently grouped as high and
low INR according to this cut-off value. Kaplan-Meier curves were
plotted and log-rank tests were used to compare survival between
the two groups. Variables associated with 90-day mortality were
evaluated using univariate Cox regression analysis and those with a
value of P<0.1 were included in the multivariable Cox regression
model. Age was not included in the multivariable regression
analysis since it was factored into SAPS II. The multivariable Cox
regression model was performed to evaluate the association of INR
with 90-day mortality and the multivariable logistic regression
model was used to evaluate the association of INR with hospital
mortality. P<0.05 was considered to indicate a statistically
significant difference. Empower(R) (www.empowerstats.com; X&Y Solutions, Inc., Boston
MA) and R software (version 3.4.3; www.r-project.org) were used for statistical
analyses.
Results
Characteristics of the patients
The median admission INR was 1.30 (IQR, 1.10–1.40)
with a median SAPS II score of 36 (IQR, 29–43; Table I). A total of 42.61% patients
underwent lower limb artery endarterectomy, 31.74% underwent
carotid endarterectomy, 22.61% underwent aorta endarterectomy and
9.13% underwent abdominal artery endarterectomy (Table II). The five most common
comorbidities were peripheral vascular disorder (53.04%), chronic
pulmonary disease (31.30%), uncomplicated diabetes (30.43%), fluid
and electrolyte disorders (22.61%), and renal failure (21.74%). The
90-day mortality was 15.65% with 36 non-survivors and 194 survivors
(Table I). The median length of
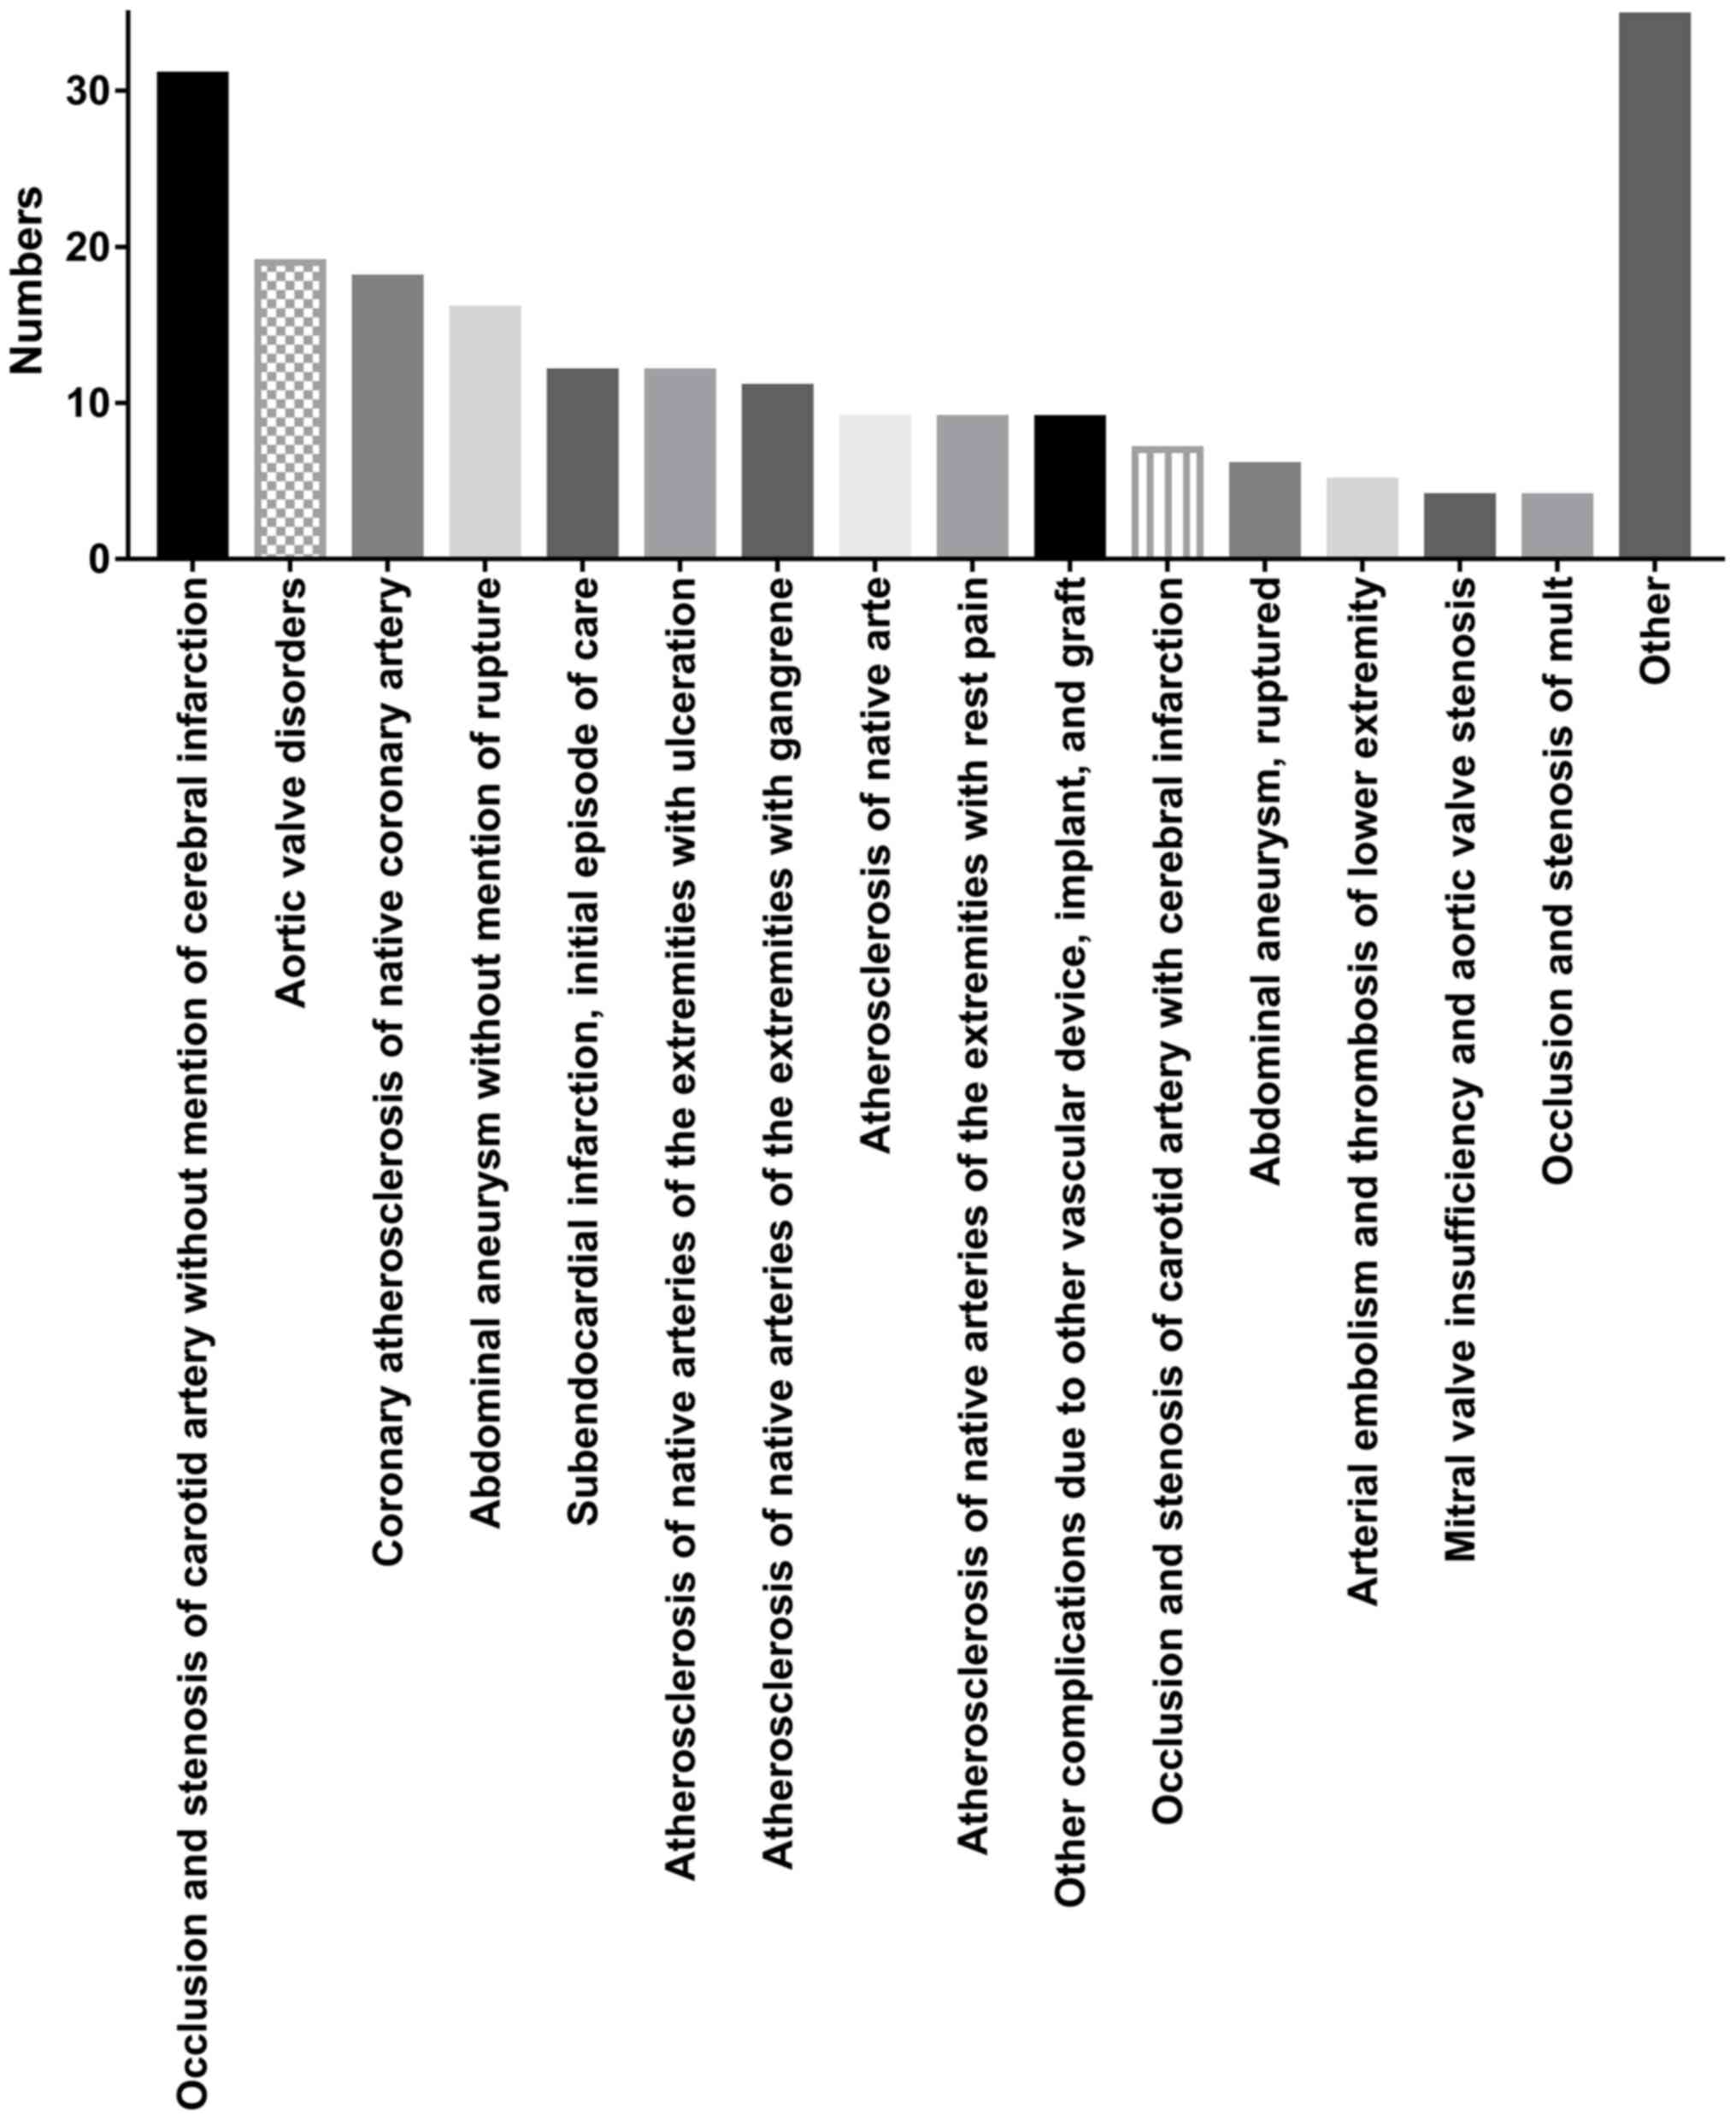
hospital stay was 10.89 days (IQR, 6.94–17.92). Primary patient
diagnoses are presented in Fig. 2.
The five most common primary diagnoses were occlusion and stenosis
of carotid artery without cerebral infarction, aortic valve
disorders, coronary atherosclerosis of native coronary artery,
abdominal aneurysm without rupture and subendocardial infarction. A
total of 25 non-survivors were successfully matched with one
control. The characteristics of the PSM cohort are presented in
Tables III and IV. Patients with a high INR on admission
still exhibited a higher 90-day mortality than those with a low INR
(86.67 vs. 34.29%; P=0.001). No statistically significant
difference was identified between survivors and non-survivors in
age, sex, SAPS II on admission and SID30 (data not shown).
 | Table I.Characteristics of all patients. |
Table I.
Characteristics of all patients.
| Variable | All patients
(n=230) | INR <1.5
(n=175) | INR ≥1.5 (n=55) | P-value |
|---|
| Age (years) | 74.61
(67.33–81.34) | 73.63
(66.68–81.26) | 76.53
(68.68–81.46) | 0.350 |
| Male | 121 (52.61%) | 91 (52.00%) | 30 (54.55%) | 0.742 |
| 90-day mortality | 36 (15.65%) | 20 (11.43%) | 16 (29.09%) | 0.003 |
| Hospital
mortality | 22 (9.57%) | 11 (6.29%) | 11 (20.00%) | 0.006 |
| Median length of
hospital stay (days) | 10.89
(6.94–17.92) | 10.53
(6.57–15.79) | 13.39
(8.44–24.71) | 0.013 |
| INR on admission | 1.30 (1.10–1.40) | 1.20 (1.10–1.30) | 2.00 (1.60–2.50) | <0.001 |
| SAPS II on
admission | 36 (29–43) | 35 (29–42) | 39 (31.5–46.25) | 0.132 |
| SID30 | 9.00
(3.00–19.00) | 7.00
(2.00–15.00) | 16.00
(4.00–24.50) | 0.002 |
| Table II.Types of endarterectomy and
comorbidities of all patients. |
Table II.
Types of endarterectomy and
comorbidities of all patients.
| Variable | All patients (n=230)
(%) | INR <1.5 (n=175)
(%) | INR ≥1.5 (n=55)
(%) | P-value |
|---|
| Endarterectomy |
|
|
|
|
| Other
vessels of head and neck | 73 (31.74) | 61 (34.86) | 12 (21.82) | 0.070 |
|
Aorta | 52 (22.61) | 36 (20.57) | 16 (29.09) | 0.188 |
| Other
thoracic vessels | 1 (0.43) | 1 (0.57) | 0 (0.00) | 1.000 |
| Abdominal
arteries | 21 (9.13) | 15 (8.57) | 6 (10.91) | 0.596 |
| Lower
limb arteries | 98 (42.61) | 75 (42.86) | 23 (41.82) | 0.892 |
| Comorbidities |
|
|
|
|
|
Congestive heart failure | 21 (9.13) | 14 (8.00) | 7 (12.73) | 0.291 |
| Cardiac
arrhythmias | 31 (13.48) | 20 (11.43) | 11 (20.00) | 0.116 |
|
Valvular disease | 9 (3.91) | 6 (3.43) | 3 (5.45) | 0.450 |
|
Pulmonary circulation
disorder | 1 (0.43) | 0 (0.00) | 1 (1.82) | 0.239 |
|
Peripheral vascular
disorder | 122 (53.04) | 87 (49.71) | 35 (63.64) | 0.071 |
|
Hypertension | 40 (17.39) | 29 (16.57) | 11 (20.00) | 0.546 |
|
Paralysis | 6 (2.61) | 3 (1.71) | 3 (5.45) | 0.150 |
| Other
neurological disease | 10 (4.35) | 6 (3.43) | 4 (7.27) | 0.256 |
| Chronic
pulmonary disease | 72 (31.30) | 57 (32.57) | 15 (27.27) | 0.460 |
|
Uncomplicated diabetes | 70 (30.43) | 54 (30.86) | 16 (29.09) | 0.804 |
|
Complicated diabetes | 30 (13.04) | 22 (12.57) | 8 (14.55) | 0.654 |
|
Hypothyroidism | 24 (10.43) | 21 (12.00) | 3 (5.45) | 0.211 |
| Renal
failure | 50 (21.74) | 36 (20.57) | 14 (25.45) | 0.444 |
| Liver
disease | 8 (3.48) | 4 (2.29) | 4 (7.27) | 0.096 |
|
Lymphoma | 2 (0.87) | 2 (1.14) | 0 (0.00) | 1.000 |
|
Metastatic cancer | 3 (1.30) | 2 (1.14) | 1 (1.82) | 0.561 |
| Solid
tumor | 2 (0.87) | 2 (1.14) | 0 (0.00) | 1.000 |
|
Rheumatoid arthritis | 7 (3.04) | 5 (2.86) | 2 (3.64) | 0.673 |
|
Coagulopathy | 34 (14.78) | 20 (11.43) | 14 (25.45) | 0.016 |
|
Obesity | 12 (5.22) | 11 (6.29) | 1 (1.82) | 0.302 |
| Weight
loss | 9 (3.91) | 6 (3.43) | 3 (5.45) | 0.450 |
| Fluid
and electrolyte disorders | 52 (22.61) | 34 (19.43) | 18 (32.73) | 0.040 |
| Blood
loss anemia | 3 (1.30) | 1 (0.57) | 2 (3.64) | 0.143 |
|
Deficiency anemia | 37 (16.09) | 26 (14.86) | 11 (20.00) | 0.401 |
| Alcohol
abuse | 6 (2.61) | 6 (3.43) | 0 (0.00) | 0.340 |
| Drug
abuse | 1 (0.43) | 1 (0.57) | 0 (0.00) | 1.000 |
|
Psychoses | 2 (0.87) | 2 (1.14) | 0 (0.00) | 1.000 |
|
Depression | 7 (3.04) | 4 (2.29) | 3 (5.45) | 0.362 |
| Table III.Characteristics of the PSM
cohort. |
Table III.
Characteristics of the PSM
cohort.
| Variable | All patients
(n=50) | INR <1.5
(n=35) | INR ≥1.5
(n=15) | P-value |
|---|
| Age (years) | 77.81
(69.94–82.76) | 76.68
(69.31–82.41) | 80.84
(76.61–82.89) | 0.208 |
| Male | 35 (70.00%) | 26 (74.29%) | 9 (60.00%) | 0.333 |
| 90-day
mortality | 25 (50.00%) | 12 (34.29%) | 13 (86.67%) | 0.001 |
| Hospital
mortality | 16 (32.00%) | 6 (17.14%) | 10 (66.67%) | 0.002 |
| Length of hospital
stay (days) | 13.04
(9.71–24.62) | 12.90
(9.98–23.01) | 19.89
(9.27–29.73) | 0.619 |
| INR on
admission | 1.30
(1.20–1.75) | 1.20
(1.10–1.30) | 2.30
(1.80–3.45) | <0.001 |
| SAPS II on
admission | 41.5 (33–55) | 42 (34–55) | 39 (33–48) | 0.596 |
| SID30 | 12.50
(3.25–19.75) | 12.00
(3.00–16.50) | 18.00
(6.50–24.50) | 0.155 |
| Table IV.Types of endarterectomy and
comorbidities of the PSM cohort. |
Table IV.
Types of endarterectomy and
comorbidities of the PSM cohort.
| Variable | All patients (n=50)
(%) | INR <1.5 (n=35)
(%) | INR ≥1.5 (n=15)
(%) | P-value |
|---|
| Endarterectomy |
|
|
|
|
| Other
vessels of head and neck | 9 (18.00) | 8 (22.86) | 1 (6.67) | 0.247 |
|
Aorta | 8 (16.00) | 5 (14.29) | 3 (20.00) | 0.683 |
|
Abdominal arteries | 3 (6.00) | 1 (2.86) | 2 (13.33) | 0.211 |
| Lower
limb arteries | 31 (62.00) | 22 (62.86) | 9 (60.00) | 1.000 |
| Comorbidities |
|
|
|
|
|
Congestive heart failure | 3 (6.00) | 3 (8.57) | 0 (0.00) | 0.545 |
| Cardiac
arrhythmias | 5 (10.00) | 4 (11.43) | 1 (6.67) | 1.000 |
|
Valvular disease | 2 (4.00) | 1 (2.86) | 1 (6.67) | 0.514 |
|
Peripheral vascular
disorder | 30 (60.00) | 19 (54.29) | 11 (73.33) | 0.345 |
|
Hypertension | 14 (28.00) | 10 (28.57) | 4 (26.67) | 1.000 |
|
Paralysis | 1 (2.00) | 1 (2.86) | 0 (0.00) | 1.000 |
| Other
neurological disease | 2 (4.00) | 1 (2.86) | 1 (6.67) | 0.514 |
| Chronic
pulmonary disease | 14 (28.00) | 9 (25.71) | 5 (33.33) | 0.733 |
|
Uncomplicated diabetes | 4 (8.00) | 1 (2.86) | 3 (20.00) | 0.075 |
|
Complicated diabetes | 4 (8.00) | 2 (5.71) | 2 (13.33) | 0.574 |
|
Hypothyroidism | 2 (4.00) | 1 (2.86) | 1 (6.67) | 0.514 |
| Renal
failure | 15 (30.00) | 11 (31.43) | 4 (26.67) | 1.000 |
| Liver
disease | 2 (4.00) | 0 (0.00) | 2 (13.33) | 0.086 |
| Solid
tumor | 1 (2.00) | 1 (2.86) | 0 (0.00) | 1.000 |
|
Rheumatoid arthritis | 1 (2.00) | 0 (0.00) | 1 (6.67) | 0.300 |
|
Coagulopathy | 11 (22.00) | 6 (17.14) | 5 (33.33) | 0.269 |
|
Obesity | 3 (6.00) | 3 (8.57) | 0 (0.00) | 0.545 |
| Weight
loss | 3 (6.00) | 1 (2.86) | 2 (13.33) | 0.211 |
| Fluid
and electrolyte disorders | 16 (32.00) | 9 (25.71) | 7 (46.67) | 0.191 |
|
Deficiency anemia | 5 (10.00) | 3 (8.57) | 2 (13.33) | 0.629 |
| Alcohol
abuse | 1 (2.00) | 1 (2.86) | 0 (0.00) | 1.000 |
|
Depression | 1 (2.00) | 0 (0.00) | 1 (6.67) | 0.300 |
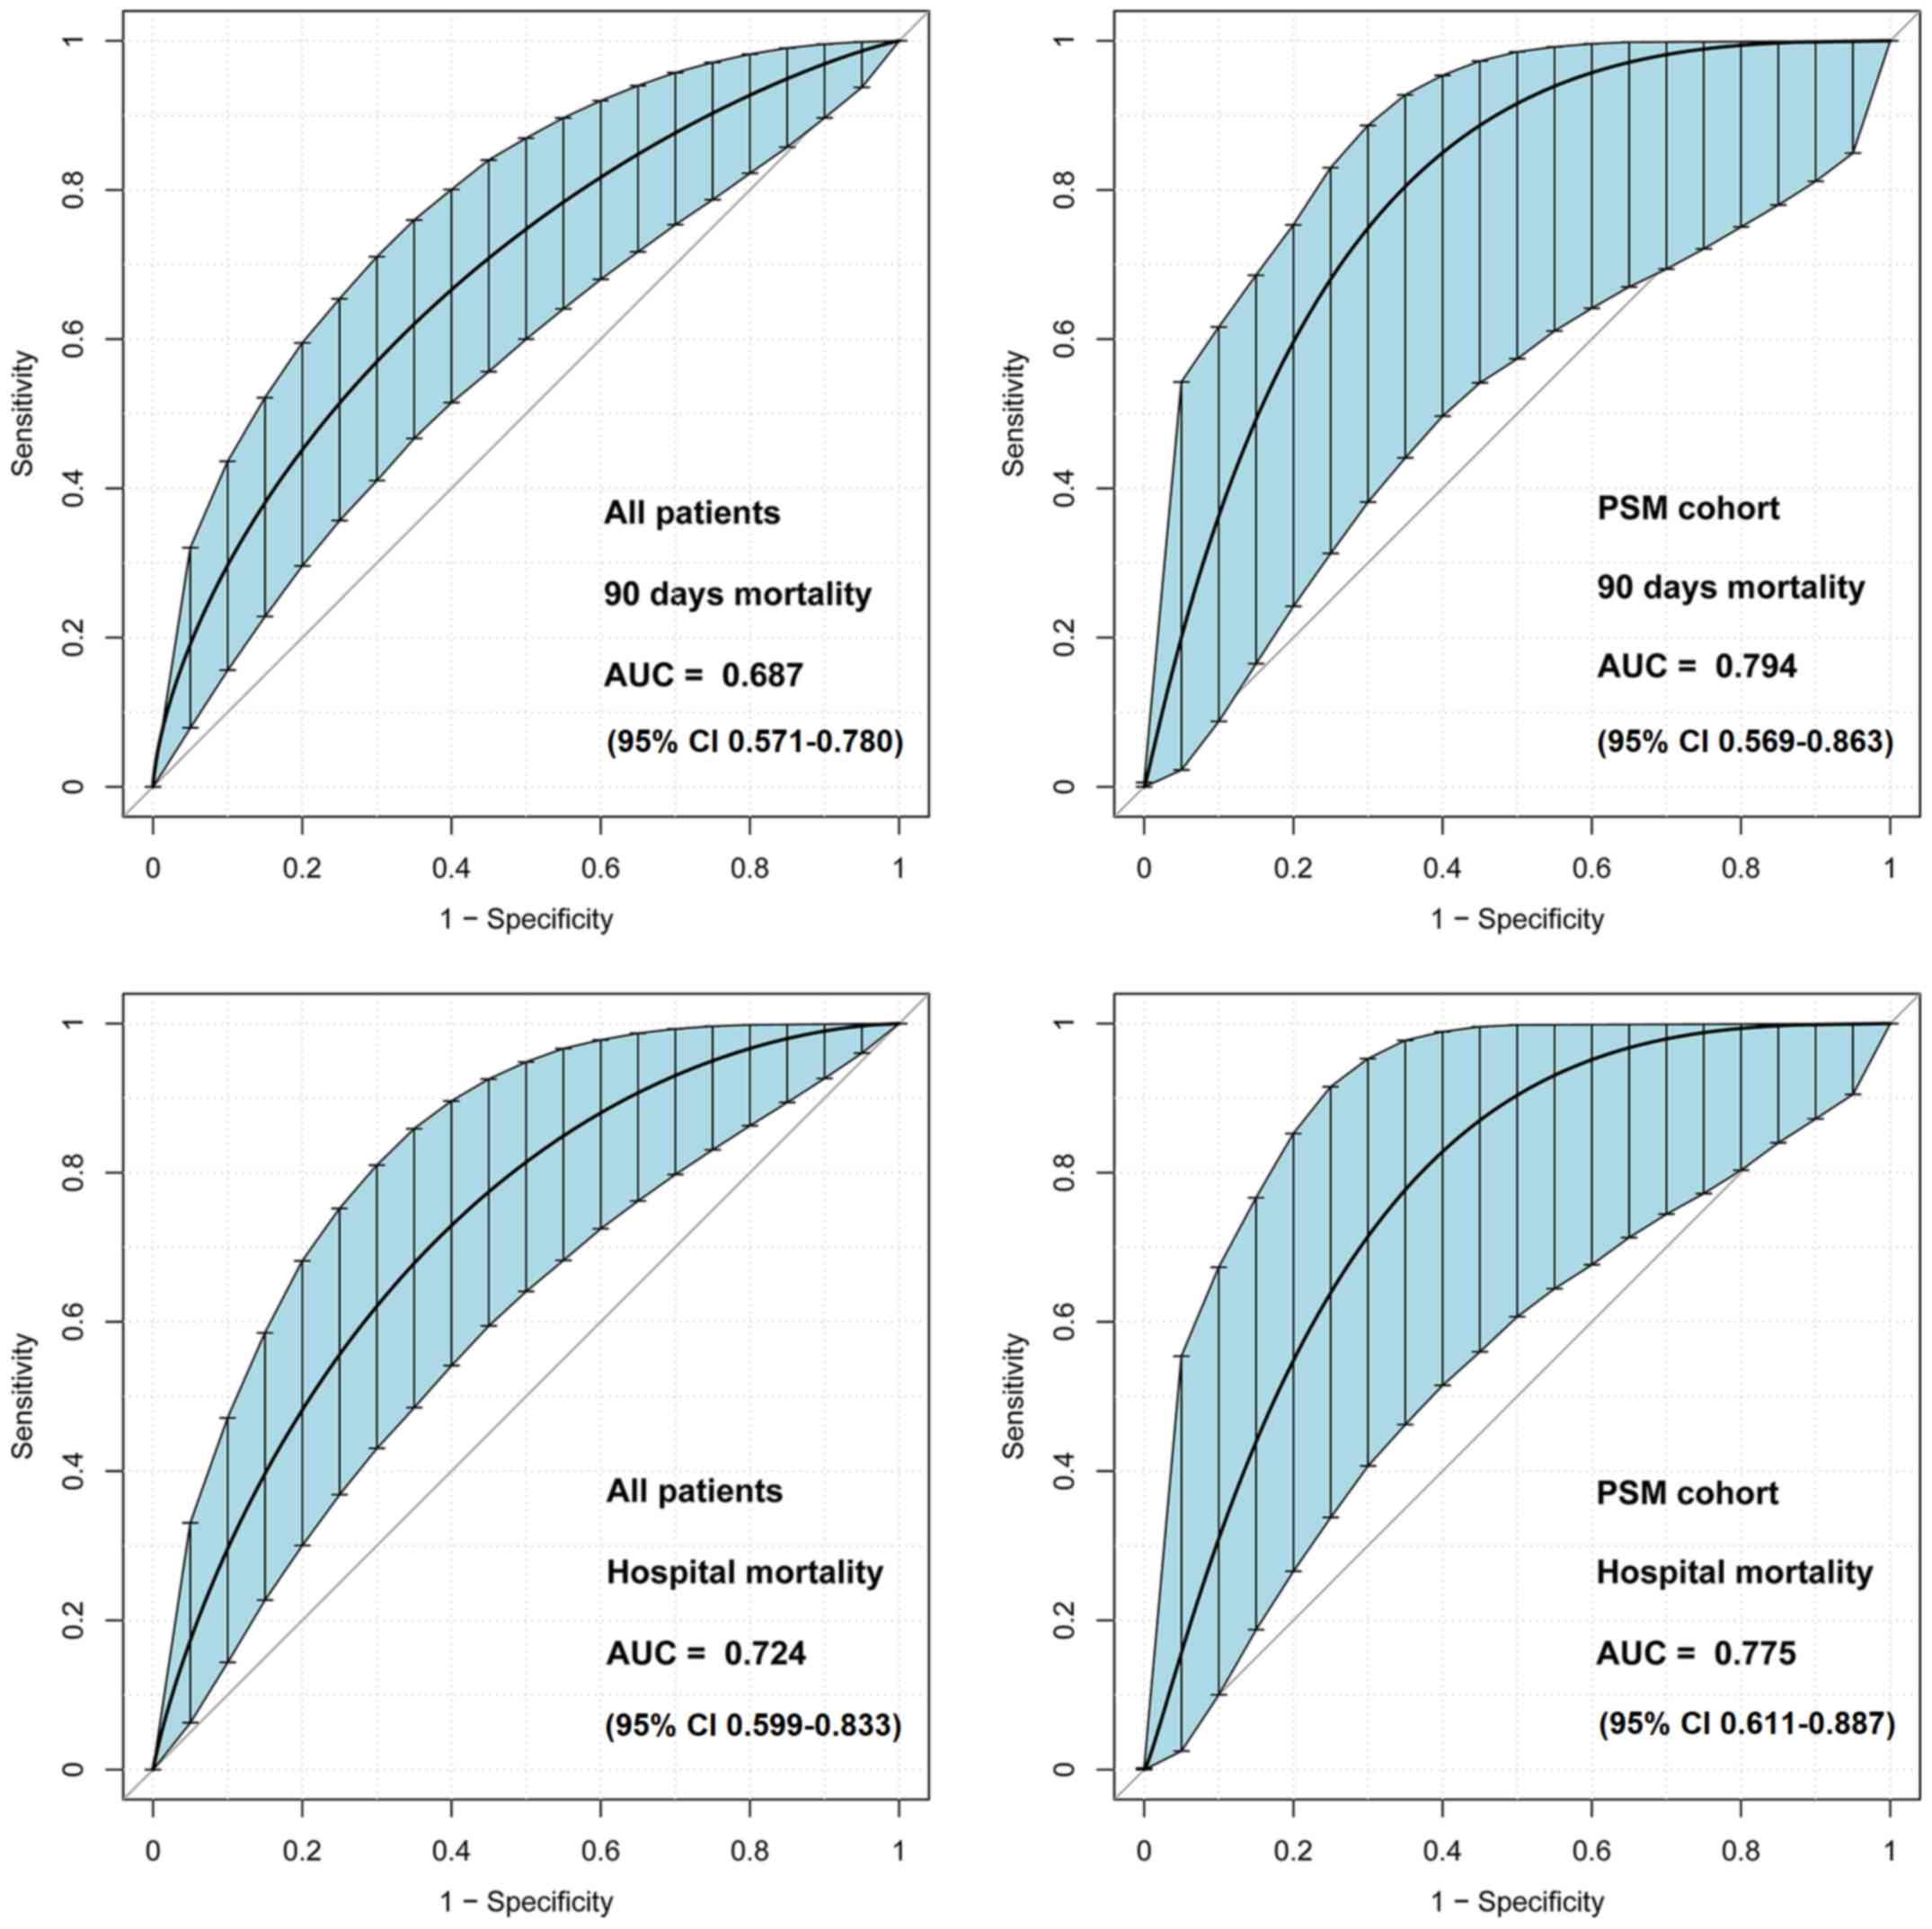
ROC curve analysis
Area under the ROC curve values of admission INR for
the discrimination of 90-day survivors and non-survivors were 0.687
(95% CI, 0.571–0.780) and 0.794 (95% CI, 0.569–0.863) in all
patients and the PSM cohort, respectively (Fig. 3). The best cut-off value of INR was
1.55, as determined using Youden's index. Therefore, patients were
further categorized as high INR (INR ≥1.5) and low INR (INR
<1.5).
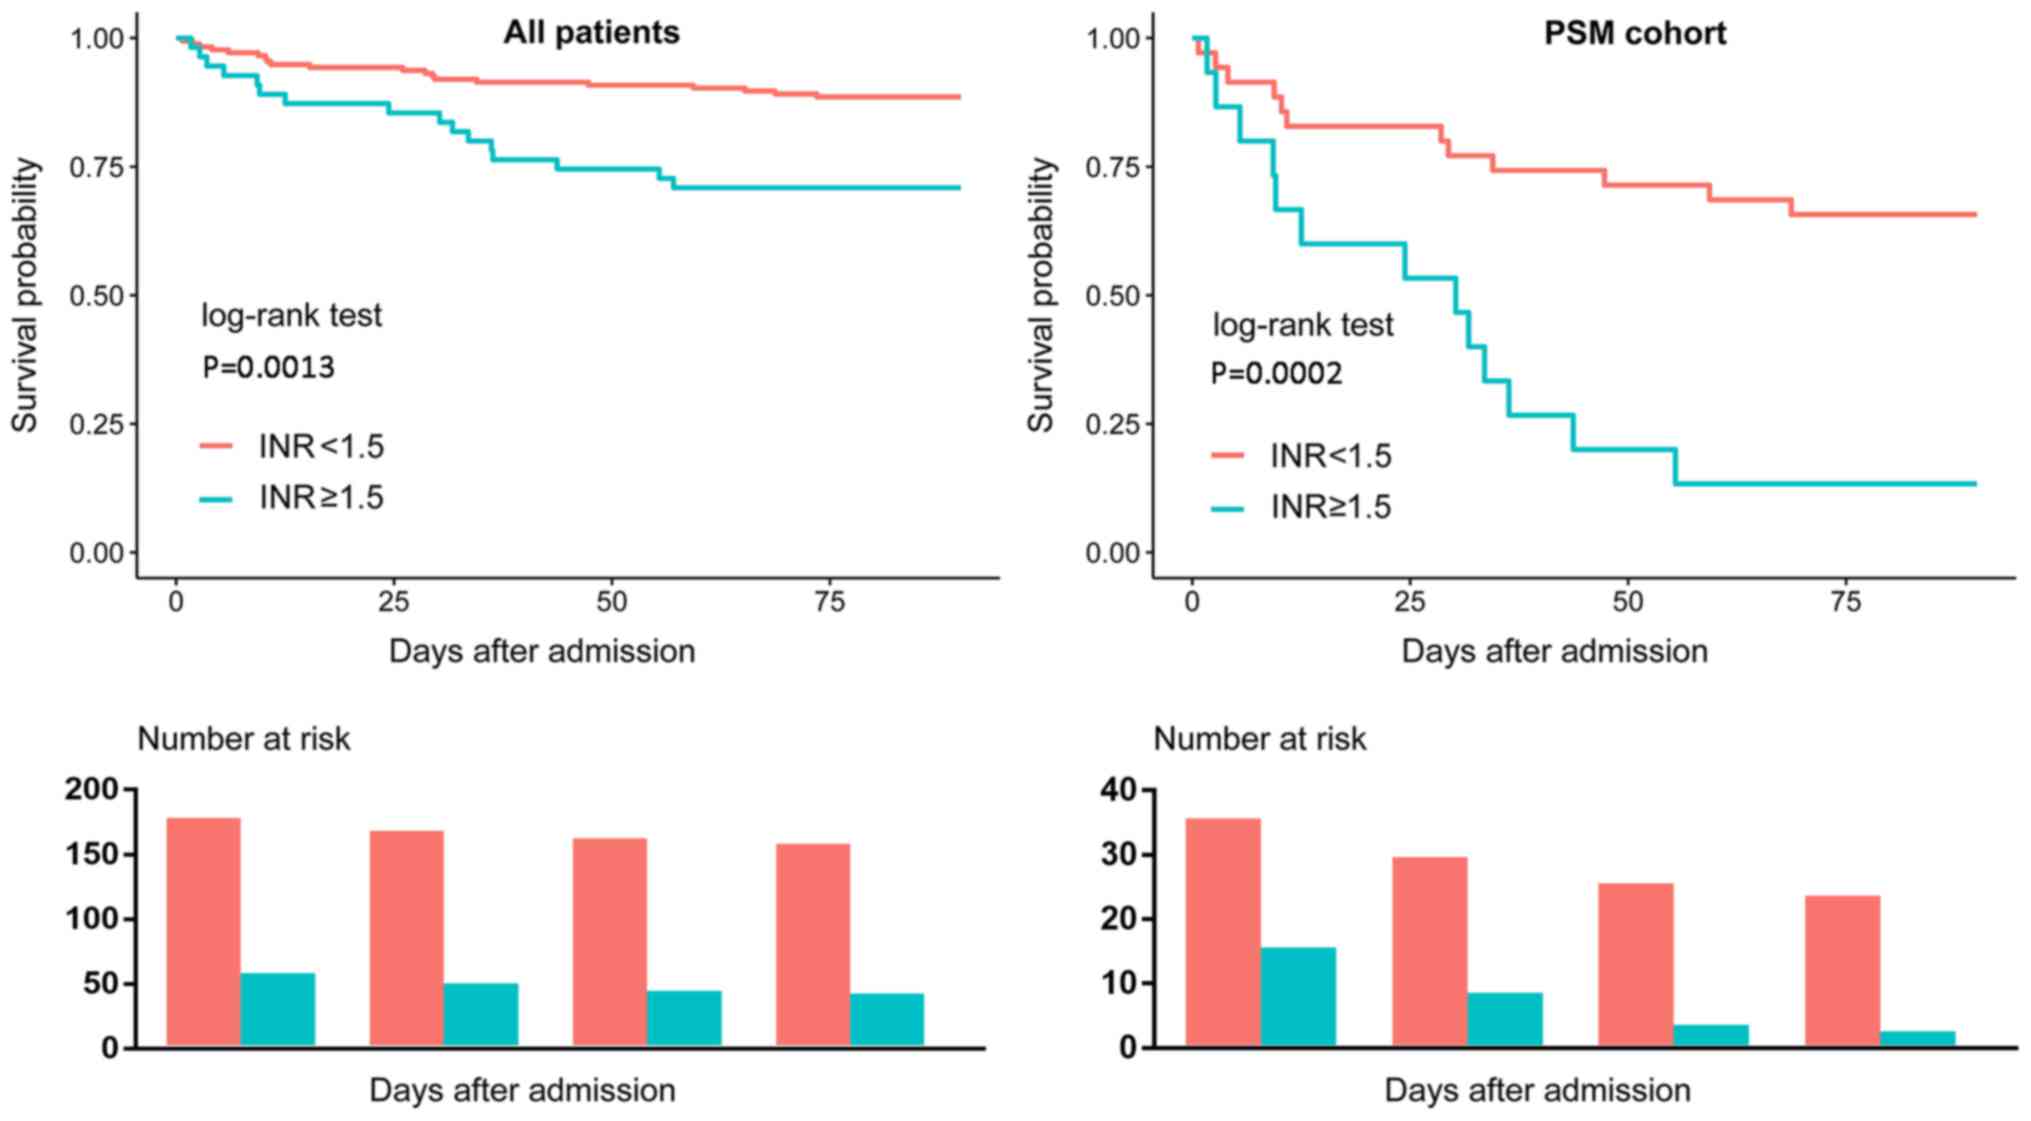
Clinical outcomes of patients with
different INR levels on admission
As presented in Tables
I and III, patients with a
high INR exhibited a significantly higher 90-day mortality compared
with patients with a low INR. Kaplan-Meier curves also demonstrated
similar results (Fig. 4).
Additionally, patients with a high INR exhibited a higher hospital
mortality than those with a low INR; however, there was no
significant difference of length of hospital stay according to the
PSM cohort analyses.
Association of INR levels on admission
and clinical outcomes
The results of the univariate Cox regression
analysis of all patients and the PSM cohort are presented in
Tables V and VI, respectively. SAPS II, INR and SID30
were significantly associated with the 90-day mortality of all
patients. Multivariable regression analysis (Table VII) indicated that a high INR was
an independent risk factor of 90-day mortality (hazard ratio, 2.19;
95% CI, 1.08–4.45) and hospital mortality (odds ratio 2.59, 95% CI
1.01–6.66). The results of the PSM cohort regression analysis are
also presented in Table VII, which
indicated a significant association of a high INR with 90-day
mortality (hazard ratio, 4.18; 95% CI, 1.86–9.38) and hospital
mortality (odds ratio 9.67; 95% CI 2.41–38.71).
| Table V.Univariate Cox regression analysis of
the 90-day mortality of all patients. |
Table V.
Univariate Cox regression analysis of
the 90-day mortality of all patients.
| Variable | HR | 95% CI | P-value |
|---|
| Age (years) | 1.00 | 1.00–1.01 | 0.0498 |
| Sex |
|
|
|
|
Male | 1.00 |
|
|
|
Female | 0.69 | 0.35–1.35 | 0.2748 |
| SAPS II | 1.03 | 1.01–1.05 | 0.0076 |
| INR |
|
|
|
|
<1.5 | 1.00 |
|
|
|
≥1.5 | 2.81 | 1.46–5.43 | 0.0021 |
| SID30 | 1.04 | 1.01–1.07 | 0.0029 |
| Table VI.Univariate Cox regression analysis of
the 90-day mortality of the PSM. |
Table VI.
Univariate Cox regression analysis of
the 90-day mortality of the PSM.
| Variable | HR | 95% CI | P-value |
|---|
| Age (years) | 1.00 | 0.99–1.01 | 0.4658 |
| Sex |
|
|
|
|
Male | 1.00 |
|
|
|
Female | 1.22 | 0.53–2.84 | 0.6389 |
| SAPS II | 0.99 | 0.97–1.02 | 0.6438 |
| INR |
|
|
|
|
<1.5 | 1.00 |
|
|
|
≥1.5 | 4.18 | 1.86–9.38 | 0.0005 |
| SID30 | 0.99 | 0.96–1.03 | 0.7377 |
| Table VII.Associations of INR with 90-day
mortality and hospital mortality. |
Table VII.
Associations of INR with 90-day
mortality and hospital mortality.
| A, All
patients |
|---|
|
|---|
| Subjects | HR/OR | 95% CI | P-value |
|---|
| 90-day
mortality |
|
|
|
| Non-adjusted |
|
|
|
|
INR<1.5 | 1.00 |
|
|
|
INR≥1.5 | 2.81 | 1.46–5.43 | 0.0021 |
| Adjusted |
|
|
|
|
INR<1.5 | 1.00 |
|
|
|
INR≥1.5 | 2.19 | 1.08–4.45 | 0.0305 |
| Hospital
mortality |
|
|
|
|
Non-adjusted |
|
|
|
|
INR<1.5 | 1.00 |
|
|
|
INR≥1.5 | 3.73 | 1.52–9.16 | 0.0041 |
| Adjusted |
|
|
|
|
INR<1.5 | 1.00 |
|
|
|
INR≥1.5 | 2.59 | 1.01–6.66 | 0.0481 |
|
| B, PSM
cohort |
|
|
Subjects | HR/OR | 95% CI | P-value |
|
| 90-day
mortality |
|
|
|
| Non-adjusted |
|
|
|
|
INR<1.5 | 1.00 |
|
|
|
INR≥1.5 | 4.18 | 1.86–9.38 | 0.0005 |
| Hospital
mortality |
|
|
|
| Non-adjusted |
|
|
|
|
INR<1.5 | 1.00 |
|
|
|
INR≥1.5 | 9.67 | 2.41–38.71 | 0.0014 |
Discussion
The present study examined the association of INR on
hospital admission and clinical outcomes in critically ill patients
who underwent endarterectomy during hospitalization. To the best of
our knowledge, the current study is the first to focus on the
association of INR and the outcome of patients undergoing
endarterectomy. The results indicated that a high INR on admission
predicted a poorer long-term patient outcome.
A high INR has been determined to be a marker for
bleeding risk (16). For example, an
INR >4 is associated with an increased risk of bleeding
(17) and the risk of intracranial
haemorrhage increases ~2-fold for every 1 unit rise in INR
(18). Therefore, it is reasonable
to assume that patients with a higher INR may have poorer clinical
outcomes, regardless of the conditions that they suffer. However,
Hansen et al (19) did not
identify any clinically relevant difference in the INR values of
patients who did or did not develop pulmonary embolism.
Furthermore, Adike et al (20) demonstrated that INR was not a
significant factor in the prediction of bleeding risk in patients
with cirrhosis following endoscopic retrograde
cholangiopancreatography. Therefore, it remains unknown whether INR
levels are associated with the outcome of patients undergoing
endarterectomy. As aforementioned, critically ill patients
undergoing endarterectomy exhibited a markedly higher mortality
rate (5). Therefore, it is necessary
to determine whether the association exists in critically ill
patients. The results of the current study indicated that the risk
of 90-mortality increased 1.19-fold for critically ill patients
undergoing endarterectomy with a high INR, compared with patients
with a low INR, which might be helpful when deciding whether to
perform endarterectomy on critically ill patients.
Several limitations of the present study need to be
discussed. Although the focus of the current study was on
critically ill patients, such individuals are difficult to define.
The patients involved in the current study came from the critical
care medicine database and had mostly been admitted to the
intensive care unit during their hospitalization. The primary
diagnosis of the study populations varied and this was not adjusted
in the analysis due to the limited sample size. A further
limitation is that INR fluctuations are common due to drug
interactions, changes in dietary vitamin K intake or other reasons
(21,22), which may affect INR levels on
admission. However, this information was difficult to obtain from
an electronic database retrospectively. Additionally, although a
high INR usually serves as a marker for increased bleeding risk,
numerous patients in the current study with prolonged INR do not
bleed (data not shown) and the cause of death was not specified due
to limited information. Therefore, despite the results of the
present study, it remains unknown whether a high INR increases the
risk of mortality by increasing bleeding risk.
Other limitations of the present study should be
discussed. Although PSM was performed to minimize selection bias,
and the analysis of all patients and the PSM cohort presented
consistent results, there remained potential unobserved confounding
factors which were unadjusted. For example, Mlejnsky et al
(23) identified that interleukin-6
(IL-6) may increase in patients following pulmonary endarterectomy;
however, whether it was associated with clinical outcome remained
unknown following the results of the current study, as IL-6 was not
available from the retrospective database. In addition, the sample
size of the PSM cohort was small, resulting in a broader confidence
interval of the effect. Given the observational nature of the
current study, it is not possible to conclude that the association
between admission INR and 90-day mortality reflects cause and
effect, so it remains unknown whether decreasing the INR levels of
critically ill patients could reduce the risk of mortality
following endarterectomy. The present study also included data from
only one centre, which may limit the external applicability of the
results.
In conclusion, an admission INR of ≥1.5 strongly
predicts the 90-day mortality of critically ill patients undergoing
endarterectomy. These patients may therefore require early
aggressive interventions and monitoring, with the aim of improving
patient outcome. However, further study is required to validate
this.
Acknowledgements
Not applicable.
Funding
No funding was received.
Availability of data and materials
The datasets generated and/or analysed during the
current study are available in the PhysioBank repository
(mimic.physionet.org).
Authors' contributions
M-YL designed the current study. M-YL, L-PT, and
Y-BY performed data extraction and analysis. YZ, Z-LG, and Q-GC
also conducted data analysis. All authors approved the final
version of the manuscript.
Ethics approval and consent to
participate
The access of the database was approved by the
institutional review boards of both Beth Israel Deaconess Medical
Centre and Massachusetts Institute of Technology Affiliates. No
informed consent was required because data are anonymized.
Patient consent for publication
Not applicable since the study did not include any
identifying information.
Competing interests
The authors declare that they have no competing
interests.
Glossary
Abbreviations
Abbreviations:
|
CI
|
confidence interval
|
|
INR
|
international normalized ratio
|
|
SAPS II
|
simplified acute physiology score
II
|
|
PSM
|
propensity score matching
|
|
IQR
|
interquartile range
|
|
ROC
|
receiver operating characteristic
|
|
OR
|
odds ratio
|
References
|
1
|
Thompson JE: The evolution of surgery for
the treatment and prevention of stroke. The Willis Lecture. Stroke.
27:1427–1434. 1996. View Article : Google Scholar : PubMed/NCBI
|
|
2
|
Sarkar R and Messina LM: Endarterectomy of
the abdominal aorta and its branchesVascular surgery. Lumley JSP
and Hoballah JJ: Berlin, Heidelberg: Springer Berlin Heidelberg;
pp. 209–230. 2009, View Article : Google Scholar
|
|
3
|
Kumamaru H, Jalbert JJ, Nguyen LL,
Gerhard-Herman MD, Williams LA, Chen CY, Seeger JD, Liu J, Franklin
JM and Setoguchi S: Surgeon case volume and 30-day mortality after
carotid endarterectomy among contemporary medicare beneficiaries:
Before and after national coverage determination for carotid artery
stenting. Stroke. 46:1288–1294. 2015. View Article : Google Scholar : PubMed/NCBI
|
|
4
|
Nguyen BN, Amdur RL, Abugideiri M, Rahbar
R, Neville RF and Sidawy AN: Postoperative complications after
common femoral endarterectomy. J Vasc Surg. 61:1489–1494. 2015.
View Article : Google Scholar : PubMed/NCBI
|
|
5
|
Knappich C, Kuehnl A, Tsantilas P, Schmid
S, Breitkreuz T, Kallmayer M, Zimmermann A and Eckstein HH: Patient
characteristics and in-hospital outcomes of emergency carotid
endarterectomy and carotid stenting after stroke in evolution. J
Vasc Surg. 68:436–444. 2018. View Article : Google Scholar : PubMed/NCBI
|
|
6
|
Power GS and Harrison DA: Why try to
predict ICU outcomes? Curr Opin Crit Care. 20:544–549. 2014.
View Article : Google Scholar : PubMed/NCBI
|
|
7
|
Verma A and Kole T: International
normalized ratio as a predictor of mortality in trauma patients in
India. World J Emerg Med. 5:192–195. 2014. View Article : Google Scholar : PubMed/NCBI
|
|
8
|
Leeper CM, Nasr I, McKenna C, Berger RP
and Gaines BA: Elevated admission international normalized ratio
strongly predicts mortality in victims of abusive head trauma. J
Trauma Acute Care Surg. 80:711–716. 2016. View Article : Google Scholar : PubMed/NCBI
|
|
9
|
Cao C, Martinelli A, Spoelhof B, Llinas RH
and Marsh EB: In potential stroke patients on warfarin, the
international normalized ratio predicts ischemia. Cerebrovasc Dis
Extra. 7:111–119. 2017. View Article : Google Scholar : PubMed/NCBI
|
|
10
|
Benediktsson S, Frigyesi A and Kander T:
Routine coagulation tests on ICU admission are associated with
mortality in sepsis: An observational study. Acta Anaesthesiol
Scand. 61:790–796. 2017. View Article : Google Scholar : PubMed/NCBI
|
|
11
|
Johnson AE, Pollard TJ, Shen L, Lehman LW,
Feng M, Ghassemi M, Moody B, Szolovits P, Celi LA and Mark RG:
MIMIC-III, a freely accessible critical care database. Sci Data.
3:1600352016. View Article : Google Scholar : PubMed/NCBI
|
|
12
|
Johnson A, Stone DJ, Celi LA and Pollard
TJ: The MIMIC code repository: Enabling reproducibility in critical
care research. J Am Med Inform Assoc. 25:32–39. 2018. View Article : Google Scholar : PubMed/NCBI
|
|
13
|
Le Gall JR, Lemeshow S and Saulnier F: A
new simplified acute physiology score (SAPS II) based on a
European/North American multicenter study. Jama. 270:2957–2963.
1993. View Article : Google Scholar : PubMed/NCBI
|
|
14
|
Steiner C, Elixhauser A and Schnaier J:
The healthcare cost and utilization project: An overview. Eff Clin
Pract. 5:143–151. 2002.PubMed/NCBI
|
|
15
|
Thompson NR, Fan Y, Dalton JE, Jehi L,
Rosenbaum BP, Vadera S and Griffith SD: A new Elixhauser-based
comorbidity summary measure to predict in-hospital mortality. Med
Care. 53:374–379. 2015. View Article : Google Scholar : PubMed/NCBI
|
|
16
|
Hylek EM, Regan S, Go AS, Hughes RA,
Singer DE and Skates SJ: Clinical predictors of prolonged delay in
return of the international normalized ratio to within the
therapeutic range after excessive anticoagulation with warfarin.
Ann Intern Med. 135:393–400. 2001. View Article : Google Scholar : PubMed/NCBI
|
|
17
|
Makris M, van Veen JJ and Maclean R:
Warfarin anticoagulation reversal: Management of the asymptomatic
and bleeding patient. J Thromb Thrombolysis. 29:171–181. 2010.
View Article : Google Scholar : PubMed/NCBI
|
|
18
|
Hylek EM and Singer DE: Risk factors for
intracranial hemorrhage in outpatients taking warfarin. Ann Intern
Med. 120:897–902. 1994. View Article : Google Scholar : PubMed/NCBI
|
|
19
|
Hansen P, Zmistowski B, Restrepo C,
Parvizi J and Rothman RH: Does international normalized ratio level
predict pulmonary embolism? Clin Orthop Relat Res. 470:547–554.
2012. View Article : Google Scholar : PubMed/NCBI
|
|
20
|
Adike A, Al-Qaisi M, Baffy NJ, Kosiorek H,
Pannala R, Aqel B, Faigel DO and Harrison ME: International
normalized ratio does not predict gastrointestinal bleeding after
endoscopic retrograde cholangiopancreatography in patients with
cirrhosis. Gastroenterology Res. 10:177–181. 2017. View Article : Google Scholar : PubMed/NCBI
|
|
21
|
Cropp JS and Bussey HI: A review of enzyme
induction of warfarin metabolism with recommendations for patient
management. Pharmacotherapy. 17:917–928. 1997.PubMed/NCBI
|
|
22
|
Rohde LE, de Assis MC and Rabelo ER:
Dietary vitamin K intake and anticoagulation in elderly patients.
Curr Opin Clin Nutr Metab Care. 10:1–5. 2007.PubMed/NCBI
|
|
23
|
Mlejnsky F, Klein AA, Lindner J, Maruna P,
Kvasnicka J, Kvasnicka T, Zima T, Pecha O, Lips M, Rulisek J, et
al: A randomised controlled trial of roller versus centrifugal
cardiopulmonary bypass pumps in patients undergoing pulmonary
endarterectomy. Perfusion. 30:520–528. 2015. View Article : Google Scholar : PubMed/NCBI
|