Introduction
Diabetic retinopathy is recognized as the most
important manifestation of diabetic microvascular disease and the
leading cause of vision loss, particularly among adults aged 20–74
years (1). Recently, the disease has
become the fifth most common cause of severe visual impairment
worldwide (2,3). For patients with diabetic retinopathy,
neovascularization is an important event involving various
secretory proteins, including multiple growth factors, and
angiogenesis has been recognized as the therapeutic target for
diabetic retinopathy (4,5).
Secreted protein acidic and rich in cysteine
(SPARC), also known as osteonectin or BM-40, is a widely expressed
profibrotic protein with pleiotropic roles that has been studied
under a variety of conditions (6,7).
Previous results have demonstrated that SPARC may be a key
component in the pathologies associated with obesity and diabetes
(8). Furthermore, elevated plasma
SPARC levels have been indicated to be associated with insulin
resistance, dyslipidemia and inflammation in gestational diabetes
mellitus (9). A previous study
suggested that elevated plasma levels of SPARC were exhibited in
patients with newly diagnosed type 2 diabetes mellitus (10). SPARC gene expression has also been
revealed to be increased in diabetes-associated mesenteric vascular
hypertrophy (11). However, the role
of SPARC in glucose-mediated damage of endothelial cells remains
unclear.
To study the role of SPARC in diabetic retinopathy,
an ex vivo model of human retinal capillary endothelial
cells (HRCECs) in the presence of high concentrations of glucose
was established. The expression of SPARC in HRCECs was altered and
cell viability, migration, angiogenesis and cellular adhesion were
evaluated.
Materials and methods
Construction of lentiviral
vectors
Viral vectors were constructed using 293T cells
(cat. no. CRL-11268; American Type Culture Collection, Manassas,
VA, USA). The 293A cells (cat. no. R70507; Invitrogen; Thermo
Fisher Scientific, Inc., Waltham, MA, USA) were used for titration
of lentiviral vectors by reverse
transcription-quantitative-polymerase chain reaction (RT-qPCR). The
293T and 293A cell lines were cultured at 37°C in Opti-MEM (cat.
no. 31985; Gibco; Thermo Fisher Scientific, Inc.) supplemented with
10% fetal bovine serum (cat. no. SH30084.03, Hyclone Laboratories,
Inc., Logan, UT, USA). Lentiviruses were produced using a
second-generation packaging system as described previously
(12). Briefly, 6×10⁶
293T cells were plated in a 15-cm dish and transfected with 9 µg
Packaging Mix (cat. no. K4975-00, Invitrogen; Thermo Fisher
Scientific, Inc.), 3 µg transfer plasmid and 36 µl Lipofectamine
2000 (cat. no. 11668019, Invitrogen; Thermo Fisher Scientific,
Inc.), which were combined in 5 ml Opti-MEM. The transfection mix
was removed once cells were cultured for 6 h at 37°C, and fresh
culture medium was added. Virus-containing medium was collected at
48 h post-transfection. Subsequently, the collected medium was
filtered through a cellulose acetate membrane (pore size, 0.45
mm).
The 293A cell lines were used to detect titration of
lentiviral vectors. The 293A cells were plated into each well of a
24-well plate and transfected using various quantities of
lentivirus (1, 0.1 and 0.01 µl). Genomic DNA was extracted and the
provirus titer was calculated using RT-qPCR at 72 h
post-transfection. β-actin was used as the housekeeping gene. The
target sequence for SPARC knockdown was as follows:
5′-GGATGAGGACAACAACCTTCT-3′.
Expression of SPARC in HRCECs
HRCECs (BeNa Culture Collection, Shanghai, China;
http://www.bncc.org.cn/pro/p92/p_339792.html; primary
cells, passage 4–5) were cultured in Dulbecco's modified Eagle's
medium without glucose (cat. no. 11966025, Gibco; Thermo Fisher
Scientific, Inc.) supplemented with 10% fetal bovine serum in a
cell incubator with 5% CO2 at 37°C. The 3rd to 5th
passaged cells were used for all experiments as described
previously (13,14). Different concentrations of glucose
(25, 50 or 100 mM) were added in culture medium, respectively.
RT-qPCR was performed to evaluate SPARC expression in HRCECs
treated with different concentrations of glucose. HRCECs were then
infected with viruses carrying LV185-pL_shRNA_mKate2-SPARC-543.
HRCECs infected with empty vectors (negative control) or HRCECs
that were not infected (blank control) served as controls. The
expression of SPARC was assessed 48 h following this.
Cell viability assay
To determine the effects of SPARC on cell viability
following treatment with different concentrations of glucose,
HRCECs (1×10⁴) were plated in a 96-well plate and
infected with LV185-pL_shRNA_mKate2-SPARC-543 or empty vectors.
Subsequently, 10 µl of Cell Counting Kit-8 (CCK-8) reagent (cat.
no. CK04-05, Dojindo Molecular Technologies, Inc., Kumamoto, Japan)
was added into each well for each of the three groups,
respectively. The absorbance at 450 nm was measured to evaluate
cell viability at 24, 48 and 72 h, respectively. Experiments were
performed a total of three times.
Transwell migration assay
Cell migration was assessed by Transwell assay.
Transwell plate was pretreated using Dulbecco's modified Eagle's
medium (DMEM) without glucose (cat. no. 11966025; Thermo Fisher
Scientific, Inc.) for 30 min. HRCECs transfected with viruses
carrying LV185-pL_shRNA_mKate2-SPARC-543, or negative control
vectors were resuspended at a cell density of 1×10⁵
cells/ml in DMEM without glucose. Cell suspension (200 µl) was
added to the upper chamber and 800 µl culture medium with different
concentrations of glucose (25, 50 or 100 mM) was added to the lower
chamber. Cells were allowed to migrate through the membrane for 24
h. Following incubation, cells on top of the filter were scraped
off using a cotton swab. The membrane was subsequently fixed in 4%
paraformaldehyde for 10 min at room temperature, and stained with
hematoxylin and eosin for 10 min at room temperature. The inserts
were mounted on a slide, and the number of cells migrated to the
bottom of filter was determined by counting 10 high-power fields
with a bright field microscope (magnification, ×200).
Measurement of angiogenesis
HRCECs were trypsinized and resuspended in
extracellular matrix (ECM) culture media with 10% fetal bovine
serum (Hyclone). Cells from the experimental groups were plated at
a density of 1.5×10⁴ cells/well in triplicate in 96-well
plates, respectively. Plates were incubated for 24 h at 37°C prior
to photomicroscopy. Images from each well were taken at a
magnification of ×4 using an Olympus microscope (cat. no. CKX31;
Olympus Corporation, Tokyo, Japan) every 2 h. Image-Pro Plus
software (version 6.0.0.260; Media Cybernetics, Inc., Rockville,
MD, USA) was utilized to calculate the length of blood vessels
formed (15,16). Statistical analysis was subsequently
performed.
RT-qPCR
HRCECs were cultured in medium containing 25, 50 or
100 mM glucose, respectively. Following 24 h, total RNA was
extracted from HRCECs. The expression levels of the following genes
were detected using RT-qPCR: Genes associated with tight junctions,
including zonula occludens (ZO)-1, occludin, claudin and junctional
adhesion molecule 1 (JAM1); genes associated with gap junctions,
including connexin (Cx)37, Cx40 and Cx43; genes associated with
adherens junctions, including vascular endothelial (VE)-cadherin,
catenin alpha 1 (CTNNA1), catenin beta 1 (CTNNB1) and catenin delta
1 (CTNND1). Total RNA was extracted using TRIzol (cat. no.
15596018; Invitrogen; Thermo Fisher Scientific, Inc.) according to
the manufacturer's instructions. A cDNA synthesis kit (SuperScript
First-Strand Synthesis System; cat. no. 11904-018; Invitrogen;
Thermo Fisher Scientific, Inc.) was used for RT. Each reaction
contained 0.5 µl of random primers (0.2 µg/µl) and 1 µl of
SuperScript III reverse transcriptase (200 U/µl). The specific
primers used are listed in Table I.
qPCR was performed by utilizing the SYBR® Premix Ex Taq
(cat. no. RR420L; Takara Bio, Inc., Otsu, Japan). The following PCR
conditions were used: Pre-denaturing at 95°C for 2 min; denaturing
at 95°C for 10 sec; and annealing and polymerization at 60°C for 30
sec and 70°C for 45 sec. A total of 40 PCR cycles were performed.
PCR was performed using a CFX96 Touch Real-Time PCR Detection
System. Gene expression was determined as the ratio of relative
optical density of target gene to β-actin. The 2−ΔΔCq
method was utilized to measure PCR results (17).
 | Table I.Primers used in reverse
transcription-quantitative polymerase chain reaction. |
Table I.
Primers used in reverse
transcription-quantitative polymerase chain reaction.
| Genes | Primers | Sequences (5′ to
3′) |
|---|
| SPARC | SPARC-F |
AGGAAACCGAAGAGGAGG |
|
| SPARC-R |
GCAAAGAAGTGGCAGGAA |
| ZO-1 | ZO-1-F |
TATTCACGCAGTTACGAGCAAG |
|
| ZO-1-R |
AAGGTATCAGCGGAGGGACA |
| Occludin | Occludin-F |
AAGCCAAACCTCTGTGAGCA |
|
| Occludin-R |
GGAGTGTTCAGCCCAGTTGA |
| Claudin | Claudin-F |
TTGGGCTTCATTCTCGCCTT |
|
| Claudin-R |
GAGGATGCCAACCACCATCA |
| JAM1 | JAM1-F |
AATCTGCACTCAACTGCCCA |
|
| JAM1-R |
CATTTCAGCCGCTCTAGCCT |
| Cx37 | Cx37-F |
ACCATGCCCCACCTACAATG |
|
| Cx37-R |
CAGCCAGACTTCTCAGGACC |
| Cx40 | Cx40-F |
GCATTGTGCTTCTCGGGTTC |
|
| Cx40-R |
CTATCACCACACCTCTCGGC |
| Cx43 | Cx43-F |
TTCAAGGGCGTTAAGGATCG |
|
| Cx43-R |
TAACCAGCTTGTACCCAGGA |
| VE-cadherin | VE-cadherin-F |
AAGCAGAGCTGGGTCACTTG |
|
| VE-cadherin-R |
GAAGCTCTTGGCTCTGGAGG |
| CTNNA1 | CTNNA1-F |
TAACAGCATCGGGGTCGTTG |
|
| CTNNA1-R |
GGCTGGTGTTAAATCAGCACT |
| CTNNB1 | CTNNB1-F |
GTCTGAGGACAAGCCACAAGA |
|
| CTNNB1-R |
GCCACCCATCTCATGTTCCA |
| CTNND1 | CTNND1-F |
AGCTGGCTGCCTTAGGAATG |
|
| CTNND1-R |
ATCTTTGCCCTTCTTGGCCC |
Western blot analysis
Protein expression levels of SPARC in HRCECs were
detected using western blot analysis. HRCECs were lysed in lysis
buffer (cat. no. P0013, Beyotime Institute of Biotechnology,
Haimen, China) at 4°C with inhibitors of phosphatase and protease
(cat. no. P1045, Beyotime Institute of Biotechnology). The lysis
mixture was centrifuged at 4°C for 10 min at 10,000 × g, and the
supernatant containing cellular proteins was utilized in the
following experiments. The protein concentration was measured using
a BCA kit. Proteins were separated using SDS-PAGE (10% gels, 40 µg
per lane; 120 V). The separated proteins were then transferred to
polyvinylidene fluoride membranes (100 V for 120 min; cat. no.
FFP24, Beyotime Institute of Biotechnology). The membranes were
blocked with 5% non-fat milk at room temperature for 1 h and
subsequently incubated with anti-SPARC (cat. no. ab225716; Abcam;
1:1,000) and anti-β-actin (cat. no. ab8227; Abcam; 1:1,000) primary
antibodies against SPARC at 4°C overnight. Membranes were washed
with Tris-buffered saline containing Tween 20 and incubated with
horseradish peroxidase-conjugated goat anti-rabbit secondary
antibody (cat. no. ab6721; Abcam; 1:2,000) at room temperature for
1 h. Membranes were incubated in enhanced chemiluminescence
solution (cat. no. P0018A, Beyotime Institute of Biotechnology).
Images were captured on film (cat. no. FF057, Beyotime Institute of
Biotechnology) in a dark room. Experiments were repeated for 3
times. Blot images were quantified in greyscale using ImageJ
(version 1.5.2; National Institute of Health, Bethesda, MD,
USA).
Statistical analyses
Data were analysed using GraphPad Prism 5.0 software
(GraphPad Software Inc., La Jolla, CA, USA). Data were presented as
mean ± standard deviation. Differences among three groups were
measured by analysis of variance followed by the Bonferroni's
post-hoc test for multiple comparisons. Differences between two
groups were measured using a Student's t-test. P<0.05 was
considered to indicate a statistically significant difference.
Results
Treatment with glucose increases SPARC
expression levels in HRCECs
The mRNA expression levels of SPARC in HRCECs was
detected by RT-qPCR at 24, 48 and 72 h, respectively. Compared with
the 25 mM glucose group, the mRNA expression levels of SPARC in the
100 mM glucose group were significantly increased at 24, 48 and 72
h (P<0.05 and P<0.01; Fig.
1A). In addition, protein expression levels of SPARC in HRCECs
were detected by western blot analysis at 72 h. Compared with the
25 mM glucose group, the protein expression levels of SPARC in the
100 mM glucose group were significantly increased at 72 h
(P<0.001; Fig. 1B). HRCECs
without treatment (blank group) and 100 mM mannitol served as
controls.
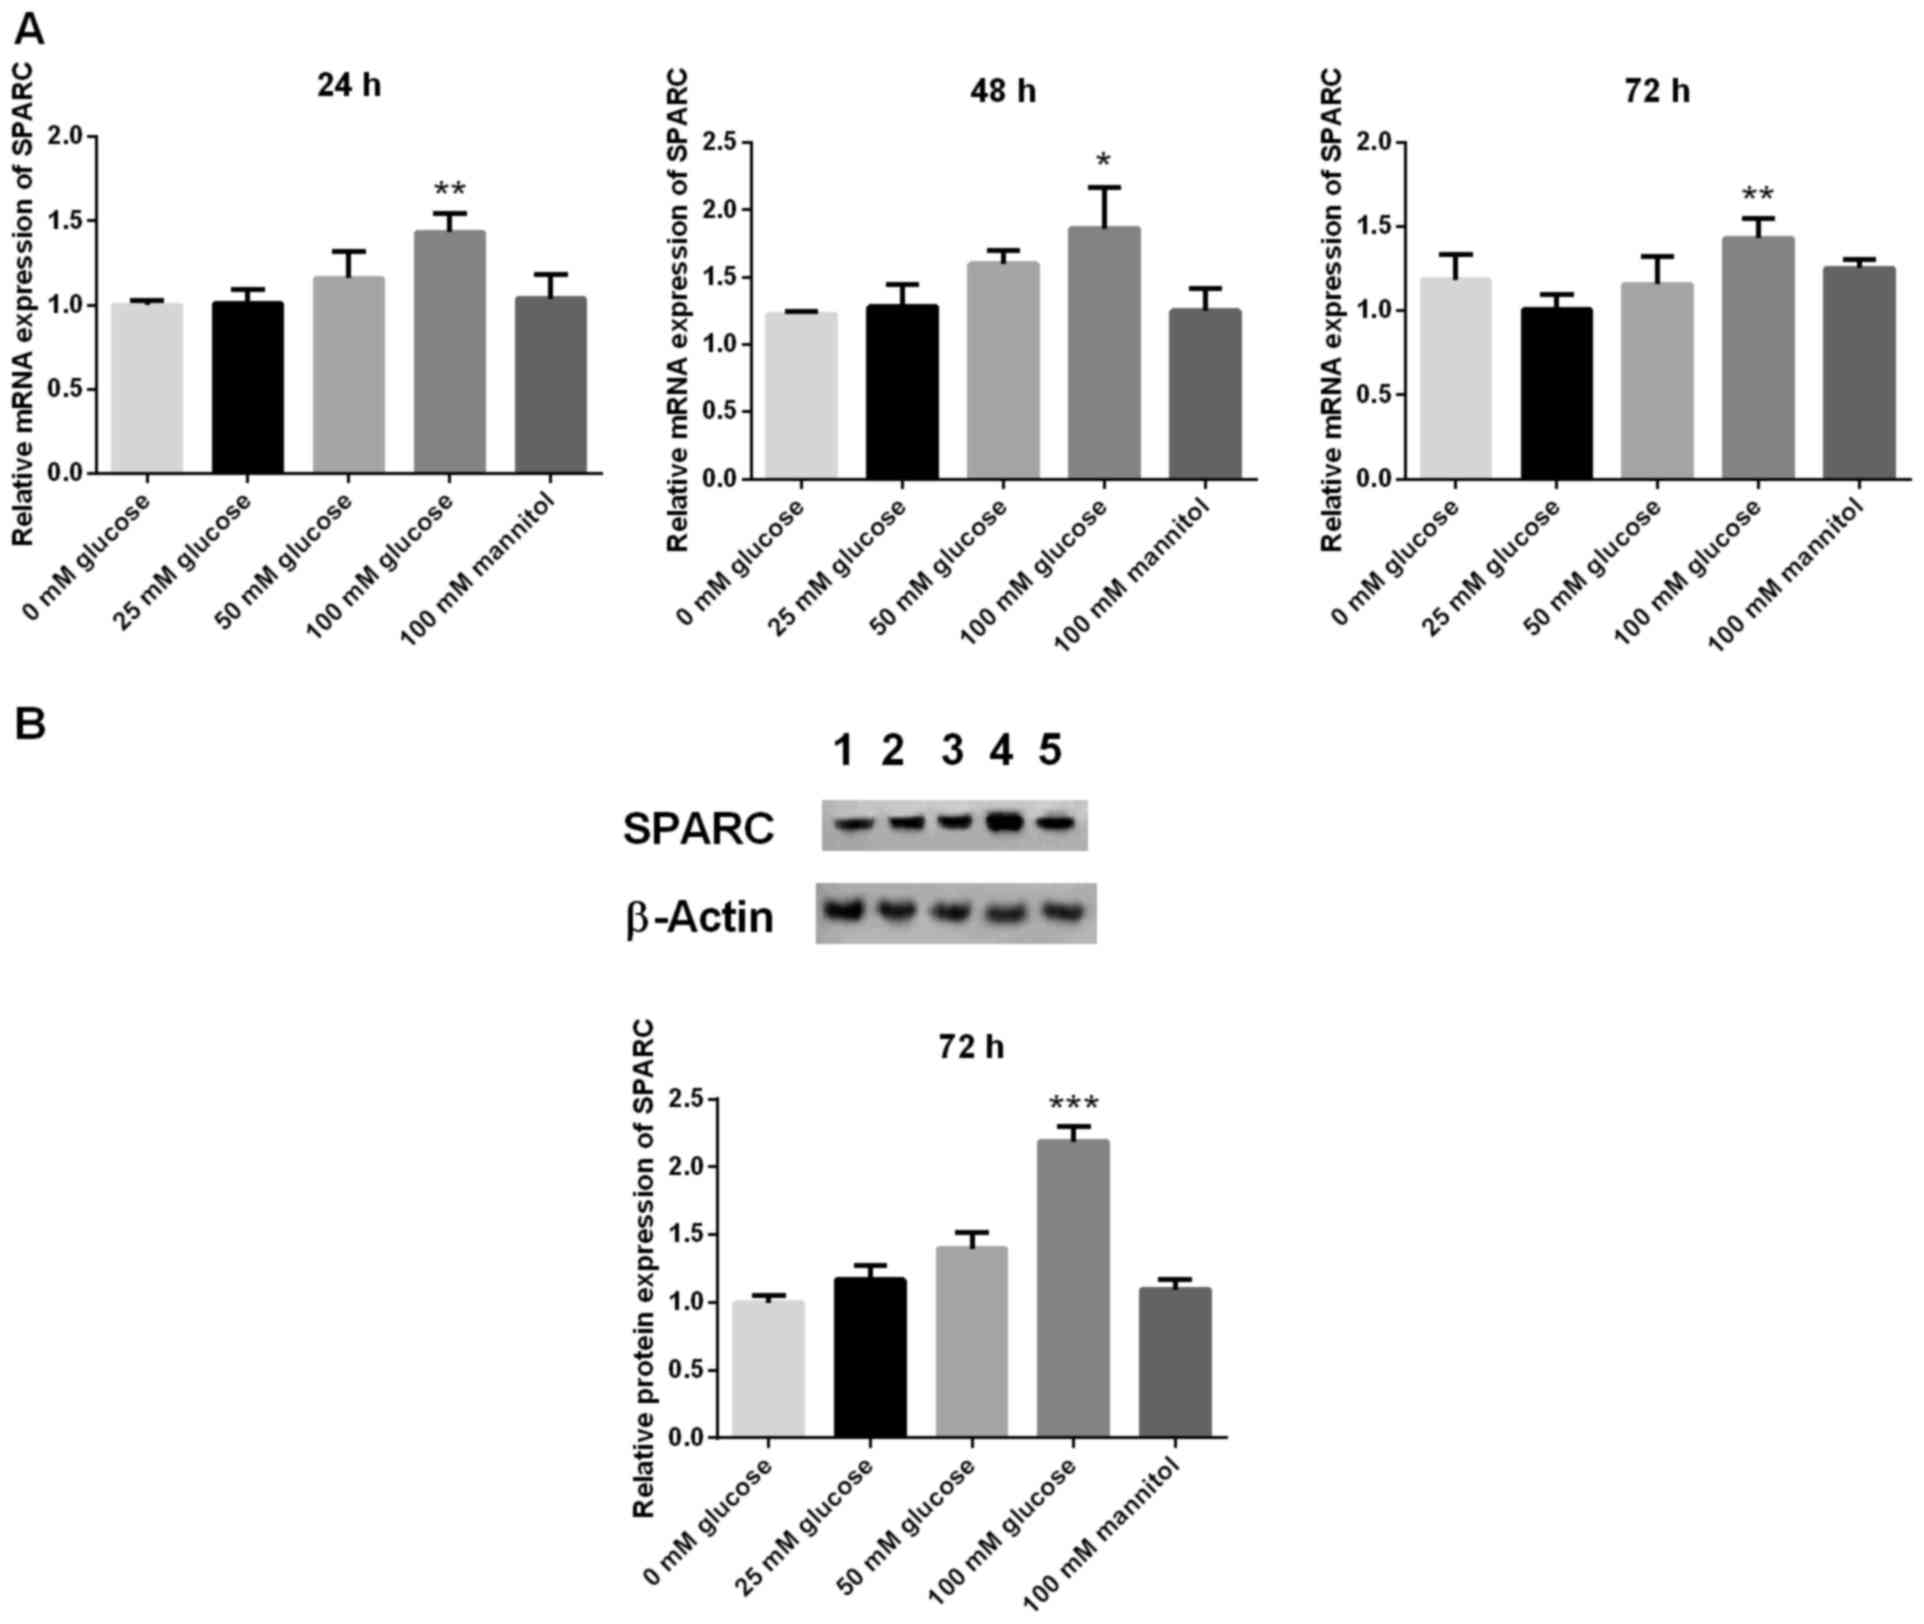 | Figure 1.Expression of SPARC in HRCECs treated
with 100 mM glucose is significantly increased. (A) mRNA and (B)
protein expression levels of SPARC. The mRNA expression levels of
SPARC in HRCECs was detected by reverse transcription-quantitative
polymerase chain reaction at 24, 48, and 72 h, respectively.
Western blot analysis was used to detect the protein expression
levels of SPARC. Data were presented as the mean ± standard
deviation (n=3). *P<0.05, **P<0.01 and ***P<0.001 vs. 25
mM glucose group. SPARC, secreted protein acidic and rich in
cysteine; HRCECs, human retinal capillary endothelial cells; 1,
blank; 2, 25 mM glucose; 3, 50 mM glucose; 4, 100 mM glucose; 5,
100 mM mannitol. |
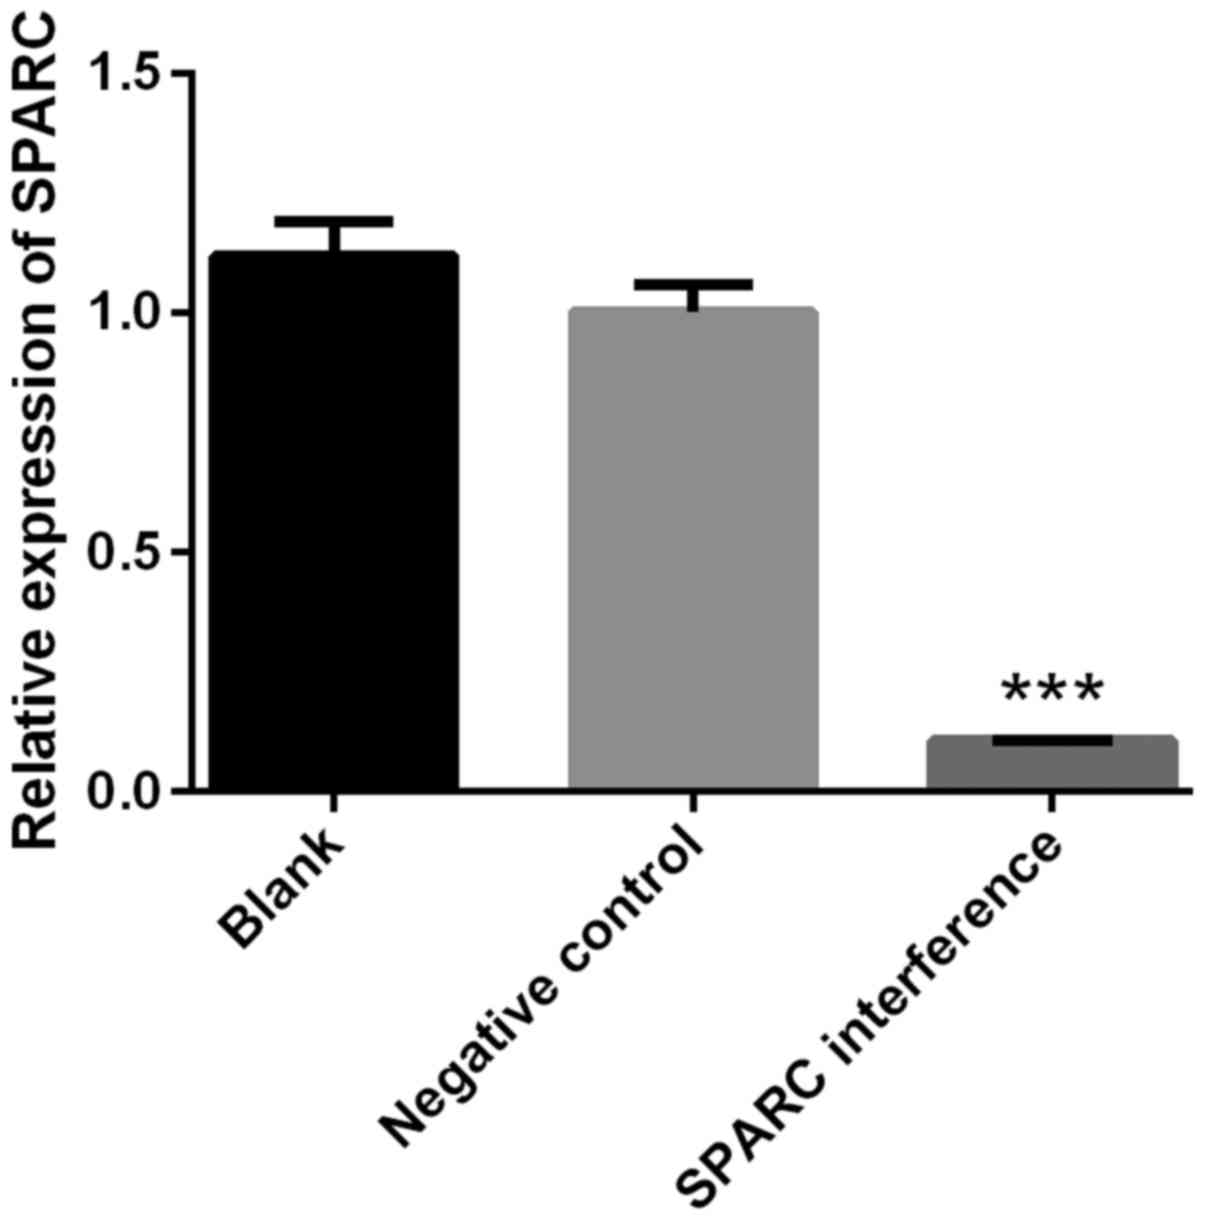
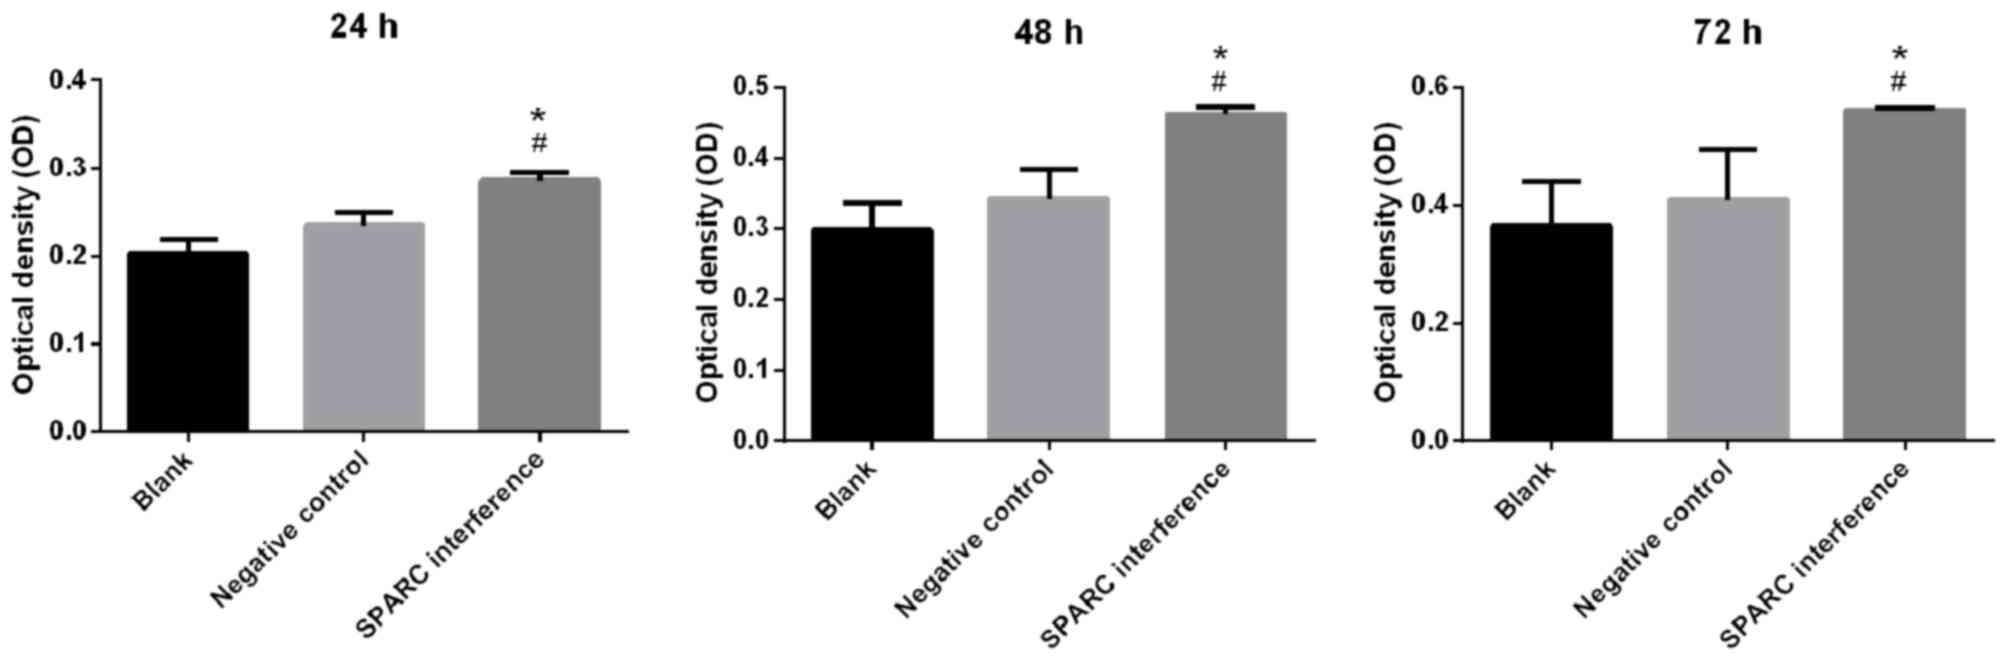
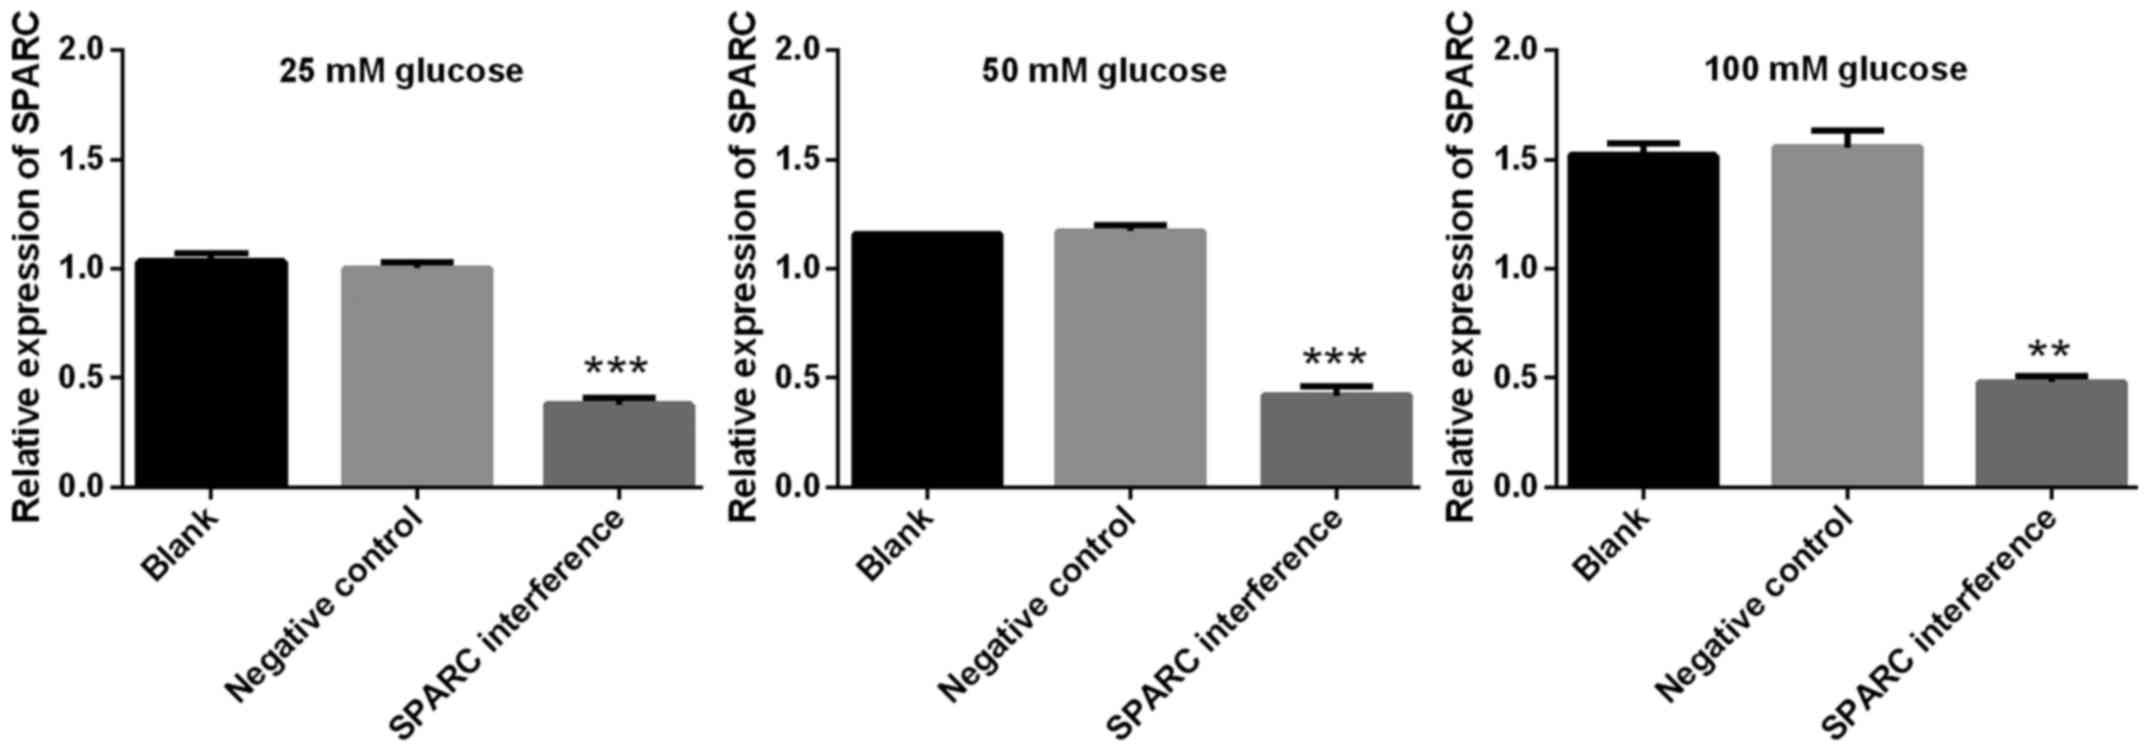
SPARC interference increases the
viability of HRCECs treated with glucose
The success of SPARC interference was confirmed by
RT-qPCR. The expression of SPARC in the SPARC interference group
was significantly decreased compared with blank or negative control
groups (P<0.001; Fig. 2). The
interference efficiency was 89.34% (Fig.
2). Cell viability was detected using the CCK-8 assay. The
SPARC interference group exhibited significantly increased cell
viability when compared with the blank or negative control groups
at 24, 48 and 72 h (all P<0.05; Fig.
3).
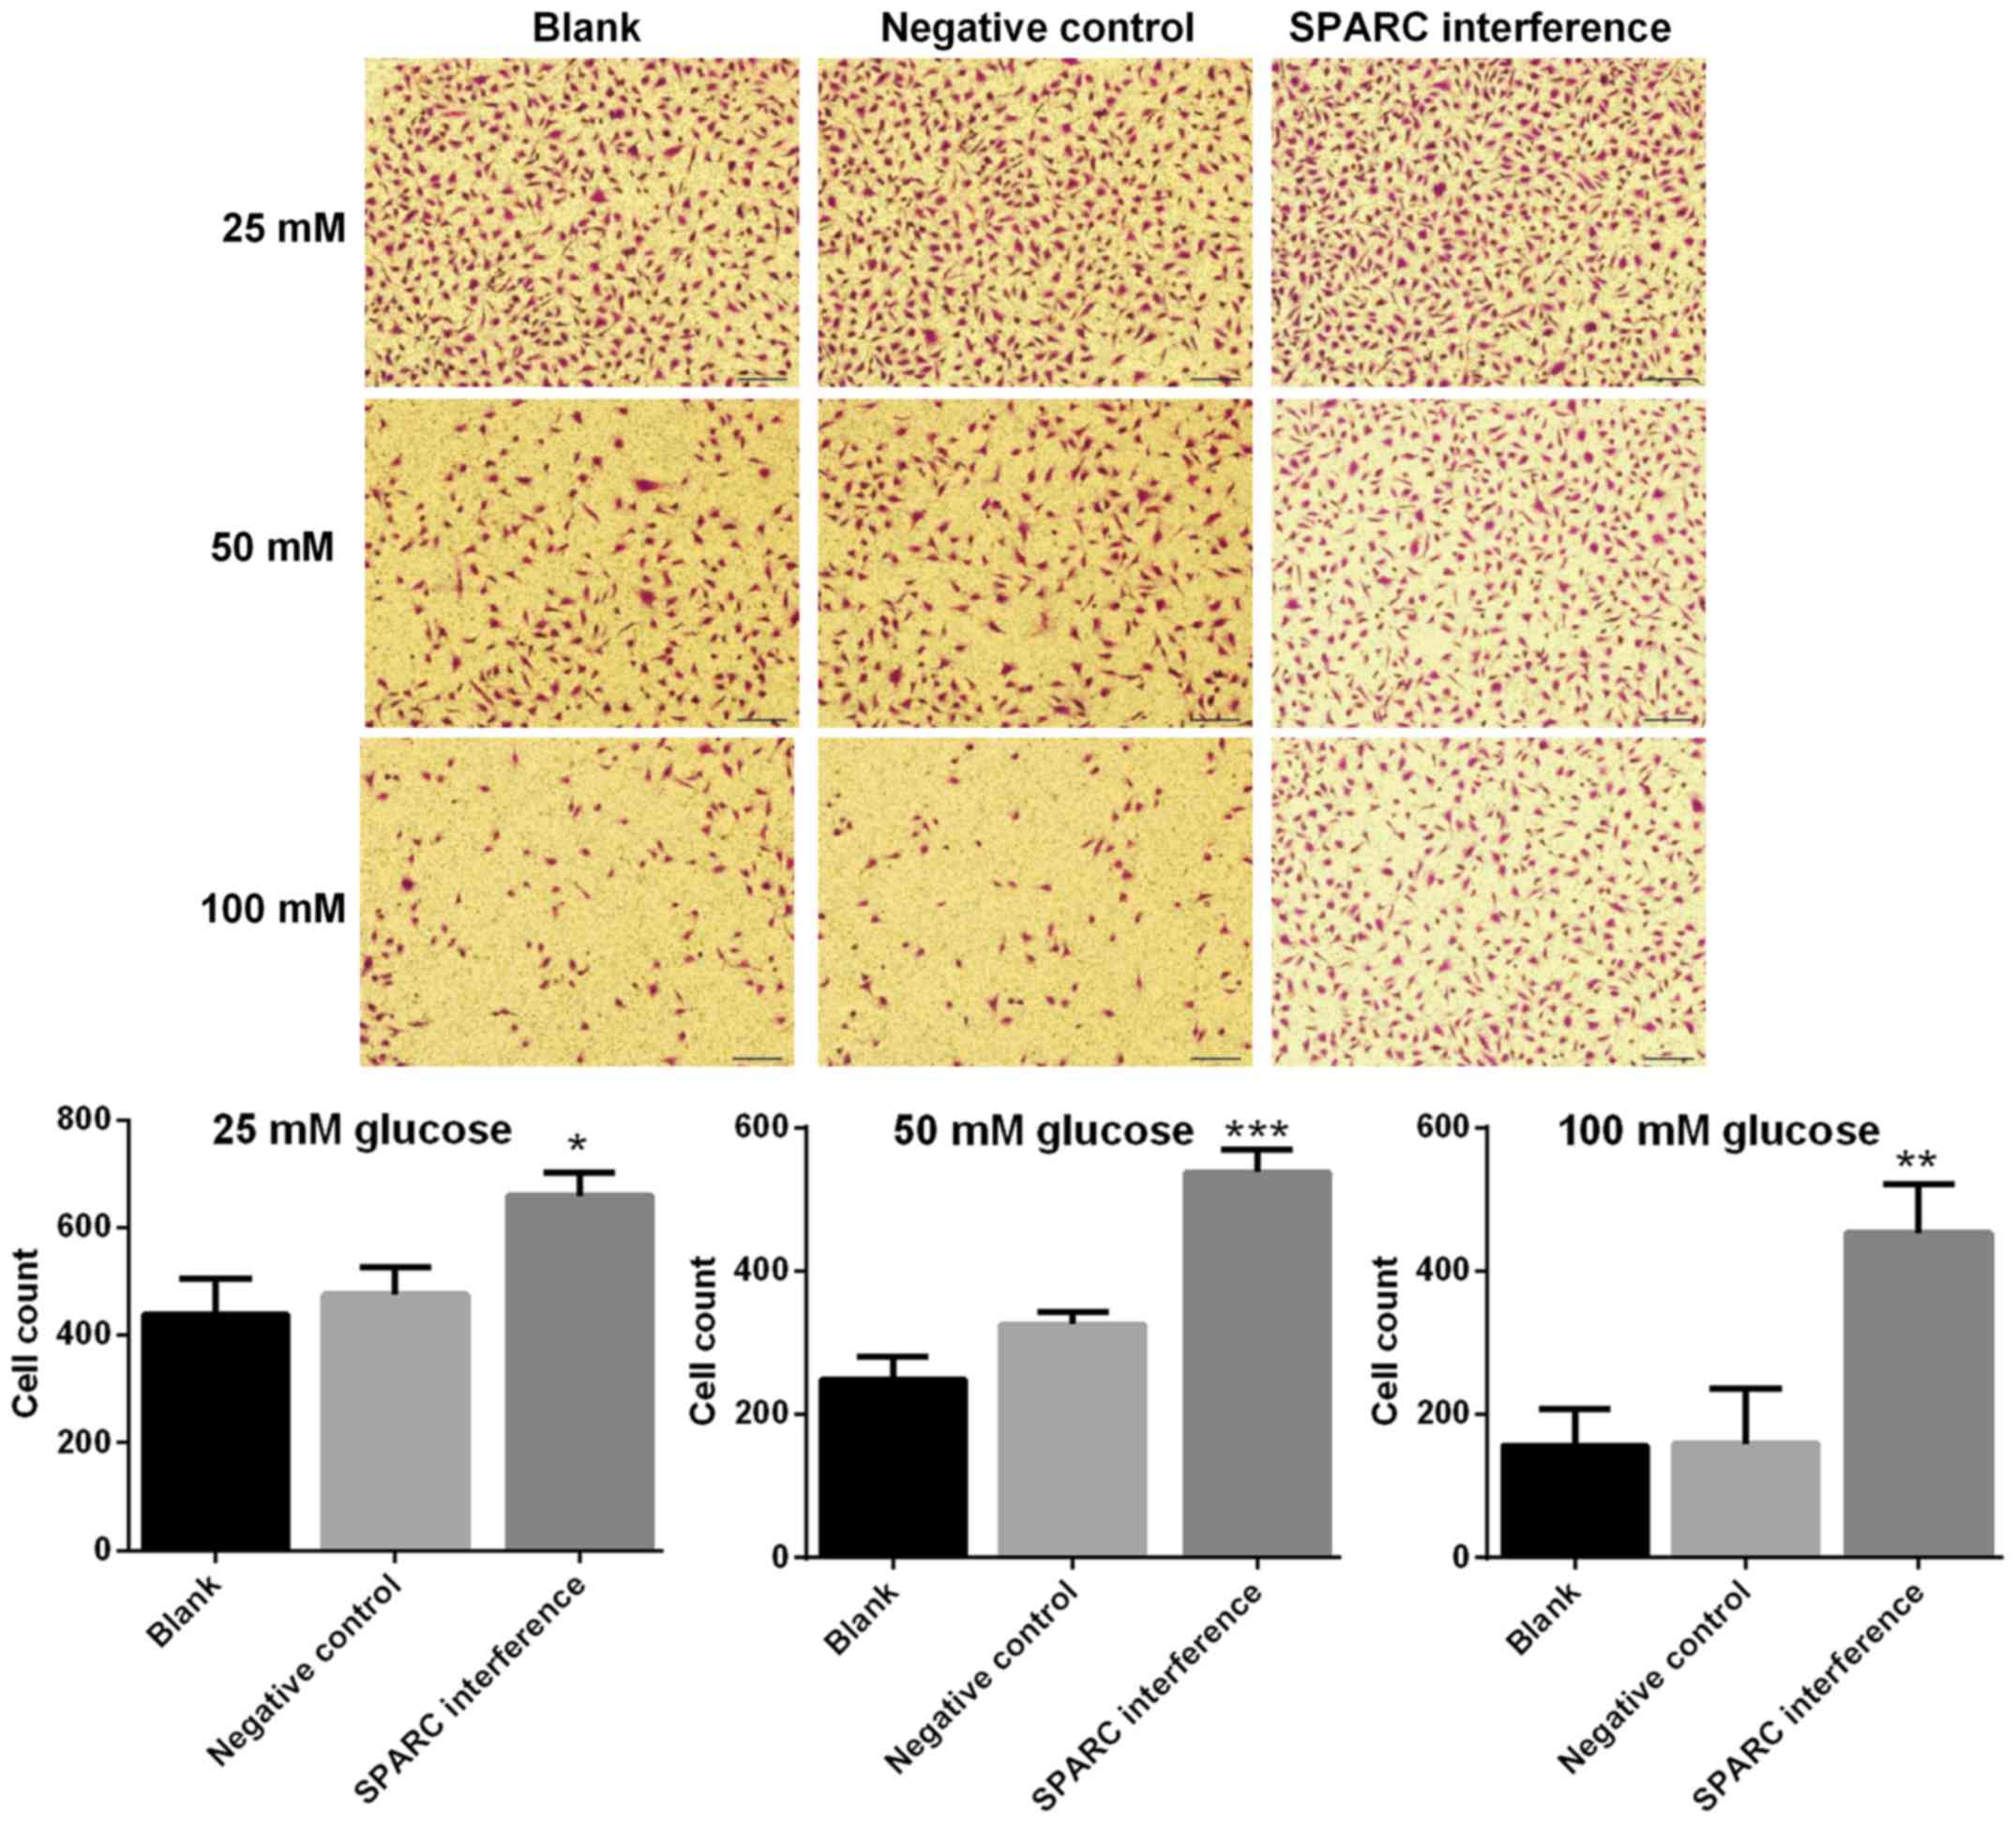
SPARC interference enhances the
migration of HRCECs treated with glucose
The migration ability of HRCECs was detected using
the Transwell assay. The SPARC interference group exhibited
significantly increased cell migration following treatment with 25,
50 and 100 mM glucose respectively, compared with the negative
control group (P<0.05; Fig. 4).
Results indicated that the migration ability was higher when the
concentration of glucose was lower.
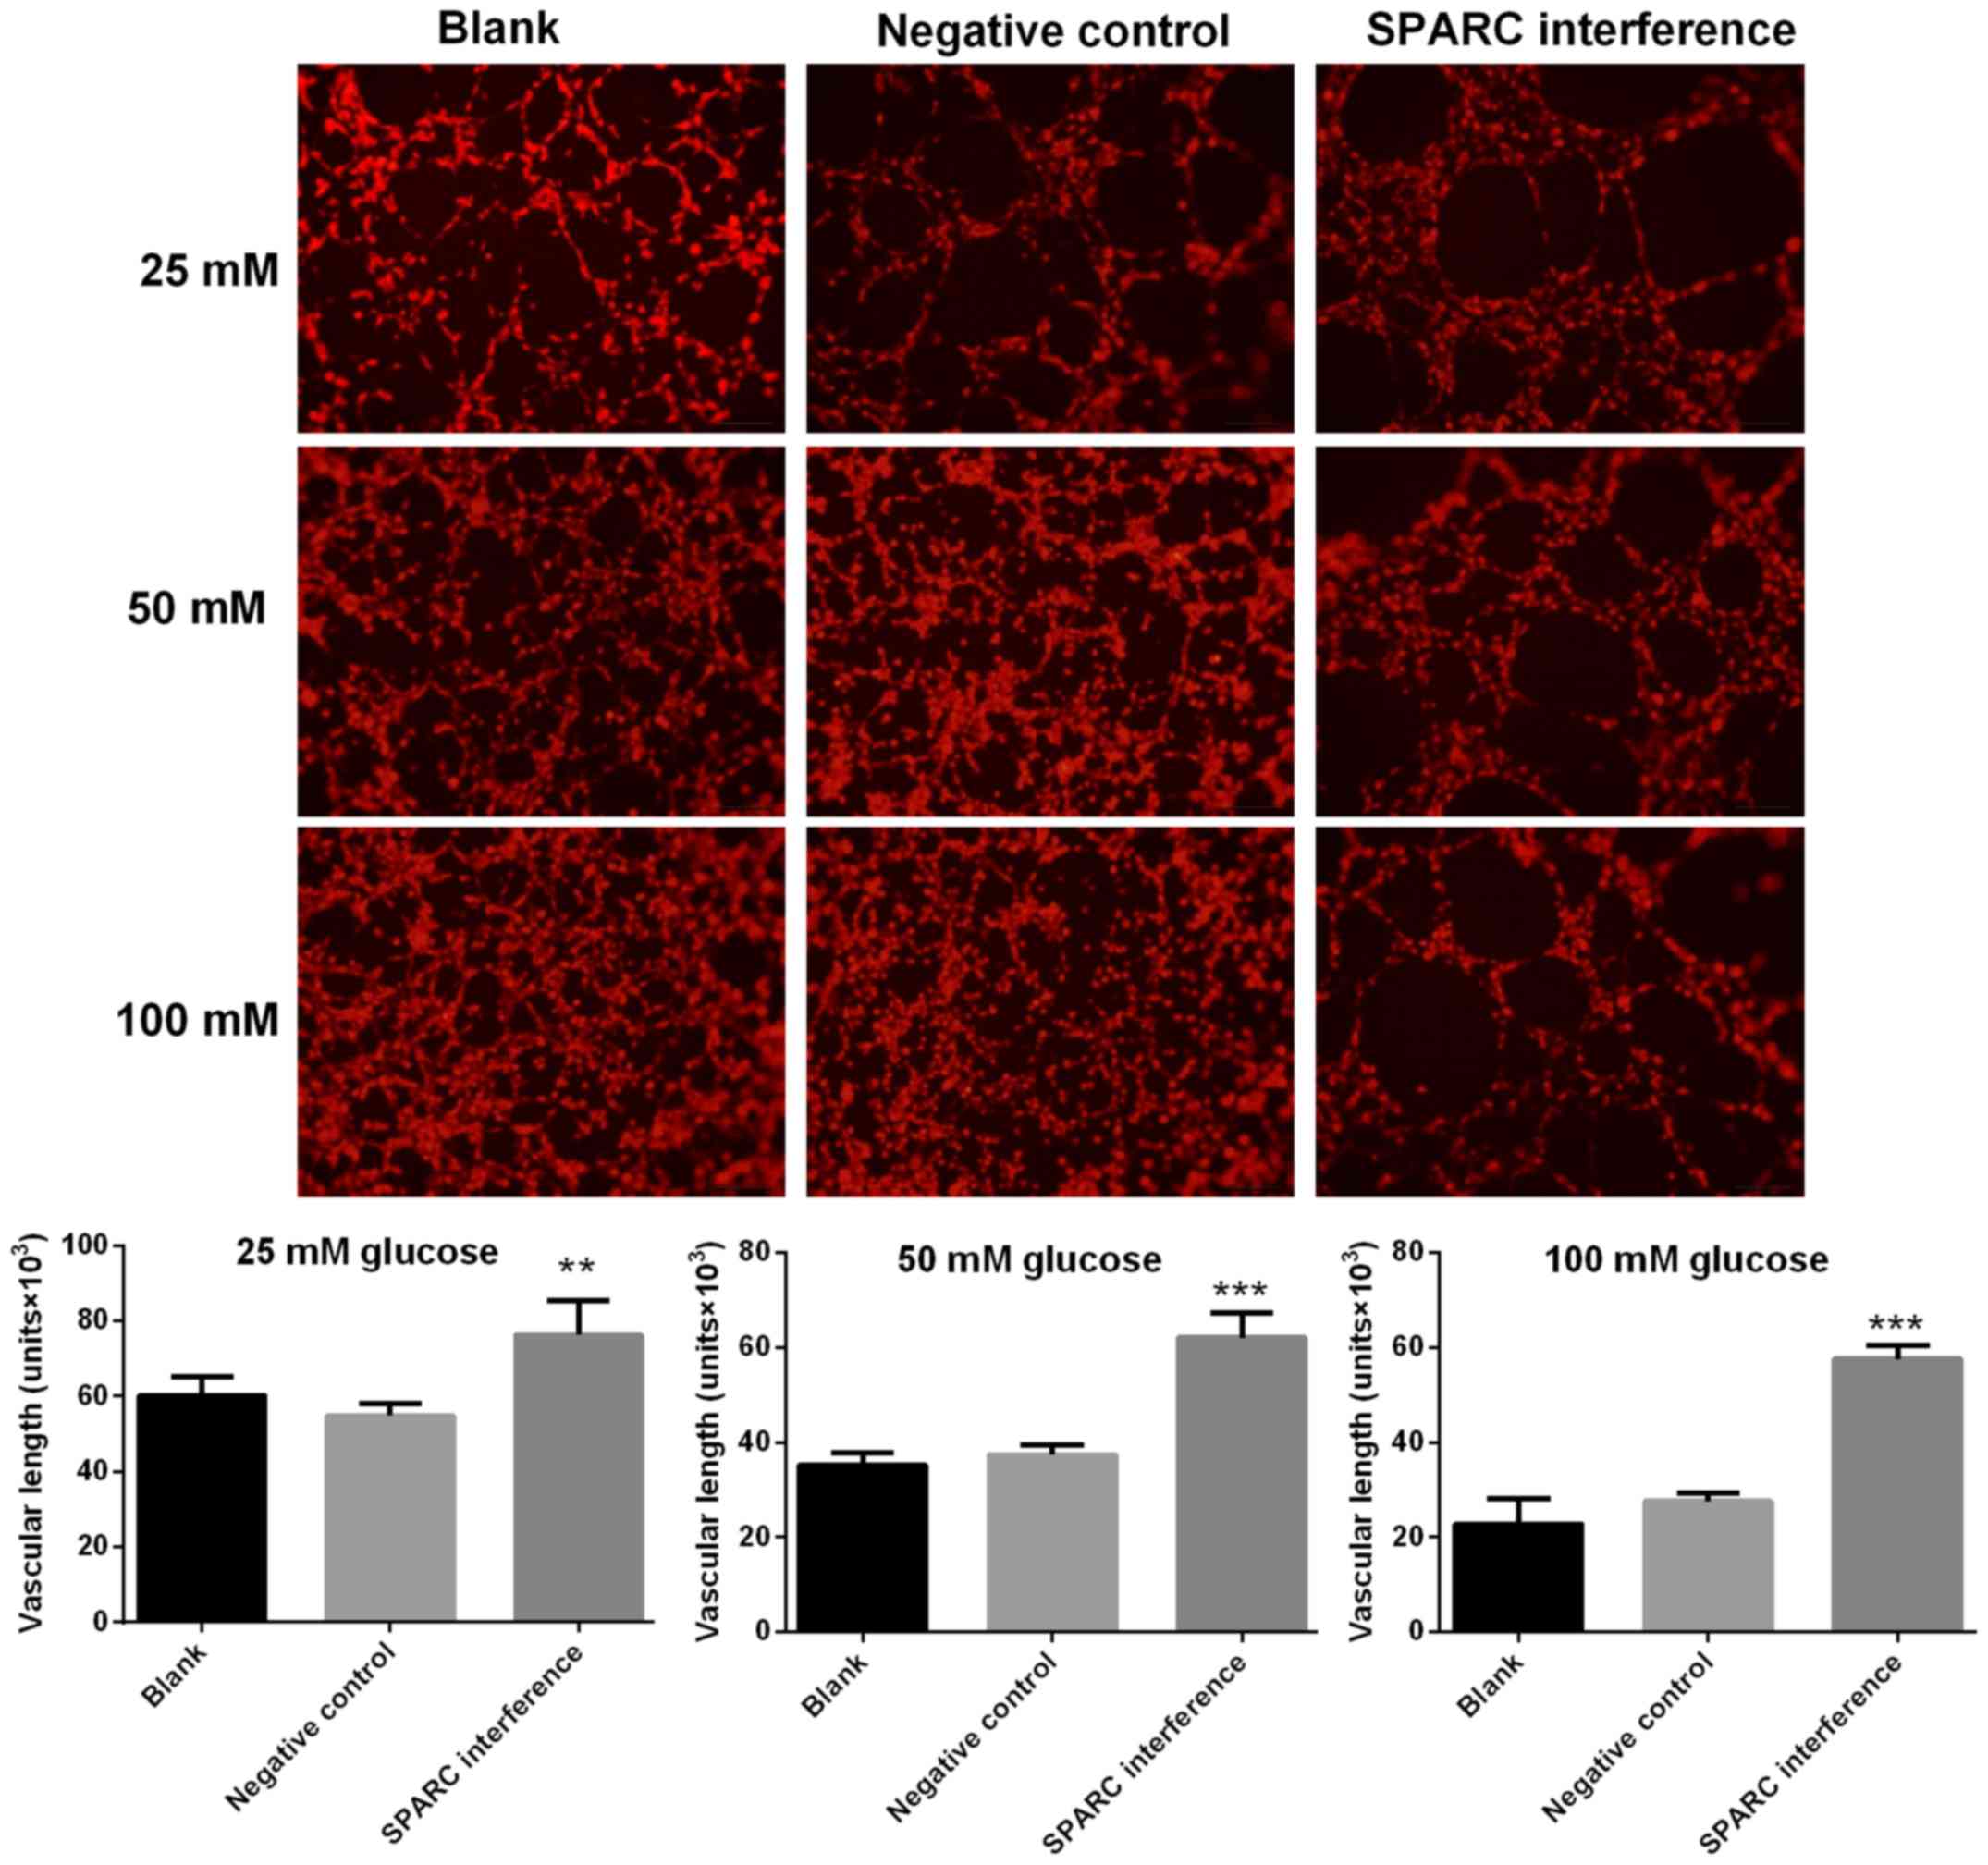
SPARC interference increases the
length of blood vessels treated with glucose
Image-Pro Plus software was utilized to calculate
the length of blood vessels formed with HRCECs. Compared with the
negative control group, the SPARC interference group exhibited
significantly increased vascular length following treatment with
25, 50 and 100 mM glucose (P<0.01 and P<0.001; Fig. 5).
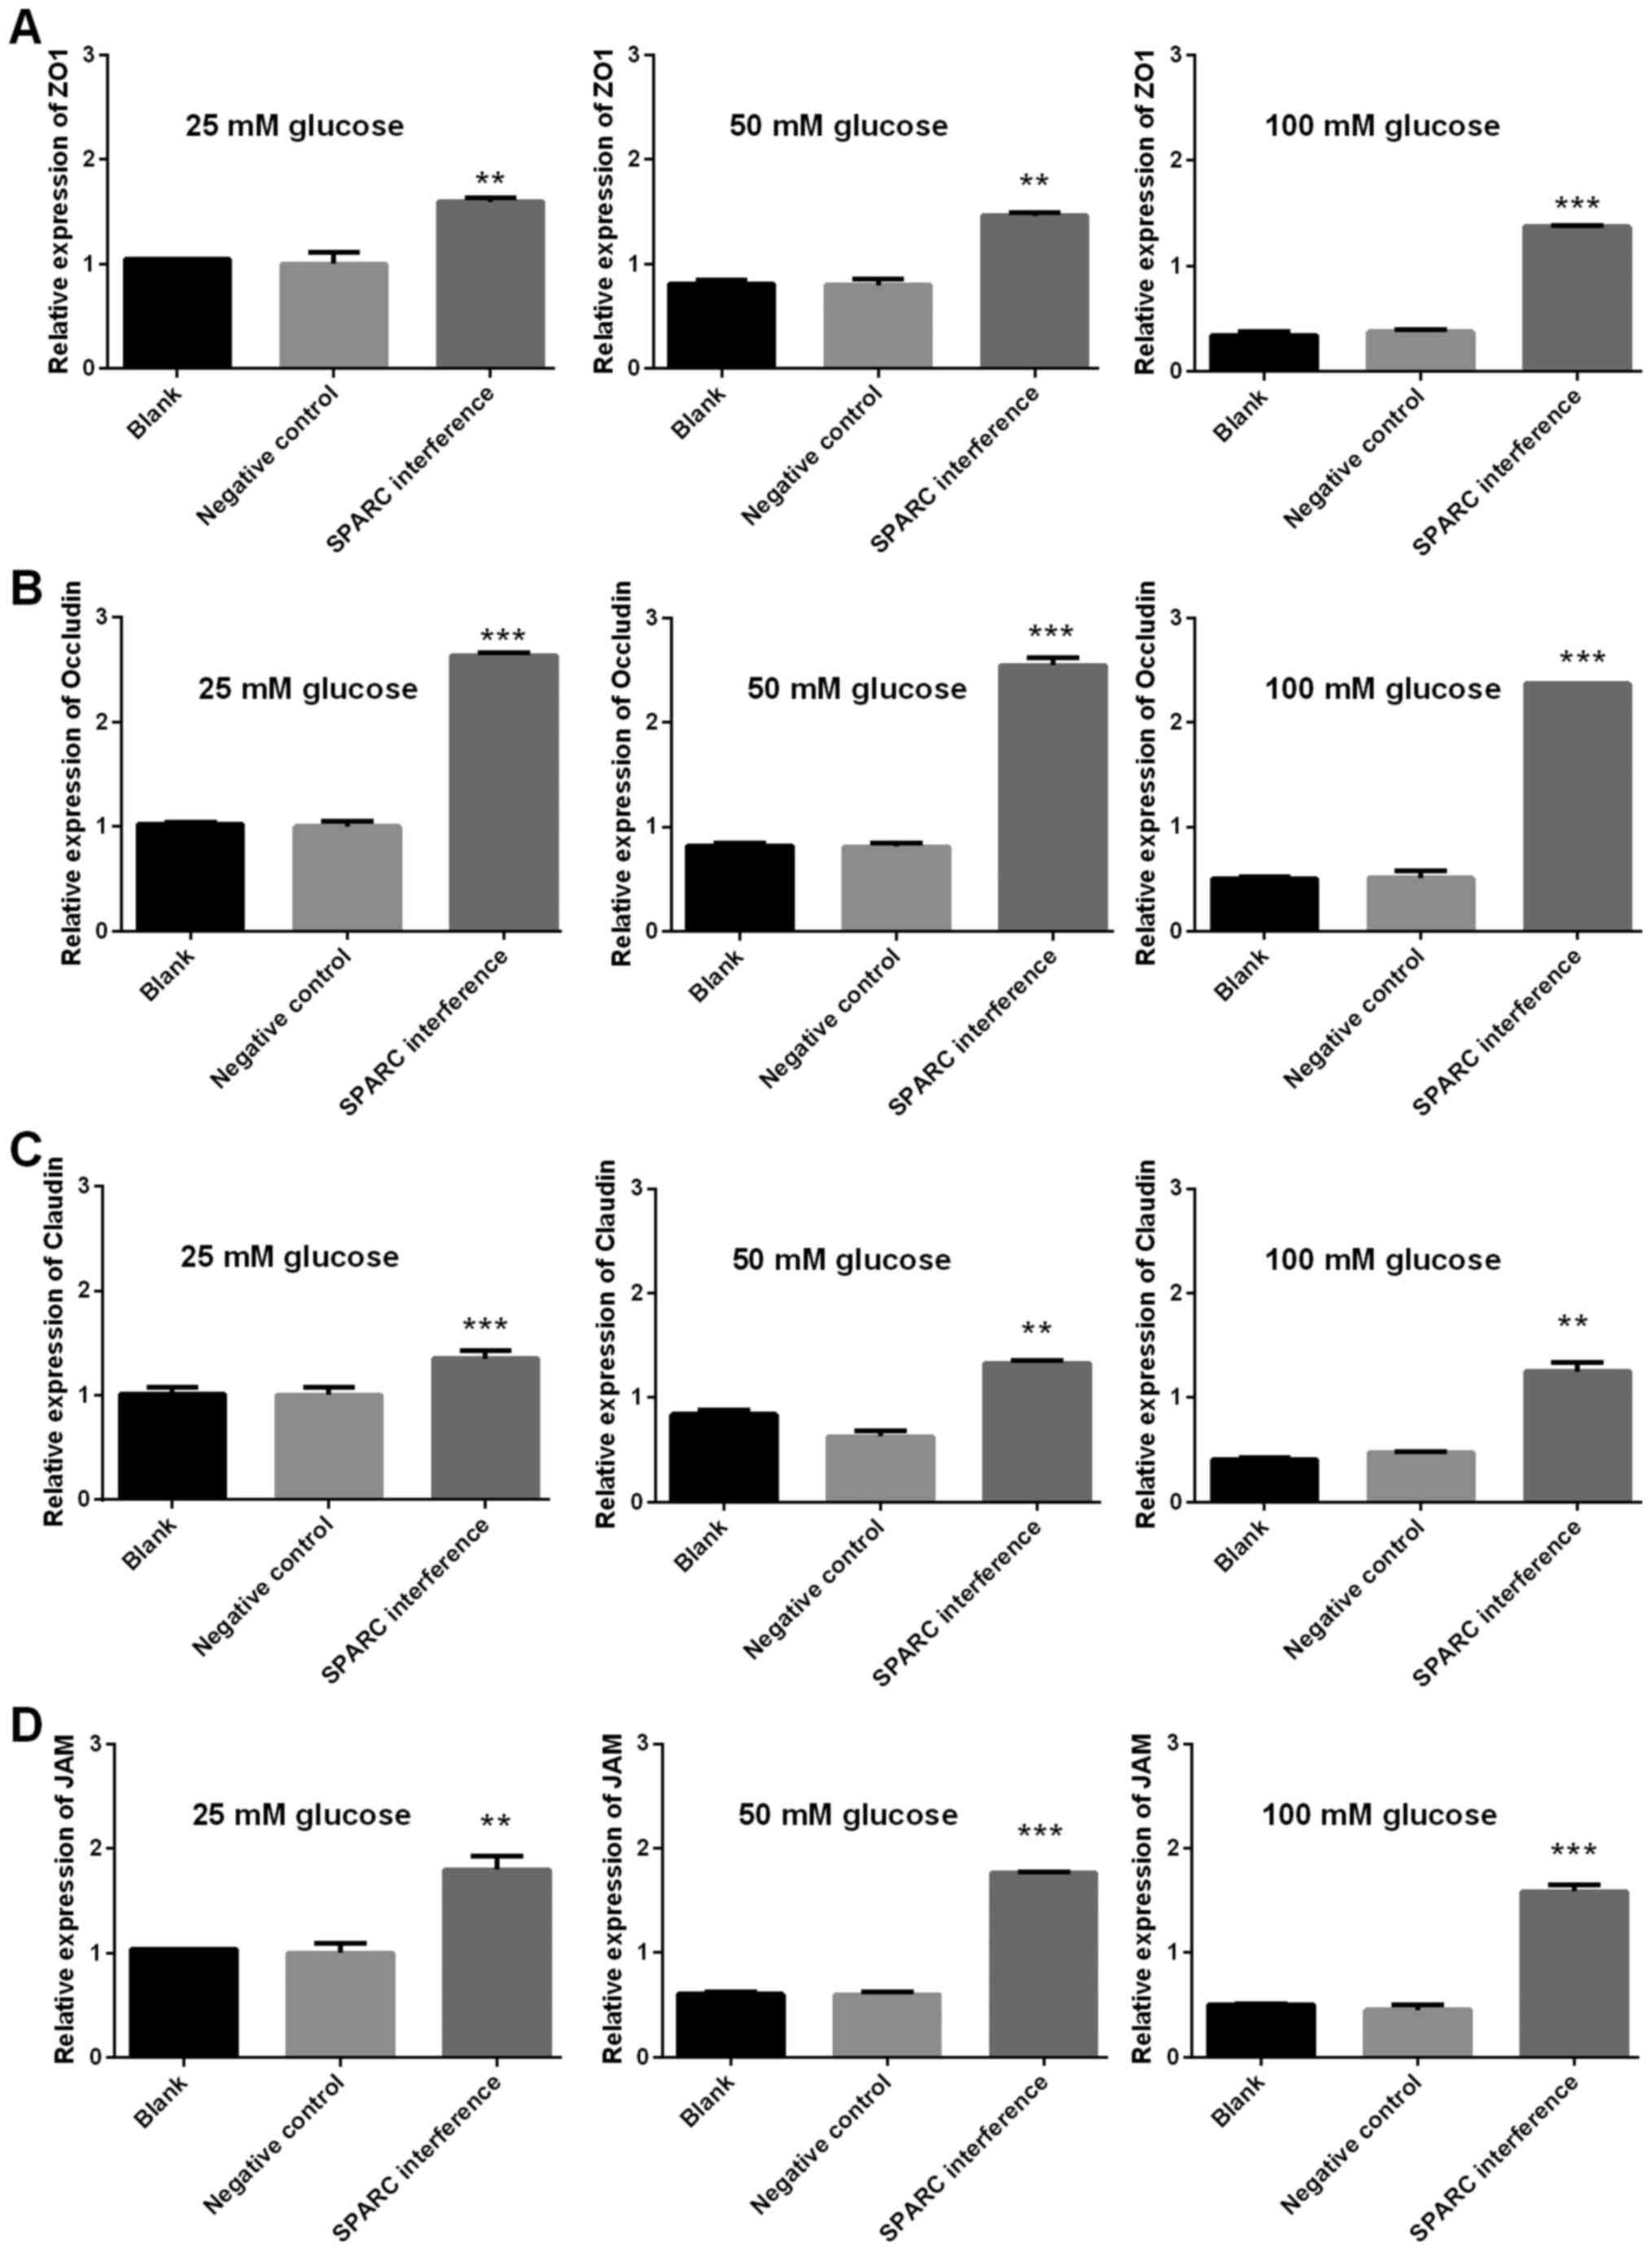
SPARC interference increases the
expression of genes associated with tight junctions, gap junctions
and adherens junctions
The expression levels of genes associated with tight
junctions (ZO-1, occludin, claudin and JAM1), gap junctions (Cx37,
Cx40 and Cx43), and adherens junctions (VE-cadherin, CTNNA1, CTNNB1
and CTNND1) were detected using RT-qPCR. The gene expression levels
of SPARC in the SPARC interference group that received treatment
with 25, 50 and 100 mM glucose were significantly decreased
compared with the negative control group (P<0.01 and P<0.001;
Fig. 6). Furthermore, following
treatment with 25, 50 and 100 mM glucose, the SPARC interference
group demonstrated significantly increased expression levels of
genes associated with tight junctions (ZO, occludin, claudin and
JAM1; P<0.01 and P<0.001; Fig.
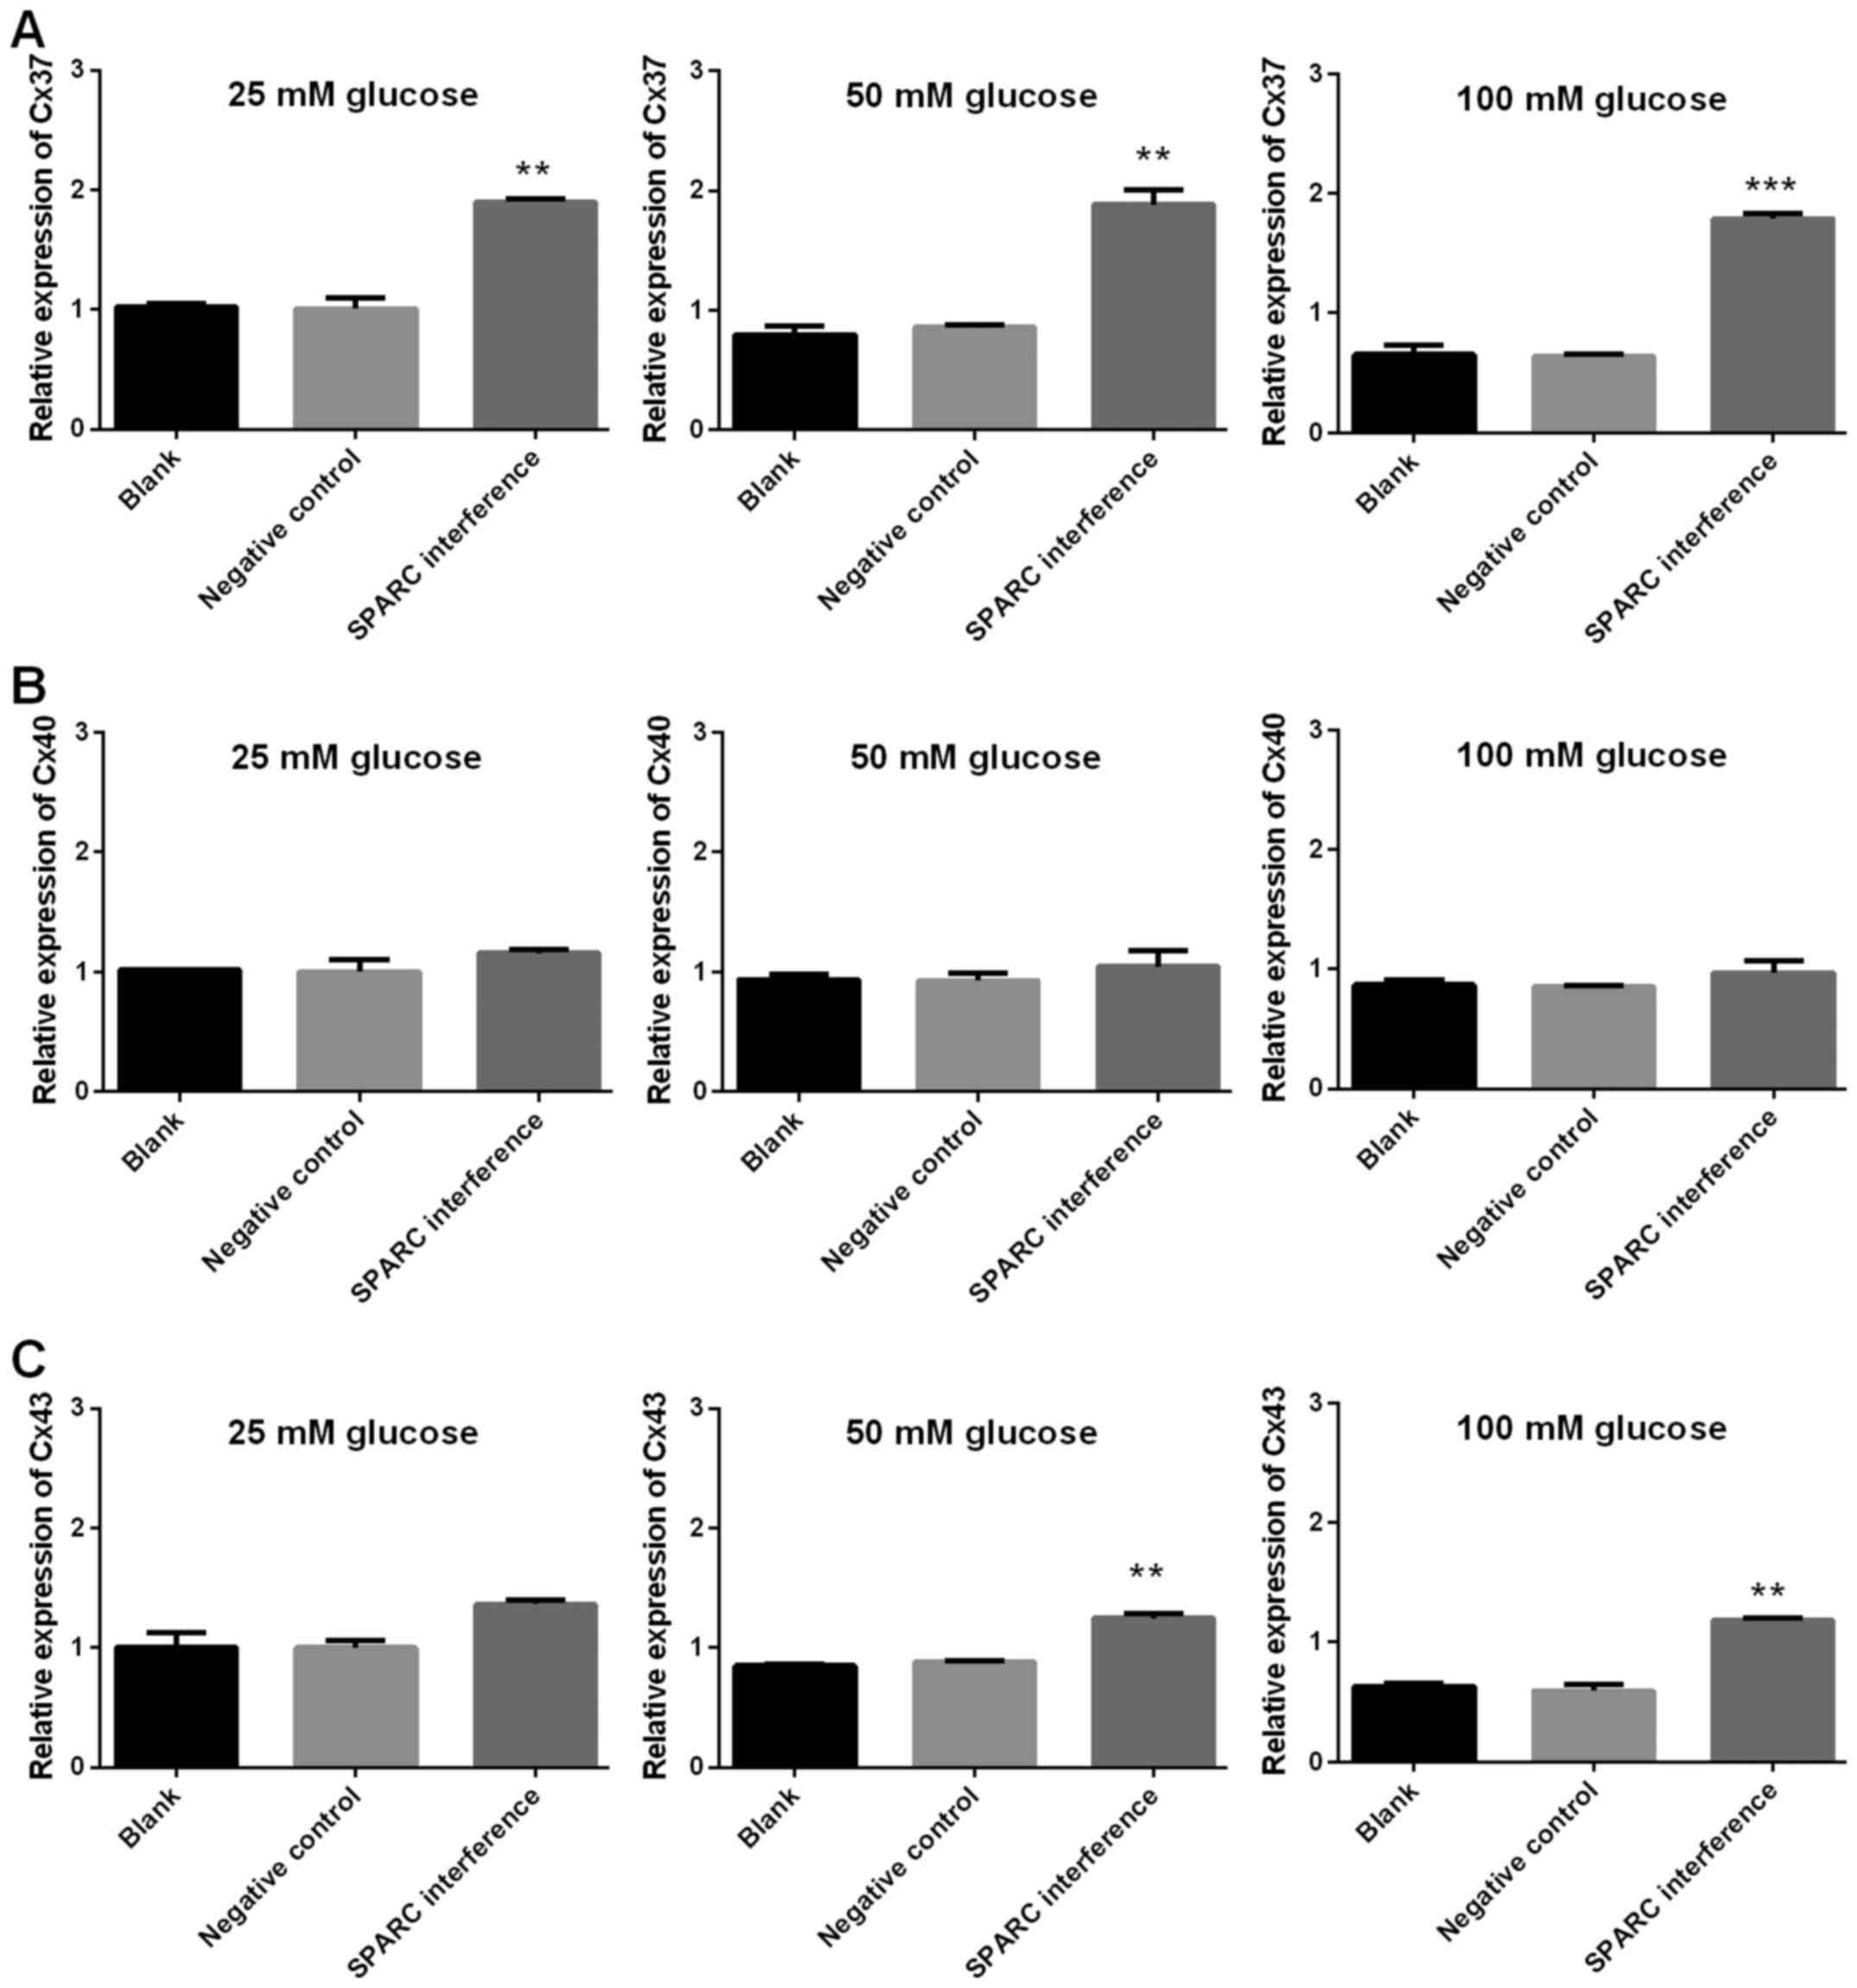
7). In addition, following treatment with glucose, the SPARC
interference group exhibited increased expression levels of genes
associated with gap junctions when compared with the negative
control group. These differences were indicated to be significant
with regard to Cx37 in the presence of 25, 50 and 100 mM glucose
and Cx43 in the presence of 25, 50 and 100 mM (P<0.01 and
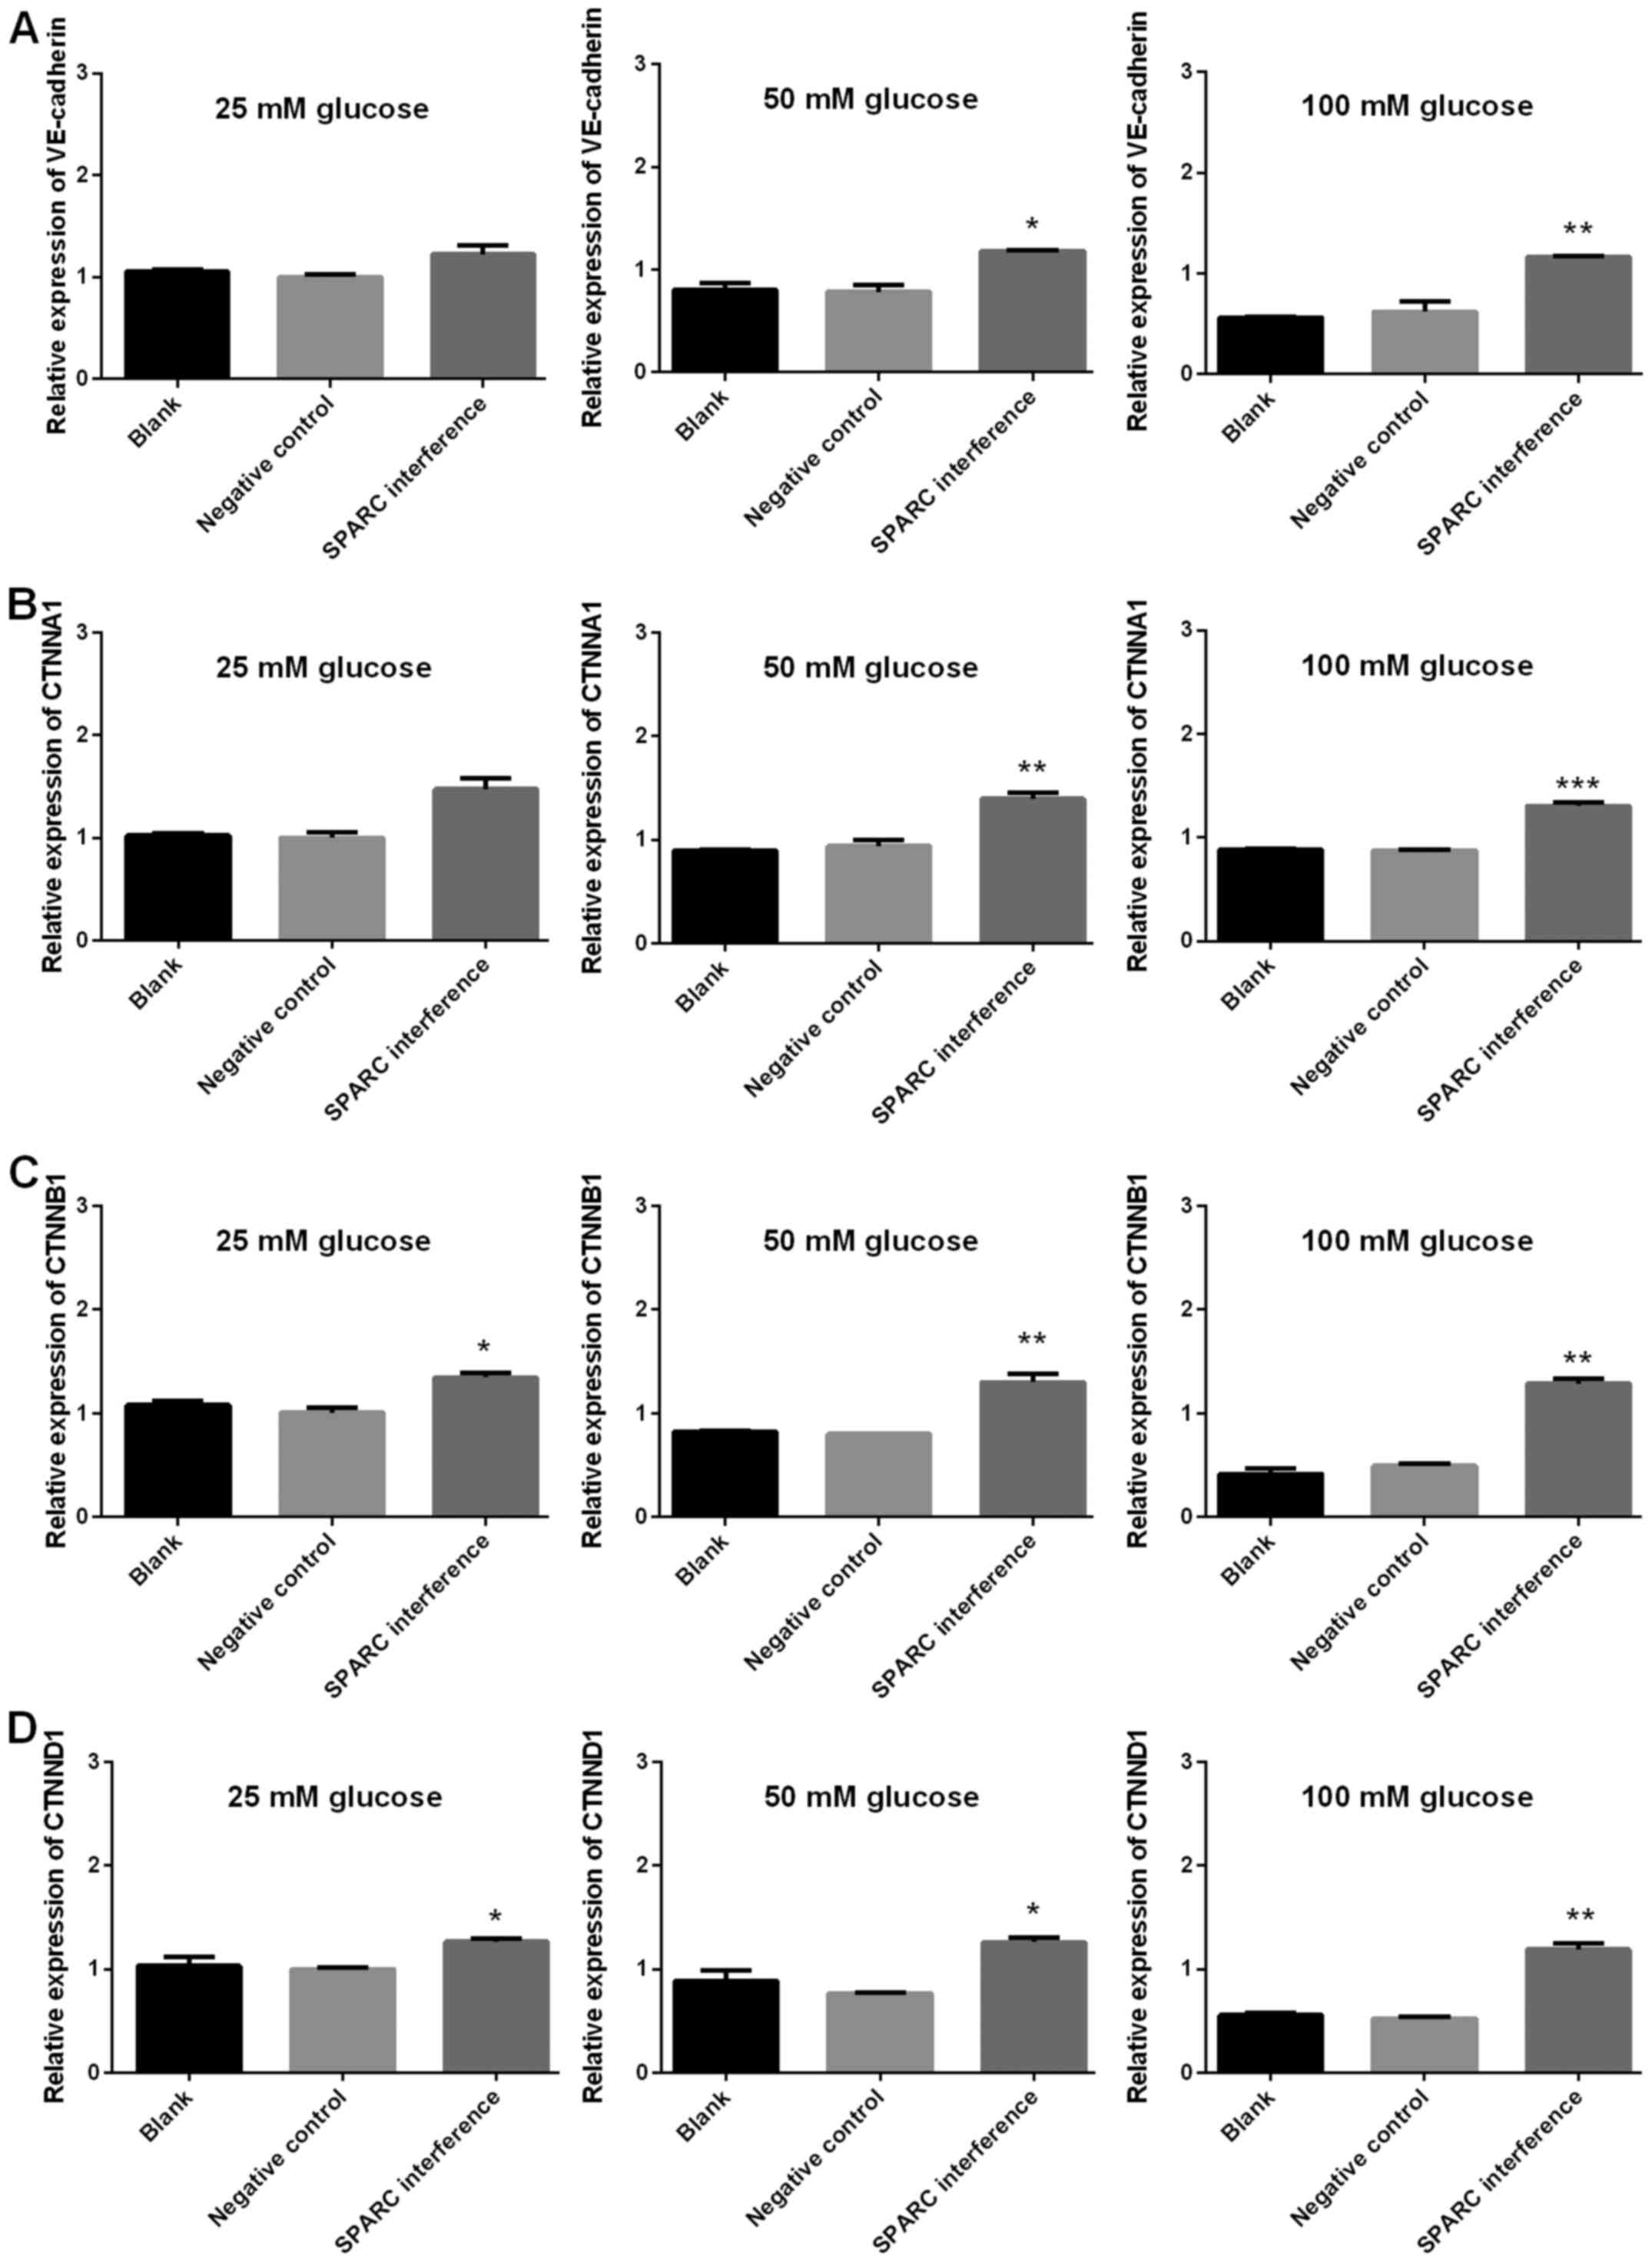
P<0.001; Fig. 8). Furthermore,
following treatment with glucose, the SPARC interference group
displayed significantly increased expression levels of genes
associated with adherens junctions compared with the negative
control group (VE-cadherin and CTNNA1, significant in the presence
of 50 and 100 mM glucose; CTNNB1 and CTNND1, significant in the
presence of 25, 50 and 100 mM glucose; P<0.05, P<0.01 and
P<0.001; Fig. 9).
Discussion
The present study demonstrated that the cell
viability, migration, cellular adhesion, and angiogenesis were
significantly inhibited by high concentrations of glucose, and the
inhibition could be reversed once the expression of SPARC was
inhibited.
SPARC is a widely expressed profibrotic protein with
pleiotropic roles, which have been studied in a variety of
conditions (18,19). Previous evidence has demonstrated
that SPARC was associated with human obesity and diabetes (11). In the present study, HRCECs were
cultured in vitro and a stably transfected SPARC
interference cell line was established. Notably, culture medium may
contain glucose (20). However, the
same volume and type of culture medium was added into blank,
negative control and SPARC groups. Therefore, the presence of any
glucose in culture medium did not alter the comparisons among three
experimental groups.
SPARC is a modulator of cell-surface interaction
(21). Tissue physiology can be
modulated by SPARC by altering cell proliferation and migration,
and interactions between cell and ECM (22). A previous study revealed that
adipocytes were recognized as the major source for producing
circulating SPARC, and insulin resistance in adipose tissue may be
caused by increased SPARC expression (23). Notably, the role of SPARC in diabetic
retinopathy has been rarely studied. However, the role of SPARC in
diabetes has been extensively studied. Xu et al (9) and Wu et al (10) have demonstrated that SPARC is an
independent negative indicator of diabetes, which correlates
significantly with inflammation, dyslipidemia and insulin
resistance. In the present study, the expression of SPARC was
significantly increased when HRCECs were stimulated with high
concentrations of glucose. Watanabe et al (24) demonstrated that the expression of
SPARC was high in proliferative diabetic retinopathy using
oligo-cap signal sequence trap strategy. These findings indicate
that SPARC may serve a potential regulatory role in patients with
diabetic retinopathy, which is a major complication among patients
with diabetes (25).
The present study revealed that high concentrations
of glucose inhibited cell viability and migration, which are
essential for the turnover and regeneration of capillary
endothelial cells (26). HRCECs may
be vulnerable to damage induced by pathological processes of
diabetic retinopathy, including oxidative stress, inflammation,
ischemia-reperfusion and hypoxia (27). Furthermore, impaired endothelial
cells, along with other vascular dysfunctions, can act as an
important implication for early diabetic retinopathy (28). The present study suggested that
downregulation of SPARC increased cell viability and migration,
which may have protective effects on capillary endothelial cells in
diabetic retinopathy.
The present data revealed that SPARC was highly
expressed, and angiogenesis was inhibited, when HRCECs were
cultured with high concentrations of glucose. Furthermore, when the
expression of SPARC was inhibited, angiogenesis was recovered.
Previous data demonstrated that SPARC was cell-type specific in
angiogenesis (29). Until now, to
the best of our knowledge no direct evidence has revealed that
SPARC is associated with angiogenesis in retinopathy. In gastric
cancer, Zhang et al (30)
demonstrated that the suppression of angiogenesis by SPARC may be
mediated by downregulating the expression of vascular endothelial
growth factor (VEGF) and matrix metalloproteinases (MMP-7).
Notably, overexpression of SPARC has also been demonstrated to be
involved in radiation-reduced tumor angiogenesis by downregulating
VEGF-A via microRNA-410 (31). The
pathway that is associated with angiogenesis in retinopathy and is
regulated by SPARC remains unclear. However, the present data
suggested that the cell viability, migration and permeability was
significantly associated with SPARC expression. Further studies are
required to fully explore the possible molecular mechanisms of
SPARC in angiogenesis in patients with diabetic retinopathy.
The present findings also indicated that high
concentrations of glucose significantly inhibited the expression of
genes associated with cell tight junctions, gap junctions and
adherens junctions. However, when SPARC was downregulated, the
expression levels of those genes increased. Previous research has
demonstrated that the collapse of cell junctions caused
hyperpermeability of retinal capillary endothelial cells and
vascular leakage (32). In patients
with diabetic retinopathy, such hyperpermeability caused leakage of
macromolecules, proteins and electrolytes into tissue space with
sera, thereby increasing interstitial osmolarity and exacerbating
vascular leakage. This in turn formed severe diabetic macular edema
(DME) (33). Nowadays, DME is known
as one of most severe complications and leading cause of vision
loss in diabetic retinopathy (34).
SPARC, as a key regulator in cell permeability, may be promising in
treatment of DME in future clinical practice.
In conclusion, the present data demonstrated that
cell viability, migration, cellular adhesion and angiogenesis of
retinal capillary endothelial cells exposed to high concentrations
of glucose may be mediated, at least in part, by changes in the
expression of SPARC. Alterations of SPARC expression may contribute
to the development and pathogenesis of diabetic retinopathy.
Although further studies are required to fully clarify the role of
SPARC in neovascularization and fibrosis, the present analysis on
the role of SPARC expression may provide insights on future
therapeutic approaches for diabetic retinopathy.
Acknowledgements
Not applicable.
Funding
The present study was supported by the National
Natural Science Fund of China (grant no. 81570851).
Availability of data and materials
The datasets used and/or analyzed during the current
study are available from the corresponding author on reasonable
request.
Authors' contributions
XX designed and performed the experiments. YF and MT
interpreted the data, drafted the manuscript and provided
experimental support. XQX and KL collected and analyzed the data.
All authors read and approved the final manuscript.
Ethics approval and consent to
participate
The present study was approved by the Ethics
Committee of Shanghai General Hospital, (Shanghai, China;
Registration no. 2015 K061).
Patient consent for publication
Not applicable.
Competing interests
The authors declare that they have no competing
interests.
References
|
1
|
Smith-Morris C, Bresnick GH, Cuadros J,
Bouskill KE and Pedersen ER: Diabetic retinopathy and the cascade
into vision loss. Med Anthropol. 17:1–14. 2018. View Article : Google Scholar
|
|
2
|
Gella L, Raman R, Pal SS, Ganesan S and
Sharma T: Incidence, progression, and associated risk factors of
posterior vitreous detachment in type 2 diabetes mellitus: Sankara
nethralaya diabetic retinopathy epidemiology and molecular genetic
study (SN-DREAMS II, Report No. 7). Semin Ophthalmol. 32:191–197.
2017. View Article : Google Scholar : PubMed/NCBI
|
|
3
|
Raman R, Ganesan S, Pal SS, Gella L,
Kulothungan V and Sharma T: Incidence and progression of diabetic
retinopathy in urban India: Sankara nethralaya-diabetic retinopathy
epidemiology and molecular genetics study (SN-DREAMS II), Report 1.
Ophthalmic Epidemiol. 24:294–302. 2017. View Article : Google Scholar : PubMed/NCBI
|
|
4
|
Capitão M and Soares R: Angiogenesis and
inflammation crosstalk in diabetic retinopathy. J Cell Biochem.
117:2443–2453. 2016. View Article : Google Scholar : PubMed/NCBI
|
|
5
|
Zhou L, Zhang T, Lu B, Yu Z, Mei X,
Abulizi P and Ji L: Lonicerae Japonicae Flos attenuates diabetic
retinopathy by inhibiting retinal angiogenesis. J Ethnopharmacol.
189:117–125. 2016. View Article : Google Scholar : PubMed/NCBI
|
|
6
|
Tanaka M, Takagi T, Naito Y, Uchiyama K,
Hotta Y, Toyokawa Y, Ushiroda C, Hirai Y, Aoi W, Higashimura Y, et
al: Secreted protein acidic and rich in cysteine functions in
colitis via IL17A regulation in mucosal CD4+ T cells. J
Gastroenterol Hepatol. 33:671–680. 2018. View Article : Google Scholar : PubMed/NCBI
|
|
7
|
Toyota K, Murakami Y, Kondo N, Uemura K,
Nakagawa N, Takahashi S and Sueda T: Impact of secreted protein
acidic and rich in cysteine (SPARC) expression on prognosis after
surgical resection for biliary carcinoma. J Gastrointest Surg.
21:990–999. 2017. View Article : Google Scholar : PubMed/NCBI
|
|
8
|
Kos K and Wilding JP: SPARC: A key player
in the pathologies associated with obesity and diabetes. Nat Rev
Endocrinol. 6:225–235. 2010. View Article : Google Scholar : PubMed/NCBI
|
|
9
|
Xu L, Ping F, Yin J, Xiao X, Xiang H,
Ballantyne CM, Wu H and Li M: Elevated plasma SPARC levels are
associated with insulin resistance, dyslipidemia, and inflammation
in gestational diabetes mellitus. PLoS One. 8:e816152013.
View Article : Google Scholar : PubMed/NCBI
|
|
10
|
Wu D, Li L, Yang M, Liu H and Yang G:
Elevated plasma levels of SPARC in patients with newly diagnosed
type 2 diabetes mellitus. Eur J Endocrinol. 165:597–601. 2011.
View Article : Google Scholar : PubMed/NCBI
|
|
11
|
Jandeleit-Dahm K, Rumble J, Cox AJ, Kelly
DJ, Dziadek M, Cooper ME and Gilbert RE: SPARC gene expression is
increased in diabetes-related mesenteric vascular hypertrophy.
Microvasc Res. 59:61–71. 2000. View Article : Google Scholar : PubMed/NCBI
|
|
12
|
Zufferey R, Nagy D, Mandel RJ, Naldini L
and Trono D: Multiply attenuated lentiviral vector achieves
efficient gene delivery in vivo. Nat Biotechnol. 15:871–875. 1997.
View Article : Google Scholar : PubMed/NCBI
|
|
13
|
Huang W, Yan Z, Li D, Ma Y, Zhou J and Sui
Z: Antioxidant and anti-inflammatory effects of blueberry
anthocyanins on high glucose-induced human retinal capillary
endothelial cells. Oxid Med Cell Longev. 2018:18624622018.
View Article : Google Scholar : PubMed/NCBI
|
|
14
|
Farjo KM, Farjo RA, Halsey S, Moiseyev G
and Ma JX: Retinol-binding protein 4 induces inflammation in human
endothelial cells by an NADPH oxidase- and nuclear factor kappa
B-dependent and retinol-independent mechanism. Mol Cell Biol.
32:5103–5115. 2012. View Article : Google Scholar : PubMed/NCBI
|
|
15
|
Francescone RA III, Faibish M and Shao R:
A Matrigel-based tube formation assay to assess the vasculogenic
activity of tumor cells. J Vis Exp. 2011. View Article : Google Scholar : PubMed/NCBI
|
|
16
|
Landt S, Heidecke H, Korlach S, Reuter C,
Schwidde I, Barinoff J, Thill M, Sehouli J and Kümmel S: In vitro
vascular tube formation testing as a tool for treatment
individualisation in patients with cervical cancer. Anticancer Res.
31:2609–2615. 2011.PubMed/NCBI
|
|
17
|
Livak KJ and Schmittgen TD: Analysis of
relative gene expression data using real-time quantitative PCR and
the 2(-Delta Delta C(T)) method. Methods. 25:402–408. 2001.
View Article : Google Scholar : PubMed/NCBI
|
|
18
|
Chlenski A, Dobratic M, Salwen HR,
Applebaum M, Guerrero LJ, Miller R, DeWane G, Solomaha E, Marks JD
and Cohn SL: Secreted protein acidic and rich in cysteine (SPARC)
induces lipotoxicity in neuroblastoma by regulating transport of
albumin complexed with fatty acids. Oncotarget. 7:77696–77706.
2016. View Article : Google Scholar : PubMed/NCBI
|
|
19
|
Kao SC, Kirschner MB, Cooper WA, Tran T,
Burgers S, Wright C, Korse T, van den Broek D, Edelman J, Vallely
M, et al: A proteomics-based approach identifies secreted protein
acidic and rich in cysteine as a prognostic biomarker in malignant
pleural mesothelioma. Br J Cancer. 114:524–531. 2016. View Article : Google Scholar : PubMed/NCBI
|
|
20
|
Abe T, Takahashi S and Suzuki N: Oxidative
metabolism in cultured rat astroglia: Effects of reducing the
glucose concentration in the culture medium and of D-aspartate or
potassium stimulation. J Cereb Blood Flow Metab. 26:153–160. 2006.
View Article : Google Scholar : PubMed/NCBI
|
|
21
|
Norose K, Lo WK, Clark JI, Sage EH and
Howe CC: Lenses of SPARC-null mice exhibit an abnormal cell
surface-basement membrane interface. Exp Eye Res. 71:295–307. 2000.
View Article : Google Scholar : PubMed/NCBI
|
|
22
|
Bornstein P: Diversity of function is
inherent in matricellular proteins: An appraisal of thrombospondin
1. J Cell Biol. 130:503–506. 1995. View Article : Google Scholar : PubMed/NCBI
|
|
23
|
Bailey-Serres J, Sorenson R and Juntawong
P: Getting the message across: Cytoplasmic ribonucleoprotein
complexes. Trends Plant Sci. 14:443–453. 2009. View Article : Google Scholar : PubMed/NCBI
|
|
24
|
Watanabe K, Okamoto F, Yokoo T, Iida KT,
Suzuki H, Shimano H, Oshika T, Yamada N and Toyoshima H: SPARC is a
major secretory gene expressed and involved in the development of
proliferative diabetic retinopathy. J Atheroscler Thromb. 16:69–76.
2009. View
Article : Google Scholar : PubMed/NCBI
|
|
25
|
Song SJ, Han K, Choi KS, Ko SH, Rhee EJ,
Park CY, Park JY, Lee KU and Ko KS: Task Force Team for Diabetes
Fact Sheet of the Korean Diabetes Association: Trends in diabetic
retinopathy and related medical practices among type 2 diabetes
patients: Results from the National Insurance Service Survey
2006–2013. J Diabetes Investig. 9:173–178. 2017. View Article : Google Scholar : PubMed/NCBI
|
|
26
|
Wang FH, Sun XD, Zhang X, Xu X, Zhu Q,
Huang JN, Fan Y, Gu Q and Liu HY: Role of pigment
epithelium-derived factor on proliferation and migration of
choroidal capillary endothelium induced by vascular endothelial
growth factor in vitro. Chin Med J (Engl). 120:1534–1538.
2007.PubMed/NCBI
|
|
27
|
Wang X, Wang G and Wang Y: Intravitreous
vascular endothelial growth factor and hypoxia-inducible factor 1a
in patients with proliferative diabetic retinopathy. Am J
Ophthalmol. 148:883–889. 2009. View Article : Google Scholar : PubMed/NCBI
|
|
28
|
Rubsam A, Parikh S and Fort PE: Role of
inflammation in diabetic retinopathy. Int J Mol Sci. 19:pii: E942.
2018. View Article : Google Scholar : PubMed/NCBI
|
|
29
|
Rivera LB, Bradshaw AD and Brekken RA: The
regulatory function of SPARC in vascular biology. Cell Mol Life
Sci. 68:3165–3173. 2011. View Article : Google Scholar : PubMed/NCBI
|
|
30
|
Zhang JL, Chen GW, Liu YC, Wang PY, Wang
X, Wan YL, Zhu J, Gao HQ, Yin J, Wang W and Tian ML: Secreted
protein acidic and rich in cysteine (SPARC) suppresses angiogenesis
by down-regulating the expression of VEGF and MMP-7 in gastric
cancer. PLoS One. 7:e446182012. View Article : Google Scholar : PubMed/NCBI
|
|
31
|
Boyineni J, Tanpure S, Gnanamony M, Antony
R, Fernández KS, Lin J, Pinson D and Gondi CS: SPARC overexpression
combined with radiation retards angiogenesis by suppressing VEGF-A
via miR410 in human neuroblastoma cells. Int J Oncol. 49:1394–1406.
2016. View Article : Google Scholar : PubMed/NCBI
|
|
32
|
Rahimi N: Defenders and challengers of
endothelial barrier function. Front Immunol. 8:18472018. View Article : Google Scholar
|
|
33
|
Klaassen I, Van Noorden CJ and
Schlingemann RO: Molecular basis of the inner blood-retinal barrier
and its breakdown in diabetic macular edema and other pathological
conditions. Prog Retin Eye Res. 34:19–48. 2013. View Article : Google Scholar : PubMed/NCBI
|
|
34
|
Tan GS, Cheung N, Simo R, Cheung GC and
Wong TY: Diabetic macular oedema. Lancet Diabetes Endocrinol.
5:143–155. 2017. View Article : Google Scholar : PubMed/NCBI
|