Introduction
Diabetes is a complex metabolic disorder associated
with increased blood glucose levels (1), and which may be categorized into
different types, including type 1, type 2 and gestational diabetes
(2). Type 2 diabetes mellitus (T2DM)
accounts for >90% of cases of diabetes and is caused by insulin
resistance (3,4). Rosiglitazone belongs to the class of
thiazolidinedione drugs and is widely used for treating patients
with T2DM (5). Rosiglitazone
enhances insulin sensitivity by activating peroxisome
proliferator-activated receptor-γ (PPAR-γ) (6). Mayerson et al (7) reported that rosiglitazone enhanced
insulin sensitivity in the peripheral adipocytes of patients with
T2DM and reduced fatty acids. Various in vivo studies have
indicated that the mechanism of action of rosiglitazone is closely
associated with the lipid concentration and insulin resistance
(8–10). However, the detailed mechanism of
action of rosiglitazone in patients with T2DM remains elusive.
Furthermore, cardiovascular disease is the major
cause of morbidity and mortality for patients with T2DM. However,
rosiglitazone significantly increases the risk of cardiovascular
disease in patients with T2DM (11),
with a 43% increase in myocardial infarction and a 64% increase in
mortalities associated with cardiovascular morbidity. In addition,
a meta-analysis by Singh et al (12) revealed that rosiglitazone greatly
increases the risk of myocardial infarction and heart failure
following long-term treatment. However, another study suggested
that rosiglitazone did not increase the overall cardiovascular risk
compared with that associated with metformin or a sulfonyl urea
(13). Recently, the US Food and
Drug Administration concluded that rosiglitazone is safe regarding
cardiovascular outcomes (https://www.fda.gov/downloads/Drugs/DrugSafety/UCM477575.pdf).
Therefore, the mechanisms of the effects of rosiglitazone
associated with cardiovascular outcomes in patients with T2DM
should be evaluated.
The present bioinformatics study was performed to
identify candidate genes associated with the effects of
rosiglitazone to exert glycemic control and cardiovascular
conditions in T2DM, and to elucidate the underlying mechanisms of
its action. The gene expression profiles of the dataset GSE36875
from the National Center for Bioinformatics analysis (NCBI) Gene
Expression Omnibus (GEO) database (http://www.ncbi.nlm.nih.gov/geo/), including 5 heart
samples from untreated diabetic mice (NH), 5 heart samples from
rosiglitazone-treated diabetic mice (TH) and 5 hears samples from
non-diabetic control mice (NC), was used to identify differentially
expressed genes (DEGs) in the NC vs. NH, NC vs. TH and TH vs. NH
groups. Subsequently, all DEGs were used to identify the Kyoto
Encyclopedia of Genes and Genomes (KEGG) pathways enriched by the
DEGs using the Database for Annotation, Visualization and
Integrated Discovery (DAVID) tool (version 6.8; http://david.ncifcrf.gov). In addition, genes
associated with the effects of rosiglitazone were identified using
Short Time-series Expression Miner (STEM), a Gene Ontology (GO)
function analysis was performed and a network of KEGG pathways, GO
terms and genes associated with the effects of rosiglitazone was
constructed. Finally, biological abnormalities associated with
these target genes were identified using WebGestalt (http://www.webgestalt.org/option.php).
Materials and methods
Microarray data and
pre-processing
The gene expression profiles of the dataset GSE36875
were downloaded from the GEO database. The data of the
Agilent-014868 whole mouse genome microarray 4×44K G4122F of heart
tissues were deposited on the GPL4134 platform by Wilson et
al (14), with the groups
including the NH group, the TH group and the NC group (n=5 per
group).
The probes corresponded to gene symbols according to
the latest annotations file from the NCBI gene database. If one
gene symbol was matched to multiple probe IDs, the mean expression
value was calculated as the expression level of this gene.
Subsequently, these data were fitted to a log-normal distribution
using a log2-transformed function and normalized using the median
function of the limma package in R software (version 3.3.2,
http://cran.r-project.org/bin/windows/base/) (15,16).
Identification of DEGs
DEGs in the NC vs. NH, NC vs. TH and TH vs. NH
groups were identified using the limma package. The thresholds for
the DEGs were set as a |log2 FC (fold change) >0.585
and a false discovery rate (FDR) <0.05. Finally, a heatmap for
the DEGs was generated using the pheatmap package in R software
with two-way hierarchical clustering according to the Euclidean
distance (17).
Pathway analyses of DEGs
KEGG pathway enrichment analysis of DEGs was
performed to determine the pathways of DEGs in the NC vs. NH, NC
vs. TH and TH vs. NH groups using DAVID 6.8 according to Fisher's
exact test. P<0.05 was considered to indicate a statistically
significant difference.
Series test of cluster (STC) and
network of GO functions and pathways
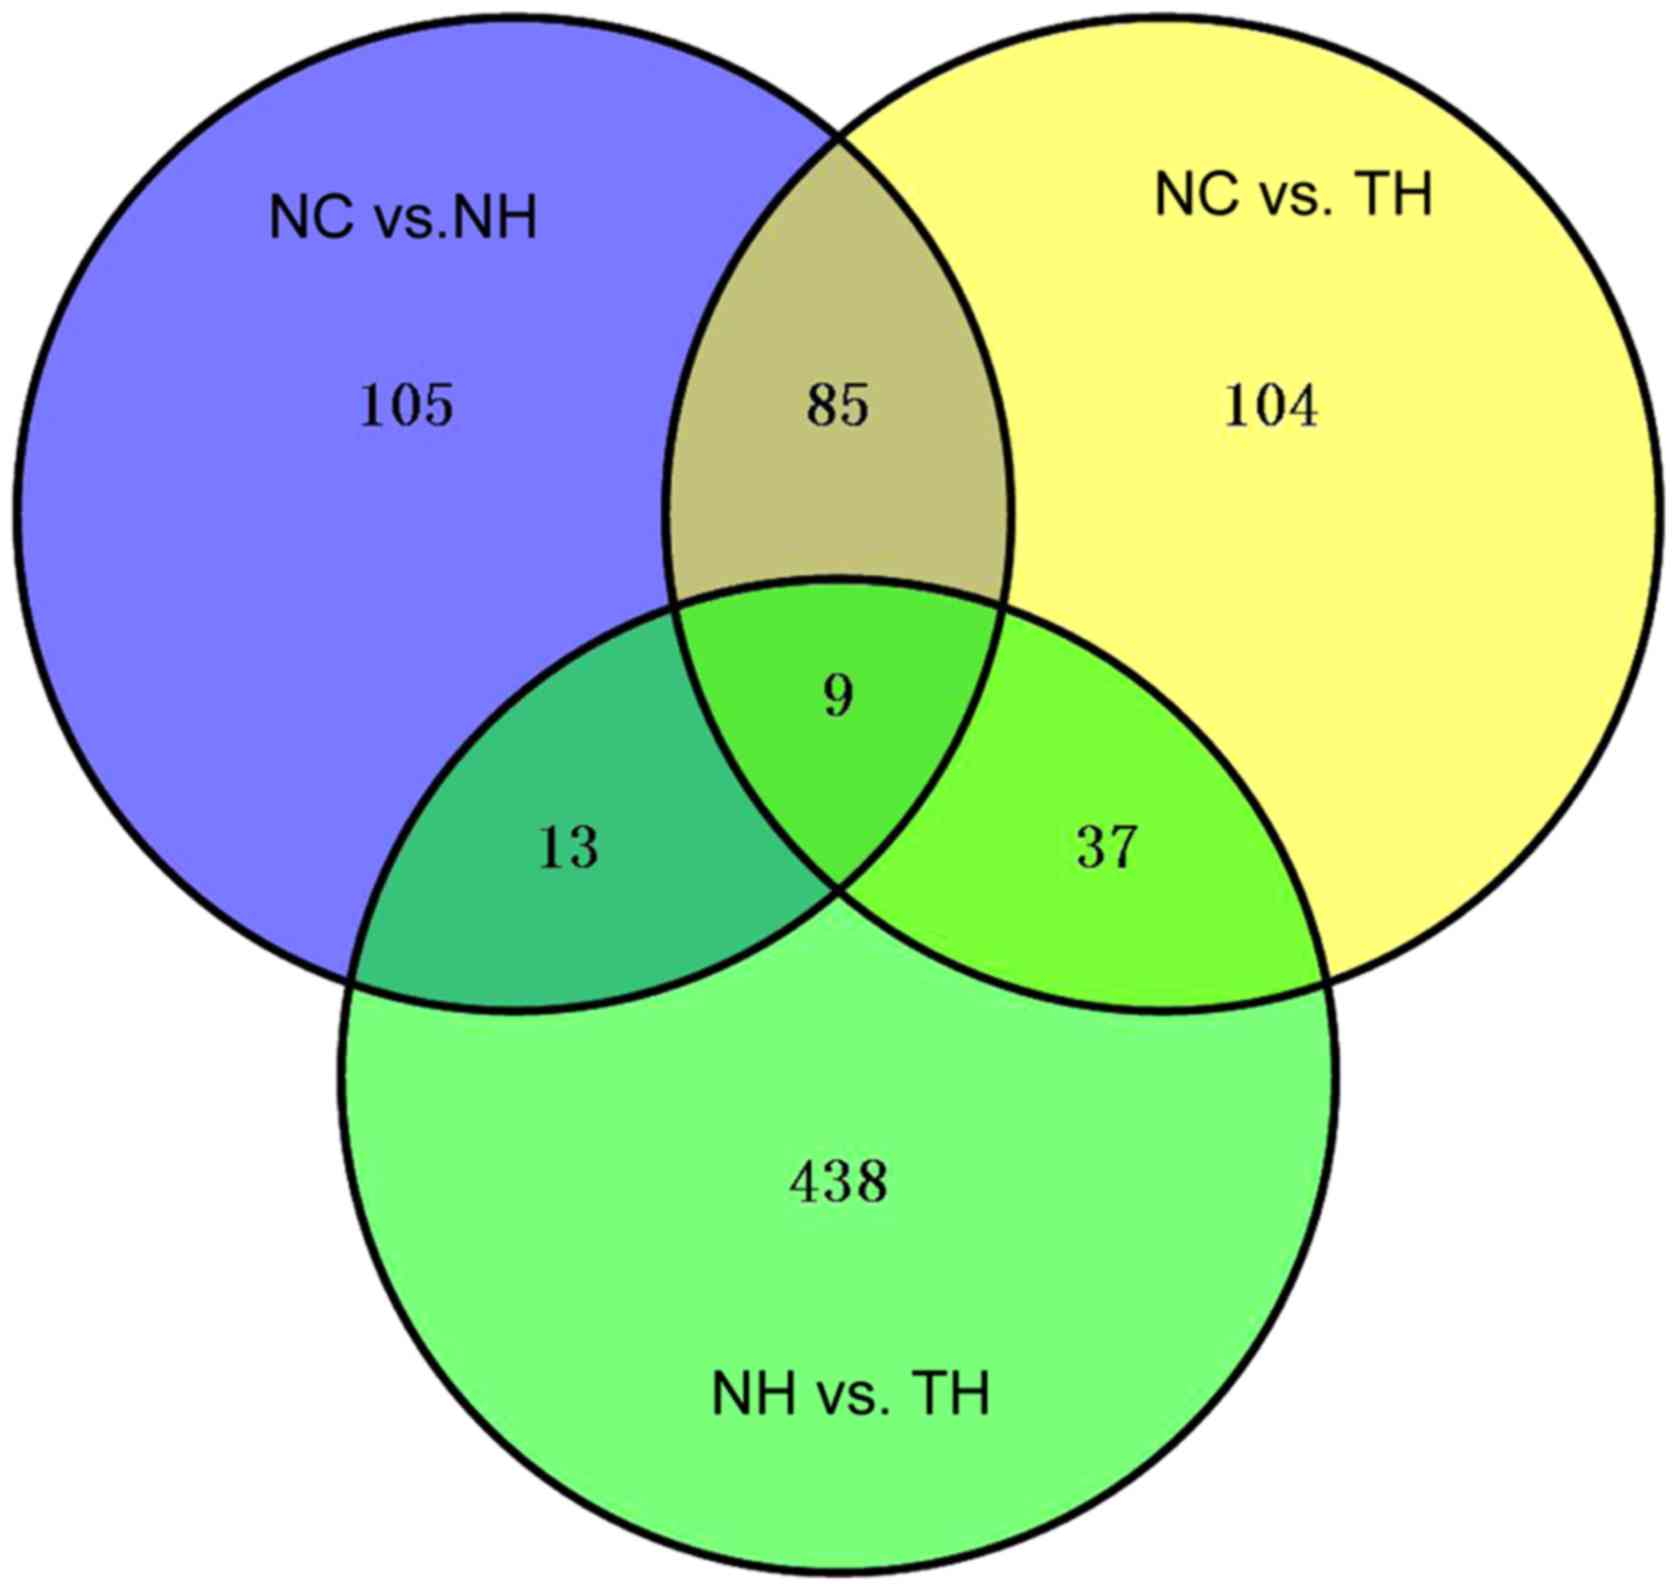
First, the set of DEGs in these 3 groups (NC vs. NH,
NC vs. TH and NH vs. TH) was obtained using a Venn diagram. STEM is
a unique method for clustering, comparing and visualizing a series
of gene expression data obtained under different experimental
conditions (18). STEM (version
1.3.11, http://www.cs.cmu.edu/~jernst/stem) was used for STC
with a clustering coefficient of >0.8 to determine which profile
was significantly associated with the different types of samples
that were treated with (NC and NH) or without rosiglitazone (TH)
under the ordering of time-points compared to the other profiles.
P<0.05 was considered to indicate a statistically significant
difference. Genes in the significant model profiles were drug
function-associated genes. GO function and KEGG pathway enrichment
analyses of these genes were performed using DAVID version 6.8.
Finally, a GO function and pathway network of drug
function-associated genes was constructed.
Identification of biological
abnormalities linked to rosiglitazone function-associated
genes
To further elucidate the role of rosiglitazone
function-associated genes in the body, WebGestalt was used to
identify biological abnormalities linked to these target genes. The
threshold value was set at P<0.05.
Results
DEGs in the three groups
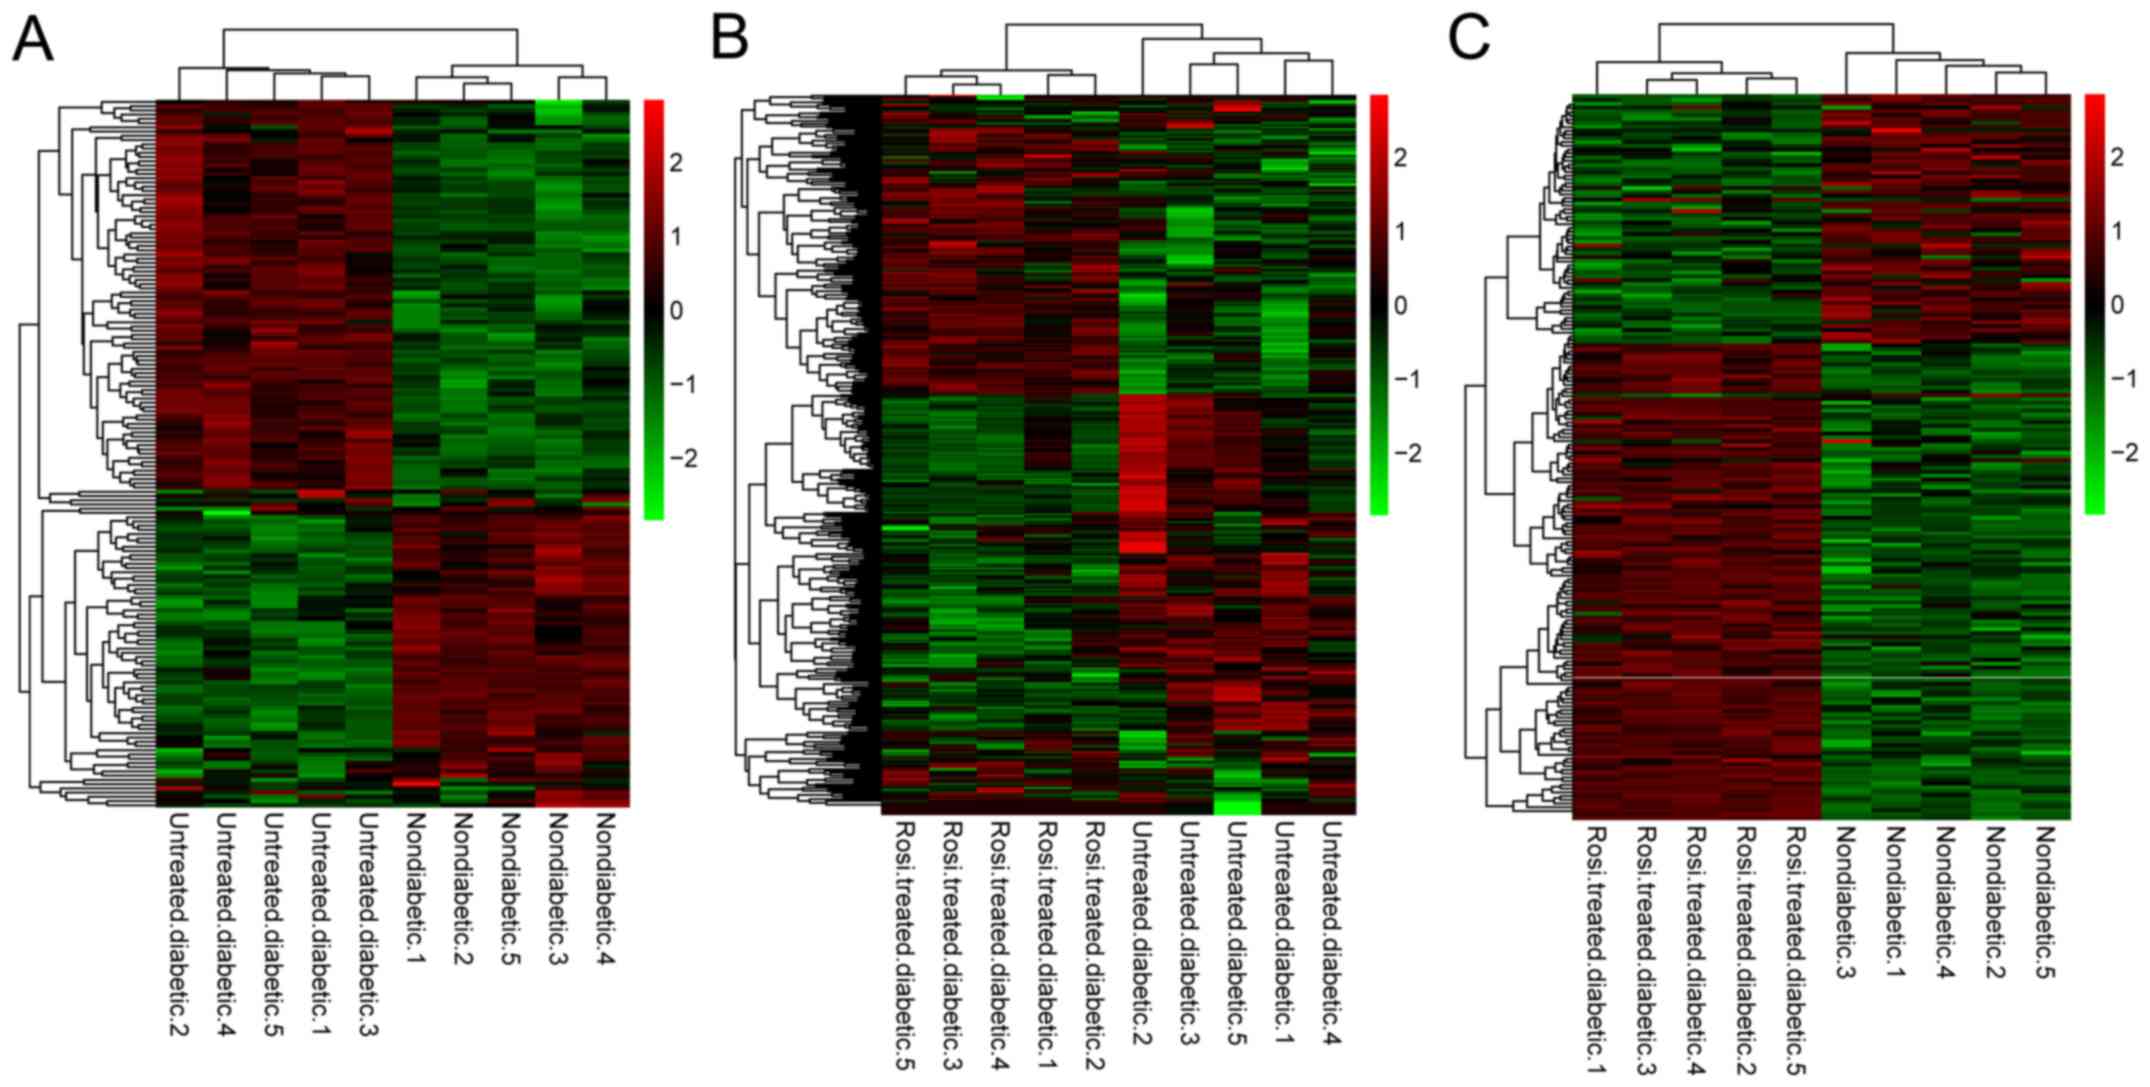
In diabetic mice, a total of 212 DEGs in the heart
tissue of the NC vs. NH group were identified, including 87
downregulated and 125 upregulated DEGs. A total of 497 DEGs were
identified for the NH vs. TH group, including 281 downregulated and
216 upregulated DEGs. In the NC vs. TH group, there were 235 DEGs,
including 84 downregulated and 151 upregulated DEGs (Table I). In addition, the clustering
heatmap demonstrated that different types of samples could be
separated based on DEG expression values, indicating differences in
gene expression characteristic screening was significant (Fig. 1).
 | Table I.Count of differentially expressed
genes between pairs of the different experimental groups. |
Table I.
Count of differentially expressed
genes between pairs of the different experimental groups.
| Comparison | Upregulated | Downregulated | Total |
|---|
| NC vs. NH | 125 | 87 | 212 |
| NH vs. TH | 216 | 281 | 497 |
| NC vs. TH | 151 | 84 | 235 |
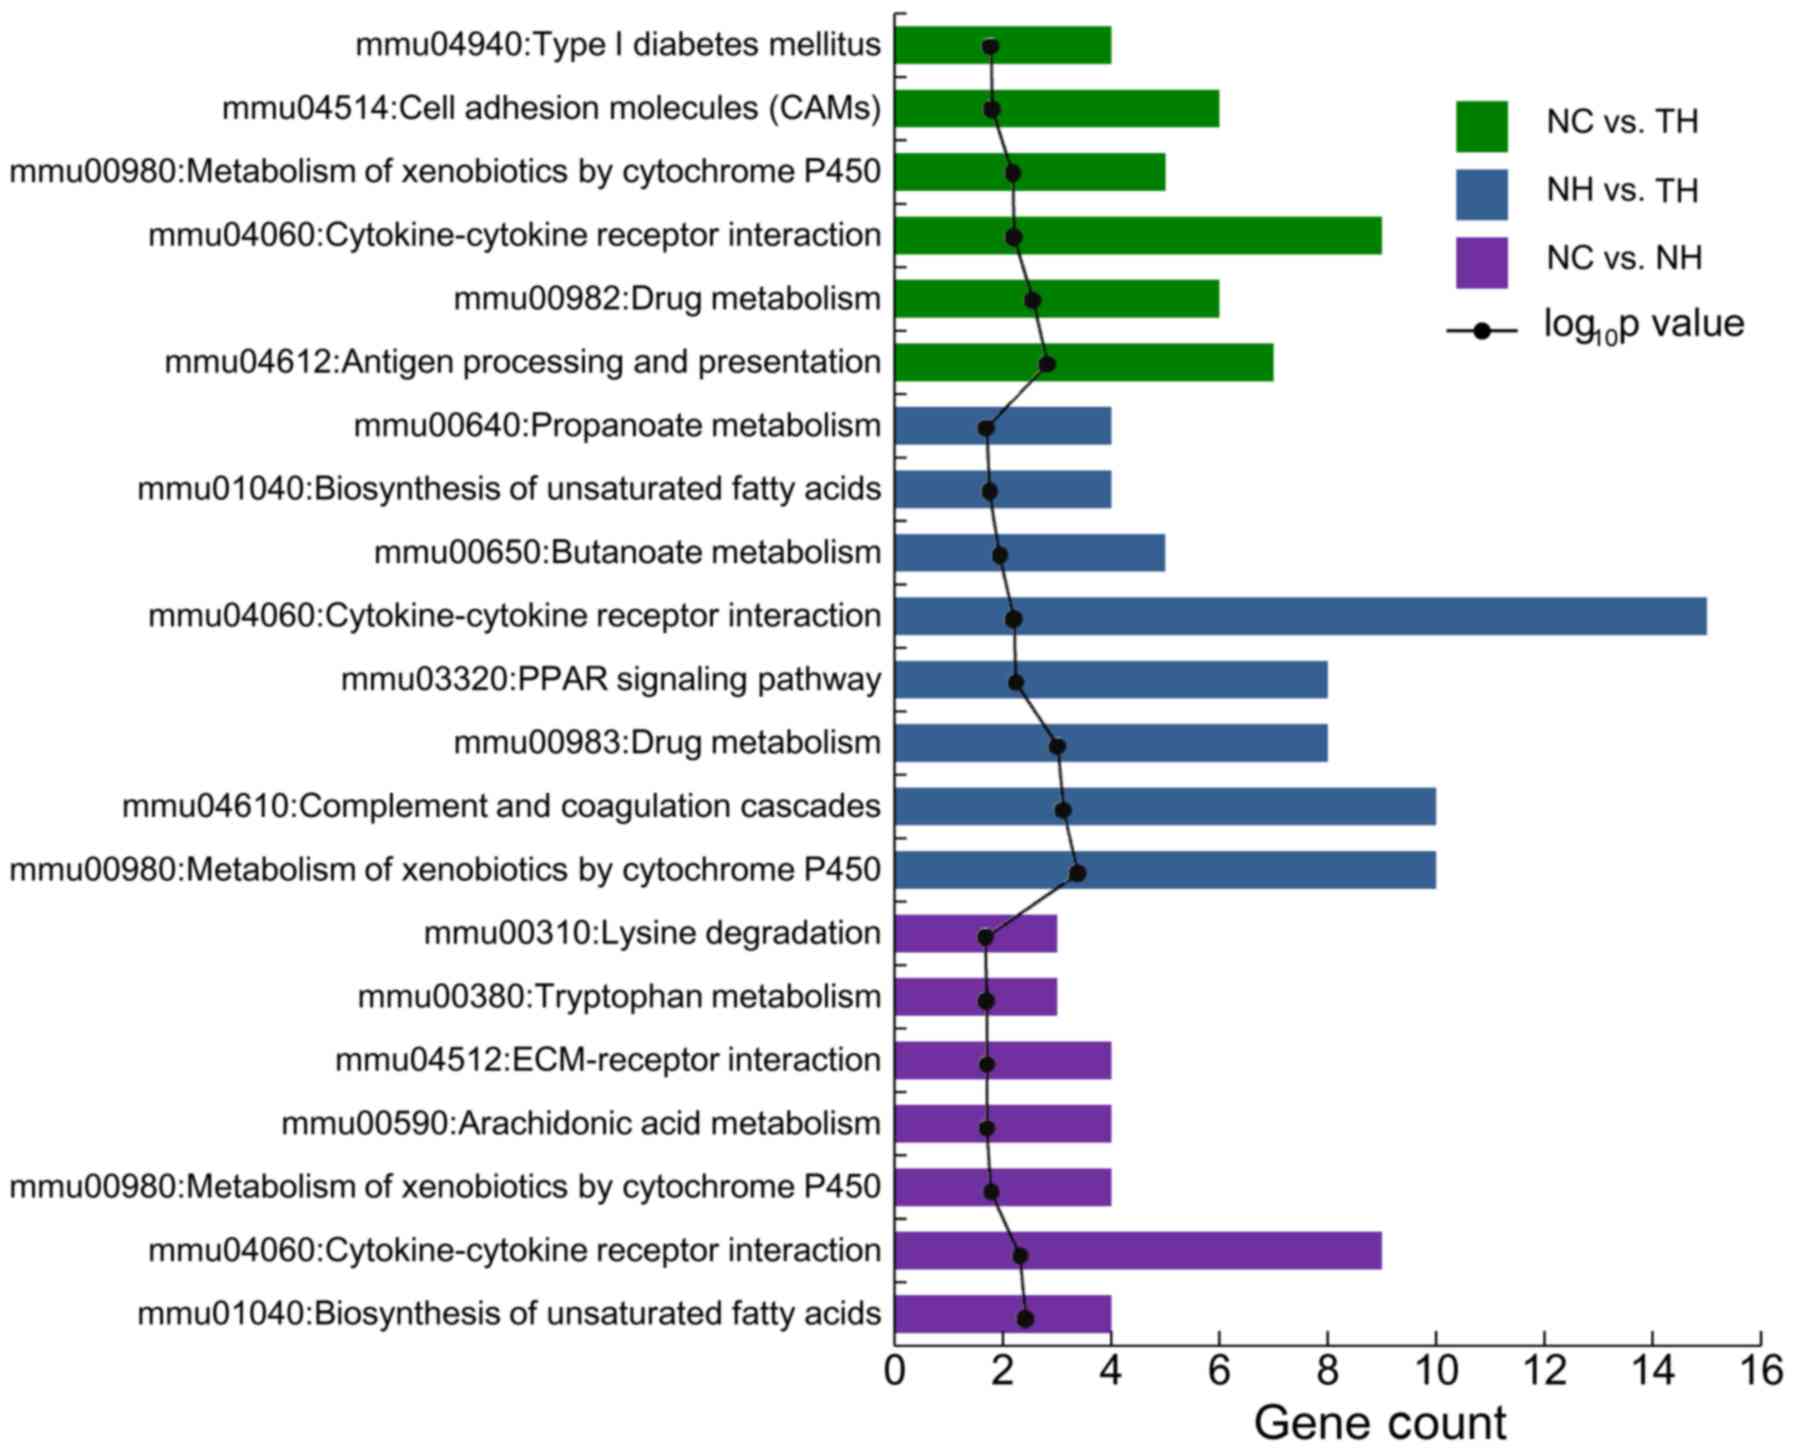
Pathways enriched by DEGs of pairs of the three
groups. Among the DEGs for the NC vs. NH group 7 enriched pathways
were identified, including cytokine-cytokine receptor interaction,
biosynthesis of unsaturated fatty acids and metabolism of
xenobiotics by cytochrome P450 (Cyp). Furthermore, 8 enriched
pathways were identified to be enriched by the DEGs in the NH vs.
TH group, including cytokine-cytokine receptor interaction,
metabolism of xenobiotics by Cyps, including Cyp2c37, Cyp3a25 and
Cyp3a16, and the peroxisome proliferator-activated receptor (PPAR)
signaling pathway, including apolipoprotein (Apo)A1 and ApoA5. A
total of 6 pathways were identified to be enriched among the DEGs
in the NC vs. TH group, including cytokine-cytokine receptor
interaction, antigen processing and presentation, and drug
metabolism (Fig. 2).
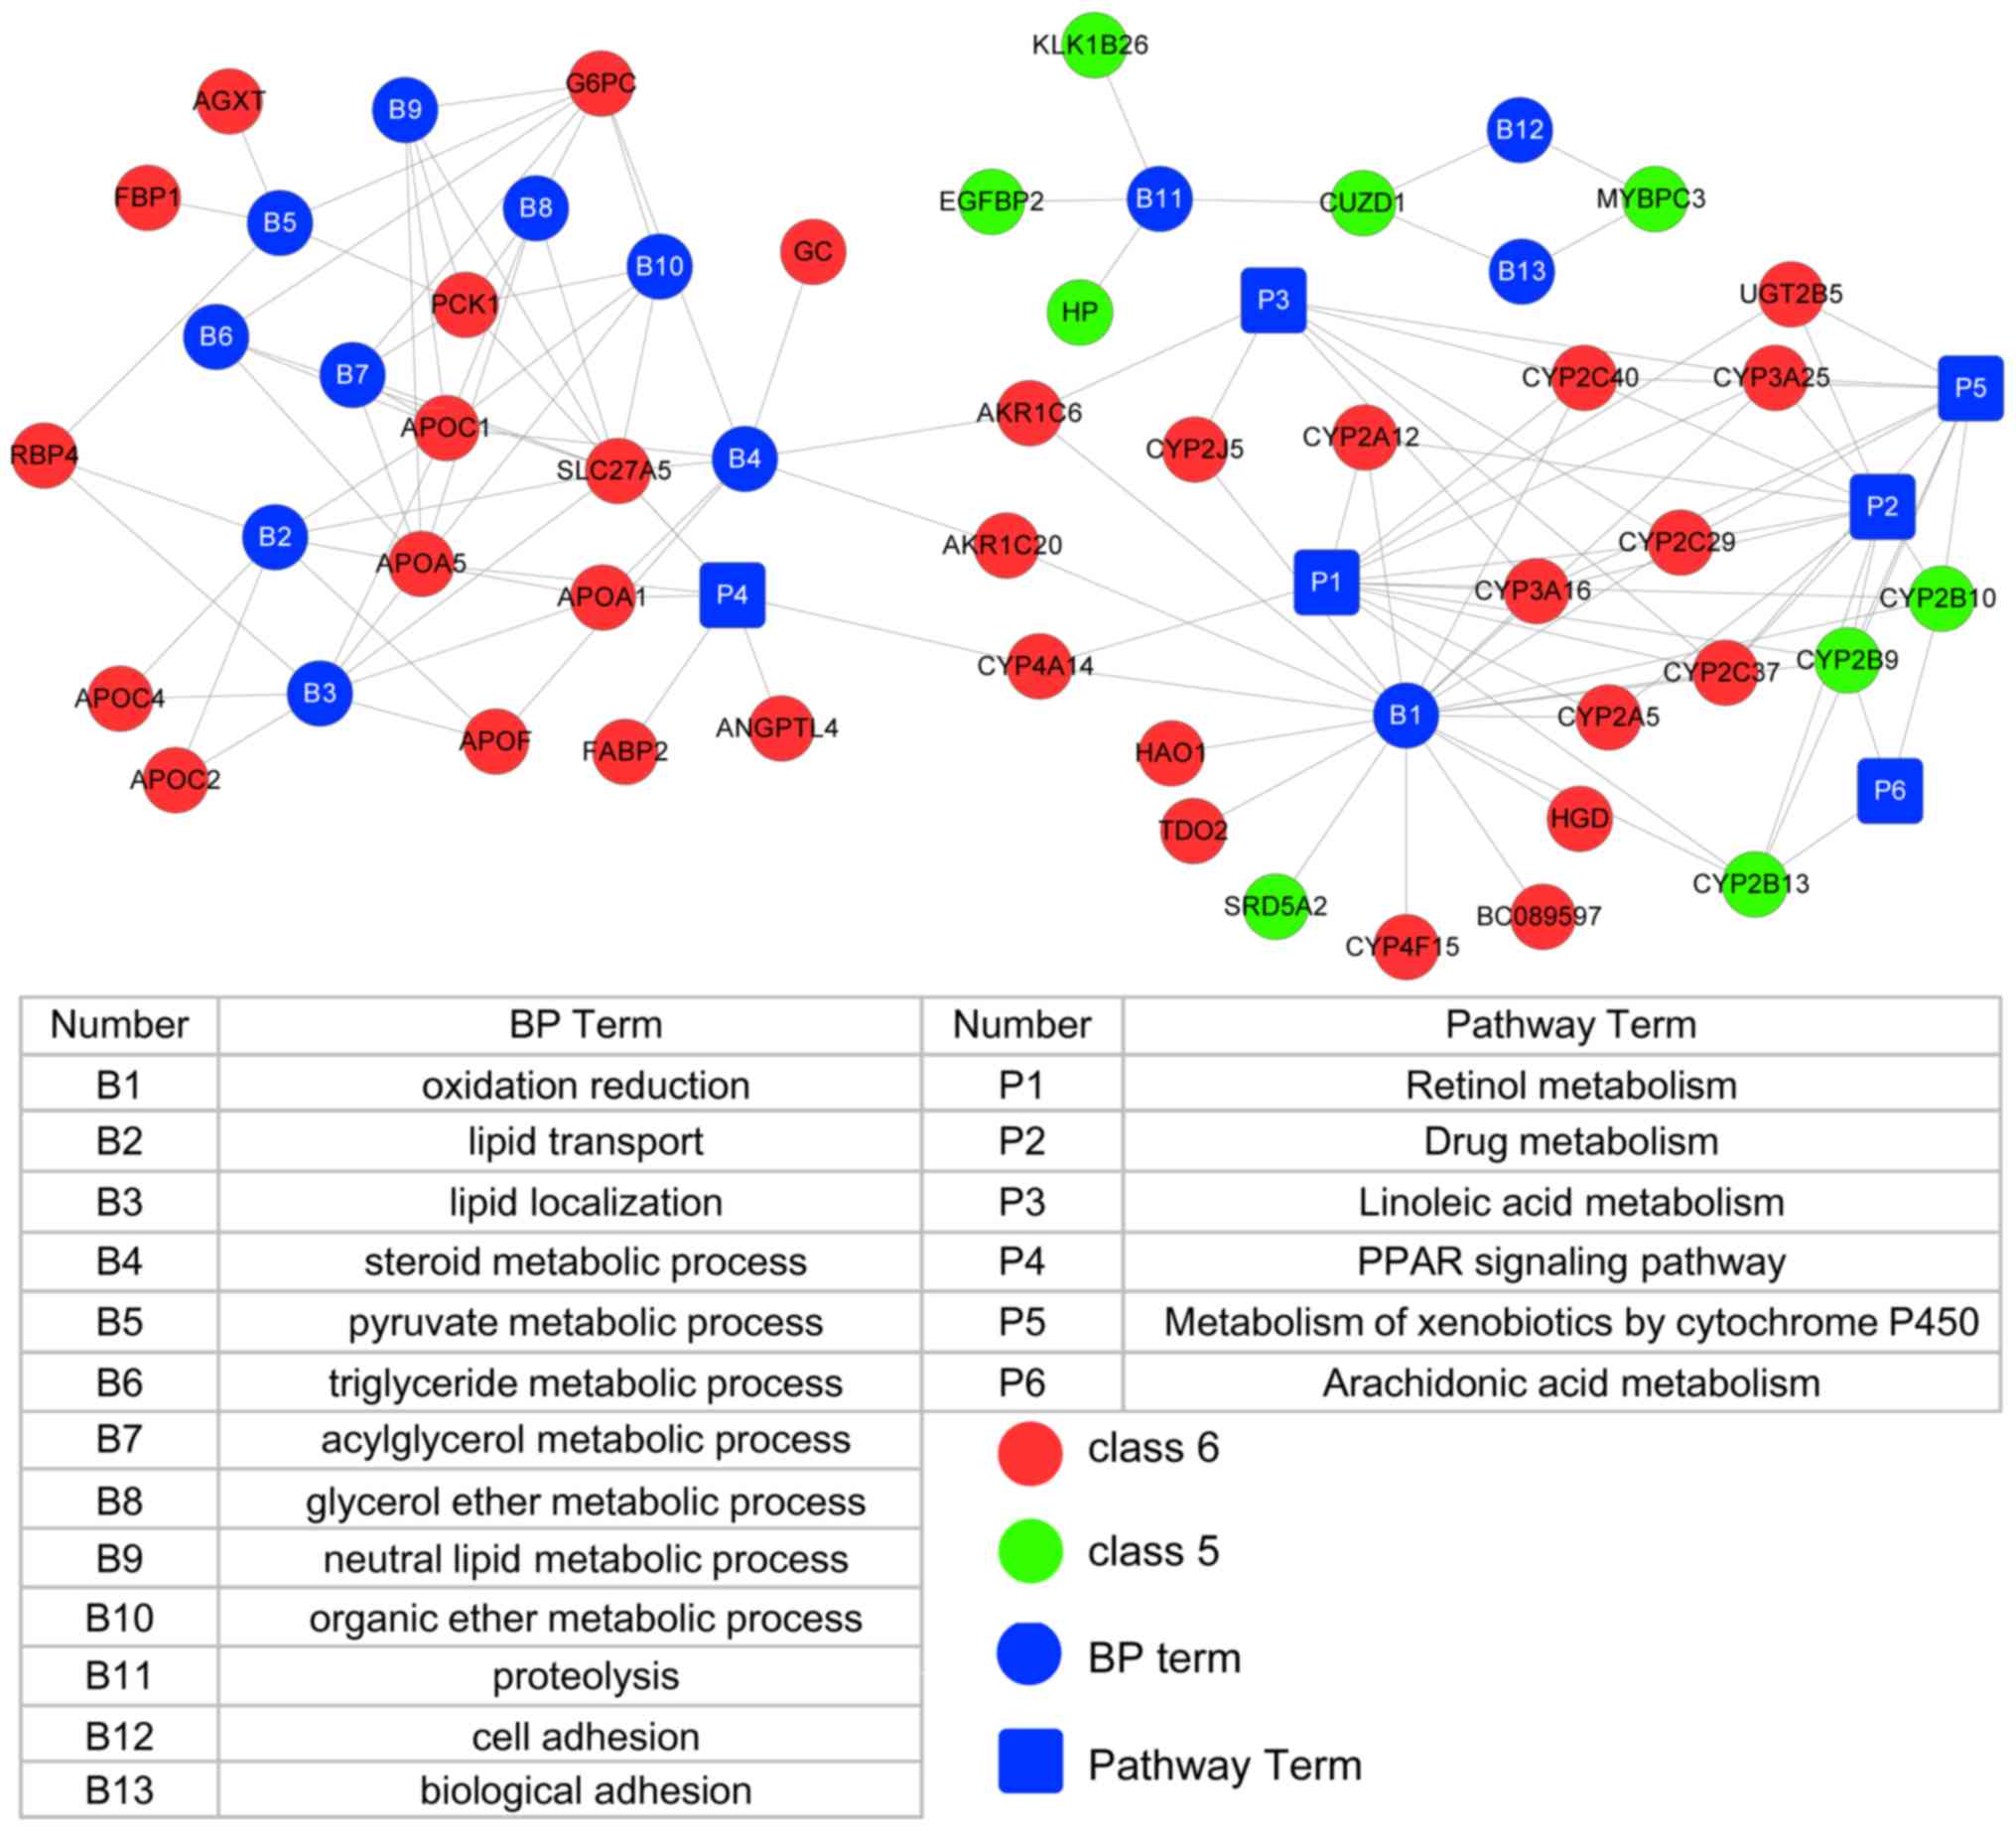
Construction of network based on GO function and
pathways of rosiglitazone function-associated genes. As presented
in Fig. 3, there were 791 DEGs in
the set of the three groups (NC vs. NH; NC vs. TH and NH vs. TH).
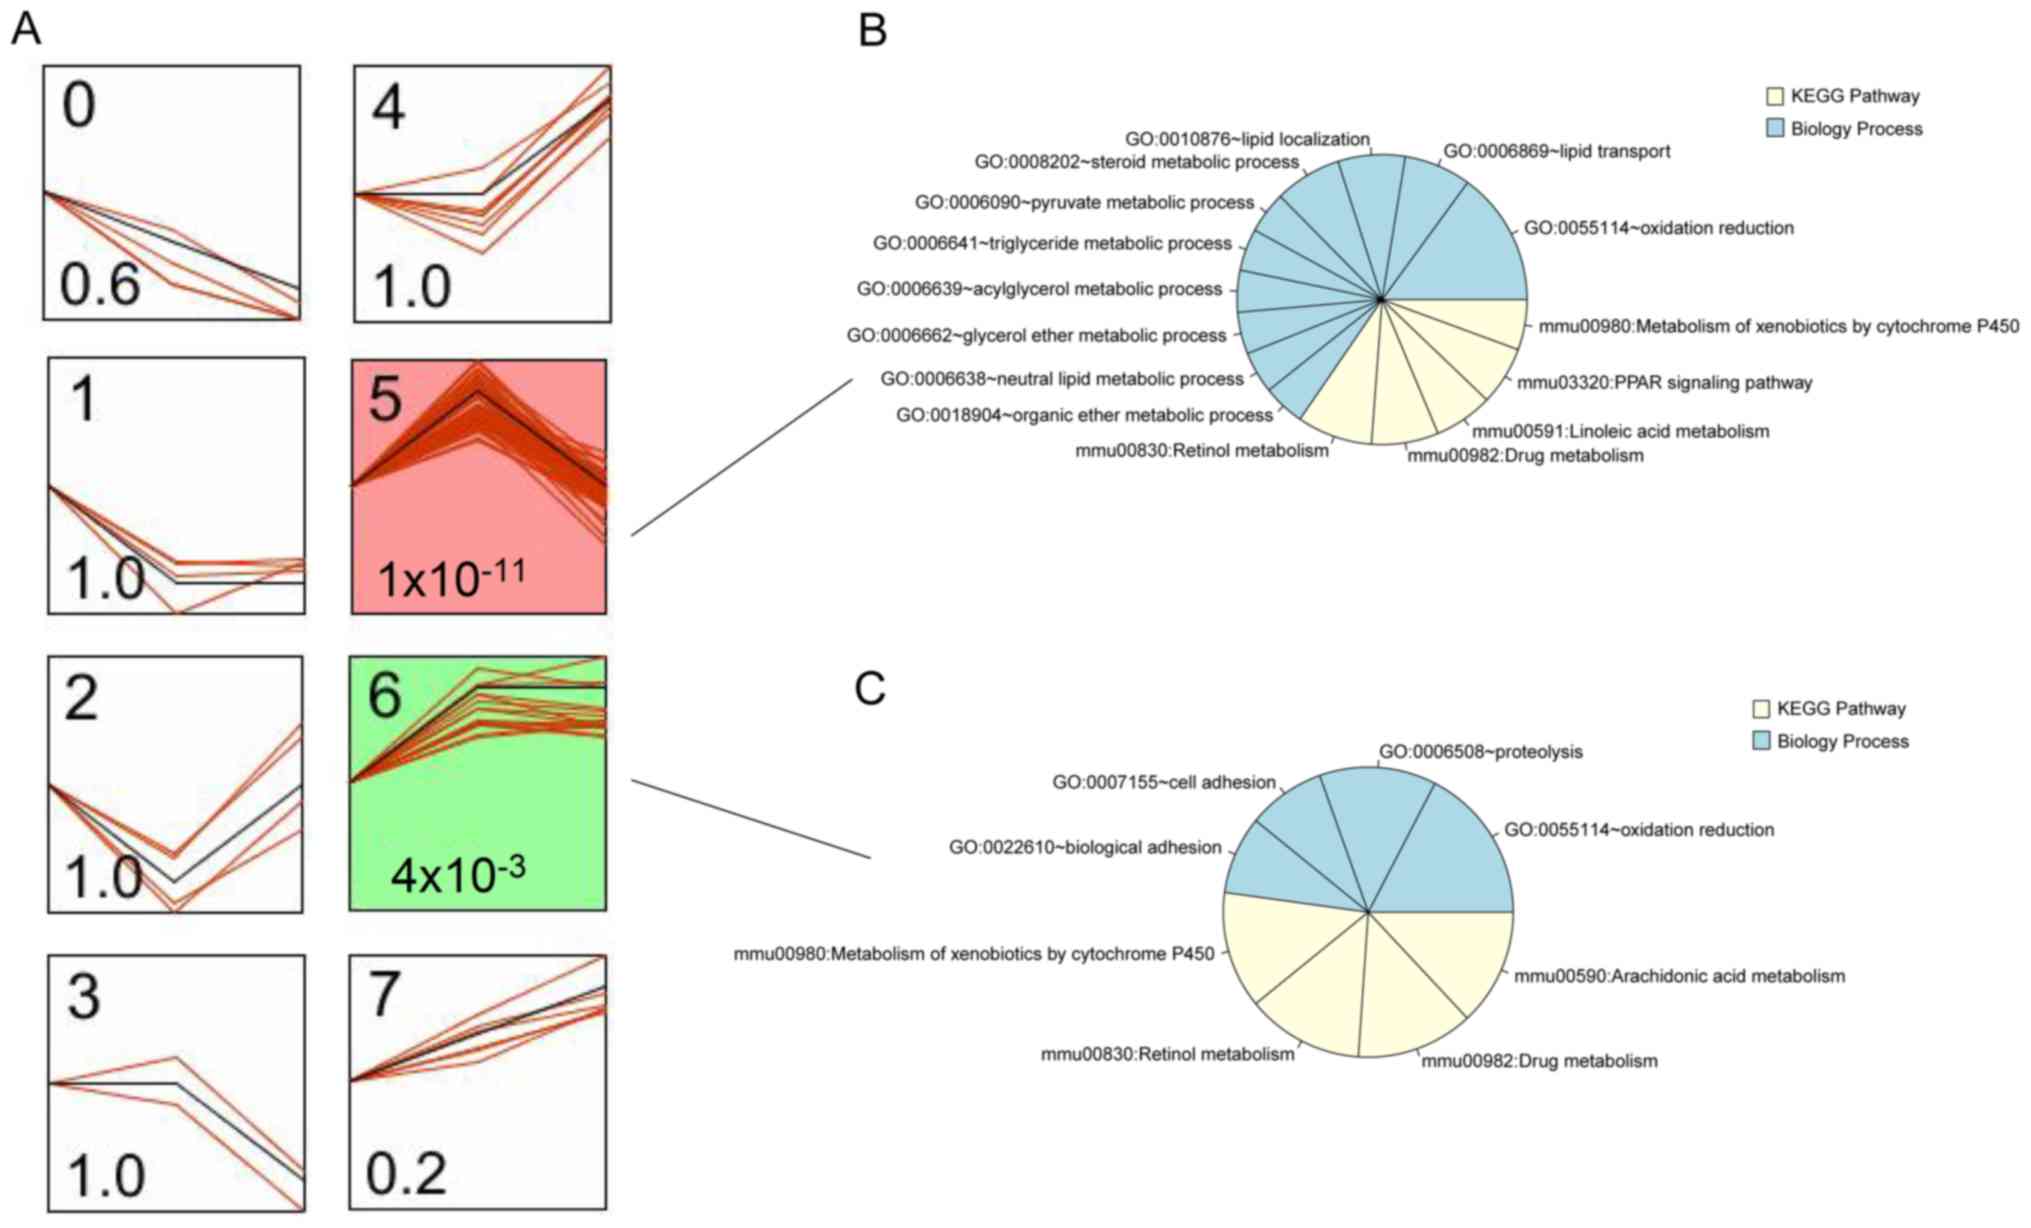
These 791 DEGs were clustered into 8 profiles, among which profiles
5 and 6 were significantly associated with the different types of
samples that were treated with or without rosiglitazone
(P=1×10⁻¹¹ or 4×10⁻³; Fig. 4A). In profile 5, DEG expression
changed from upregulation to downregulation in diabetic mouse heart
samples after treatment with rosiglitazone (Fig. 4A). The variation tendency of profile
6 was the same as that of profile 5. Thus, the DEGs in the two
profiles were defined as rosiglitazone function-associated genes,
including 57 DEGs (e.g., ApoA1, ApoA5, Cyp2c37 and Cyp2J5) in
profile 5 and 15 DEGs in profile 6 (e.g., Cyp2b9 and Cyp2b10). In
addition, the DEGs in profiles 5 and 6 were used to identify the GO
terms in the category biological process (BP) and KEGG pathways. A
total of 10 BP terms (including oxidation/reduction, lipid
transport and localization, and triglyceride metabolic process) and
5 pathways (retinol metabolism, drug metabolism, linoleic acid
metabolism, PPAR signaling pathway and metabolism of xenobiotics by
Cyp) were identified in profile 5 (Fig.
4B). In profile 6, 4 GO terms in the category BP (oxidation
reduction, proteolysis, cell adhesion and biological adhesion) and
4 pathways (metabolism of xenobiotics by Cyp, retinol metabolism,
drug metabolism and arachidonic acid metabolism) were identified
(Fig. 4C). The BP term
oxidation/reduction, the metabolism of xenobiotics by Cyp, retinol
metabolism and drug metabolism pathways were shared between the two
profiles. Subsequently, a network of these BP terms, pathways and
DEGs was constructed, which had 60 nodes (13 BP terms, 6 pathways,
32 DEGs in profile 5 and 9 DEGs in profile 6) and 130 edges
(Fig. 5). Three BP terms in the
oxidation/reduction, lipid transport, lipid localization and
retinol metabolism pathways were key factors with a high degree of
interaction in the network.
Biological abnormalities linked to
rosiglitazone function-associated genes
The rosiglitazone function-associated genes in
profile 5 were involved in 10 types of biological abnormalities,
including abnormal triglyceride levels, abnormal cholesterol
homeostasis and abnormal lipid homeostasis (Table II). In addition, DEGs in profile 6
were involved in 5 types of biological abnormalities, including
abnormal mineral homeostasis, abnormal mineral level and abnormal
pancreas physiology (Table II).
| Table II.Biological abnormalities linked with
rosiglitazone function-associated genes. |
Table II.
Biological abnormalities linked with
rosiglitazone function-associated genes.
|
Profile/phenotype | ID | Raw P-value | P-value adjusted
using the BH method (37) | Genes |
|---|
| Profile 5 |
|
Abnormal triglyceride
level | MP:0000187 |
1.34×10⁻¹¹ |
3.63×10⁻⁹ | Gcgr, Apoc1, Pck1,
Apoa1, Apoa5, Rgn, Fgf21, Bhmt, Angptl4, G6pc, Apof, Slc27a5 |
|
Homeostasis/metabolism
phenotype | MP:0005376 |
6.38×10⁻¹¹ |
8.64×10⁻⁹ | Kng1, Pck1, Apoa1,
Apoa5, Rgn, Fgf21, Fgg, Bhmt, Pzp, Cyp4a14, Hgd, Mug1, Cyp2j5,
Slc27a5, Gcgr, Apoc1, Tdo2, Fabp2, Cyp2a5, Hc, Agxt, Tmprss6,
Angptl4, Gc, G6pc, Apof, Rbp4 |
|
Abnormal homeostasis | MP:0001764 |
2.05×10⁻¹⁰ |
1.30×10⁻⁸ | Kng1, Pck1, Apoa1,
Apoa5, Rgn, Fgf21, Fgg, Bhmt, Pzp, Cyp4a14, Hgd, Mug1, Cyp2j5,
Slc27a5, Gcgr, Apoc1, Tdo2, Fabp2, Agxt, Tmprss6, Angptl4, Gc,
G6pc, Apof, Rbp4 |
|
Abnormal cholesterol
homeostasis | MP:0005278 |
2.40×10⁻¹⁰ |
1.30×10⁻⁸ | Gcgr, Apoc1, Apoa1,
Fabp2, Apoa5, Rgn, Fgf21, Bhmt, Angptl4, G6pc, Apof, Slc27a5 |
|
Abnormal cholesterol
level | MP:0003947 |
1.78×10⁻¹⁰ |
1.30×10⁻⁸ | Gcgr, Apoc1, Apoa1,
Fabp2, Apoa5, Rgn, Fgf21, Bhmt, Angptl4, G6pc, Apof, Slc27a5 |
|
Abnormal circulating
cholesterol level | MP:0000180 |
1.63×10⁻⁹ |
7.36×10⁻⁸ | Gcgr, Apoc1, Apoa1,
Fabp2, Apoa5, Fgf21, Bhmt, Angptl4, G6pc, Apof, Slc27a5 |
|
Abnormal circulating
triglyceride level | MP:0011969 |
6.48×10⁻⁹ |
2.23×10⁻⁷ | Apoc1, Pck1, Apoa1,
Apoa5, Fgf21, Angptl4, G6pc, Apof, Slc27a5 |
|
Abnormal lipid
homeostasis | MP:0002118 |
6.59×10⁻⁹ |
2.23×10⁻⁷ | Gcgr, Apoc1, Pck1,
Apoa1, Fabp2, Apoa5, Rgn, Fgf21, Bhmt, Cyp4a14, Angptl4, G6pc,
Apof, Slc27a5 |
|
Abnormal blood
homeostasis | MP:0009642 |
8.46×10⁻⁹ |
2.55×10⁻⁷ | Kng1, Pck1, Apoa1,
Apoa5, Rgn, Fgf21, Fgg, Bhmt, Pzp, Mug1, Cyp2j5, Slc27a5, Gcgr,
Tdo2, Apoc1, Fabp2, Tmprss6, Angptl4, G6pc, Apof |
|
Abnormal circulating lipid
level | MP:0003949 |
1.70×10⁻⁸ |
4.61×10⁻⁷ | Gcgr, Apoc1, Pck1,
Apoa1, Fabp2, Apoa5, Fgf21, Bhmt, Angptl4, G6pc, Apof, Slc27a5 |
| Profile 6 |
|
Abnormal ion homeostasis | MP:0001765 | 0.0076 | 0.0342 | Kcnk1, Hp |
|
Abnormal mineral
homeostasis | MP:0005636 | 0.0063 | 0.0342 | Kcnk1, Hp |
|
Abnormal pancreas
physiology | MP:0002693 | 0.0059 | 0.0342 | Cadps2, Cuzd1 |
|
Abnormal mineral level | MP:0000192 | 0.0056 | 0.0342 | Kcnk1, Hp |
|
Increased sensitivity to
induced morbidity/mortality | MP:0009763 | 0.0134 | 0.0482 | Hp, Cuzd1 |
Discussion
In the present study, A total of 791 DEGs in the set
of the NC vs. NH, NC vs. TH and TH vs. NH groups were identified.
Next, significant profiles associated with the type of samples were
identified, of which the DEGs were clustered based on their trends
using STEM analysis (profiles 5 and 6; P=1×10⁻¹¹ or
4×10⁻³, respectively), including 57 DEGs (e.g., ApoA1,
ApoA5, Cyp2c37 and Cyp2J5) in profile 5 and 15 DEGs (e.g., Cyp2b9
and Cyp2b10) in profile 6. The expression of these DEGs exhibited
the same variation tendencies among the experimental groups.
Therefore, these genes were defined as rosiglitazone
function-associated genes. In addition, the genes were enriched in
13 BP terms, including oxidation/reduction and lipid transport, and
6 KEGG pathways, including the PPAR signaling pathway and
metabolism of xenobiotics by Cyp. Furthermore, a network of these
BP terms, pathways and DEGs (32 DEGs in profile 5 and 9 DEGs in
profile 6) was constructed, which had 60 nodes and 130 edges.
Finally, the biological abnormalities linked to rosiglitazone
function-associated genes were identified, including abnormal
triglyceride levels, abnormal cholesterol homeostasis, abnormal
lipid homeostasis and abnormal mineral homeostasis.
ApoA1 and ApoA5 are members of the Apo family. ApoA1
is the major protein component in nascent high-density lipoprotein
(HDL) formation and lipid trafficking via ATP-binding cassette
transporter A1 (ABCA1) in the plasma membrane (19,20).
Llaverias et al (21)
reported that rosiglitazone markedly activated the expression of
ABCA1 and scavenger receptor class B type I (SR-BI), and reduced
free cholesterol in differentiating monocytes. Similarly, Li et
al (22) indicated that
rosiglitazone increased the expression of ABCA1 in aortic lesions
of atherosclerotic rabbits. Furthermore, ApoA1 and its mimetic
peptide mediated extracellular cholesterol microdomains deposited
depending on macrophage ABCA1 (23).
ApoA1 has been demonstrated to promote bidirectional lipid movement
via SR-BI (24). Rosiglitazone, as a
high-affinity PPARγ agonist, increased high-density lipoprotein
cholesterol levels in humanized ApoA1 transgenic mice (24). In addition, ApoA1 inhibited arterial
thrombus formation (25) and ApoA5
has a key role in regulating plasma triglyceride levels and is a
major risk factor for coronary artery disease (26,27).
Similarly, Apoa1 and Apoa5 were involved in lipid transport and
lipid localization in the present study. Of note, Apoa1 and Apoa5
were enriched in the PPAR signaling pathway. Apoa5 was also
involved in the triglyceride metabolic process. Rosiglitazone
regulates the mRNA and protein expression of adipose triglyceride
lipase in mature adipocytes in vitro and in vivo by
mediating the activity of PPARγ (28). Furthermore, dyslipidemia is a major
risk factor for cardiovascular disease (29). In the present study, the results
regarding biological abnormalities linked to rosiglitazone
function-associated genes suggested that ApoA1 and ApoA5 were
mainly involved in abnormal triglyceride levels, abnormal
cholesterol homeostasis and abnormal lipid homeostasis. Therefore,
rosiglitazone may improve cardiovascular function by targeting
ApoA1 and ApoA5 in the PPAR signaling pathway.
A study by the Nobel laureate Watson (30) revealed that insulin resistance and
T2DM may arise through insufficient supply of key reactive oxygen
species controlling the blood sugar concentration. In the present
study, various Cyp genes, including Cyp2c37, Cyp2J5, Cyp2b9 and
Cyp2b10, were identified to be enriched in the BP term
oxidation/reduction. Human Cyp enzymes have been previously
reported to be involved in the metabolism of rosiglitazone in the
treatment of T2DM in vitro (31). Similarly, rosiglitazone
function-associated genes were enriched in the metabolism of
xenobiotics via the Cyp pathway. Cyp2B, Cyp3A and Cyp4A levels in
the liver were increased in diabetic rats and mice but reduced to
normal levels after treatment with insulin (32). Cyp2c37 is the principal member of the
Cyp2c family and is associated with detoxification and
drug-metabolizing proteins in T2DM patients treated with a PPAR-α
agonist (33). The human ortholog of
mouse Cyp2j5 is Cyp2J2 (34), and
overexpression of Cyp2J2 attenuates myocardial hypertrophy induced
by diabetes (35). The
downregulation of Cyp2J2 by rosiglitazone may have counteracted the
body's attempt to compensate for cardiovascular effects by
upregulating Cyp2J2 in diabetes. Thus, Cyp2j5 may attenuate
myocardial hypertrophy and improve cardiovascular function in
patients with T2DM. Furthermore, PPAR agonists increase Cyp2b9 and
Cyp2b10 mRNA levels in lipid metabolism. Panunti and Fonseca
(36) revealed that PPAR agonists
possess anti-inflammatory and vascular properties, which may be
developed as a method of primary and secondary macrovascular
disease prevention in patients by improving various risk factors
(including dyslipidemia, hypertension and atherosclerosis)
associated with obesity and insulin resistance, and by exerting
numerous non-glycemic effects that may improve cardiovascular
outcomes. Therefore, Cyp2c37, Cyp2J5, Cyp2b9 and Cyp2b10 are
rosiglitazone function-associated genes in T2DM, which may improve
cardiovascular function via oxidation/reduction.
Of note, the present study had several limitations.
The results of the present bioinformatics analysis should be
verified through experiments. For instance, the expression levels
of these six genes (ApoA1, ApoA5, Cyp2c37, Cyp2J5, Cyp2b9 and
Cyp2b10) should be identified by PCR. In addition, the orthologs of
the genes identified in the present study should be verified in
human samples. In spite of these limitations, the present results
provide a foundation for studying the mechanism of action of
rosiglitazone, including its cardiovascular protective effects and
blood glucose control in patients with T2DM.
Rosiglitazone may improve cardiovascular function by
regulating the PPAR signaling pathway targeting ApoA1 and ApoA5.
Furthermore, Cyp2c37, Cyp2J5, Cyp2b9 and Cyp2b10 were identified as
rosiglitazone function-associated genes in T2DM via their role in
oxidation/reduction. Therefore, ApoA1, ApoA5, Cyp2c37, Cyp2J5,
Cyp2b9 and Cyp2b10 are rosiglitazone function-associated genes
affecting cardiovascular outcomes and glycemic control in T2DM.
Additional studies are required to fully elucidate the mechanisms
of action of rosiglitazone on glycemic control and its
cardiovascular protective effects in T2DM.
Acknowledgements
Not applicable.
Funding
No funding was received.
Availability of data and materials
All data generated or analysed during this study are
included in this published article.
Authors' contributions
XW contributed solely to the present study.
Ethics approval and consent to
participate
Not applicable.
Patient consent for publication
Not applicable.
Competing interests
The author declares that there are no competing
interests.
Glossary
Abbreviations
Abbreviations:
|
T2DM
|
type 2 diabetes mellitus
|
|
GEO
|
Gene Expression Omnibus
|
|
NC
|
heart samples of non-diabetic control
mice
|
|
TH
|
heart samples of rosiglitazone-treated
diabetic mice
|
|
NH
|
heart samples of untreated diabetic
mice
|
|
DEG
|
differentially expressed gene
|
|
BP
|
biological process
|
|
PPAR-γ
|
peroxisome proliferator-activated
receptor-γ
|
|
KEGG
|
Kyoto Encyclopedia of Genes and
Genomes
|
|
STEM
|
Short Time-series Expression Miner
|
|
GO
|
Gene Ontology
|
|
ABCA1
|
ATP-binding cassette transporter
A1
|
|
SR-BI
|
scavenger receptor class B type I
|
References
|
1
|
Dall TM, Yang W, Halder P, Pang B,
Massoudi M, Wintfeld N, Semilla AP, Franz J and Hogan PF: The
economic burden of elevated blood glucose levels in 2012: Diagnosed
and undiagnosed diabetes, gestational diabetes mellitus, and
prediabetes. Diabetes Care. 37:3172–3179. 2014. View Article : Google Scholar : PubMed/NCBI
|
|
2
|
American Diabetes Association: Diagnosis
and classification of diabetes mellitus. Diabetes Care. 37 Suppl
1:S81–S90. 2014. View Article : Google Scholar : PubMed/NCBI
|
|
3
|
Cooper ME, White MF, Zick Y and Zimmet P:
Type 2 diabetes mellitus. https://www.nature.com/nrendo/posters/type2diabetesmellitus/index.htmlOctober.
2012
|
|
4
|
Cockram C: The epidemiology of diabetes
mellitus in the Asia-Pacific region. Hong Kong Med J. 6:43–52.
2000.PubMed/NCBI
|
|
5
|
Bazargan M, Foster DJR, Davey AK and
Muhlhausler BS: Rosiglitazone metabolism in human liver microsomes
using a substrate depletion method. Drugs R D. 17:189–198. 2017.
View Article : Google Scholar : PubMed/NCBI
|
|
6
|
Abou Daya K, Abu Daya H, Nasser Eddine M,
Nahhas G and Nuwayri-Salti N: Effects of rosiglitazone (PPAR γ
agonist) on the myocardium in non-hypertensive diabetic rats (PPAR
γ). J Diabetes. 7:85–94. 2015. View Article : Google Scholar : PubMed/NCBI
|
|
7
|
Mayerson AB, Hundal RS, Dufour S, Lebon V,
Befroy D, Cline GW, Enocksson S, Inzucchi SE, Shulman GI and
Petersen KF: The effects of rosiglitazone on insulin sensitivity,
lipolysis, and hepatic and skeletal muscle triglyceride content in
patients with type 2 diabetes. Diabetes. 51:797–802. 2002.
View Article : Google Scholar : PubMed/NCBI
|
|
8
|
Sundaresan A, Radhiga T and Pugalendi KV:
Effect of ursolic acid and Rosiglitazone combination on hepatic
lipid accumulation in high fat diet-fed C57BL/6J mice. Eur J
Pharmacol. 741:297–303. 2014. View Article : Google Scholar : PubMed/NCBI
|
|
9
|
Bajpeyi S, Pasarica M, Conley KE, Newcomer
BR, Jubrias SA, Gamboa C, Murray K, Sereda O, Sparks LM and Smith
SR: Pioglitazone-induced improvements in insulin sensitivity occur
without concomitant changes in muscle mitochondrial function.
Metabolism. 69:24–32. 2017. View Article : Google Scholar : PubMed/NCBI
|
|
10
|
Pedram A, Razandi M, Blumberg B and Levin
ER: Membrane and nuclear estrogen receptor α collaborate to
suppress adipogenesis but not triglyceride content. FASEB J.
30:230–240. 2016. View Article : Google Scholar : PubMed/NCBI
|
|
11
|
Nissen SE and Wolski K: Effect of
rosiglitazone on the risk of myocardial infarction and death from
cardiovascular causes. N Engl J Med. 356:2457–2471. 2007.
View Article : Google Scholar : PubMed/NCBI
|
|
12
|
Singh S, Loke YK and Furberg CD: Long-term
risk of cardiovascular events with rosiglitazone: A meta-analysis.
JAMA. 298:1189–1195. 2007. View Article : Google Scholar : PubMed/NCBI
|
|
13
|
Home PD, Pocock SJ, Beck-Nielsen H, Curtis
PS, Gomis R, Hanefeld M, Jones NP, Komajda M and McMurray JJ;
RECORD Study Team, : Rosiglitazone evaluated for cardiovascular
outcomes in oral agent combination therapy for type 2 diabetes
(RECORD): A multicentre, randomised, open-label trial. Lancet.
373:2125–2135. 2009. View Article : Google Scholar : PubMed/NCBI
|
|
14
|
Wilson KD, Li Z, Wagner R, Yue P, Tsao P,
Nestorova G, Huang M, Hirschberg DL, Yock PG, Quertermous T and Wu
JC: Transcriptome alteration in the diabetic heart by
rosiglitazone: Implications for cardiovascular mortality. PLoS One.
3:e26092008. View Article : Google Scholar : PubMed/NCBI
|
|
15
|
Rao Y, Lee Y, Jarjoura D, Ruppert AS, Liu
CG, Hsu JC and Hagan JP: A comparison of normalization techniques
for microRNA microarray data. Stat Appl Genet Mol Biol.
7:Article22. 2008. View Article : Google Scholar : PubMed/NCBI
|
|
16
|
Gentleman R, Carey V, Huber W, Irizarry R
and Dudoit S: Bioinformatics and computational biology solutions
using R and Bioconductor. Springer Science & Business Media.
2006.
|
|
17
|
Szekely GJ and Rizzo ML: Hierarchical
clustering via joint between-within distances: Extending Ward's
minimum variance method. J Classification. 22:151–183. 2005.
View Article : Google Scholar
|
|
18
|
Ernst J and Bar-Joseph Z: STEM: A tool for
the analysis of short time series gene expression data. BMC
Bioinformatics. 7:1912006. View Article : Google Scholar : PubMed/NCBI
|
|
19
|
Wang Z, Shang P, Li Q, Wang L, Chamba Y,
Zhang B, Zhang H and Wu C: iTRAQ-based proteomic analysis reveals
key proteins affecting muscle growth and lipid deposition in pigs.
Sci Rep. 7:467172017. View Article : Google Scholar : PubMed/NCBI
|
|
20
|
Duong PT, Collins HL, Nickel M, Lund-Katz
S, Rothblat GH and Phillips MC: Characterization of nascent HDL
particles and microparticles formed by ABCA1-mediated efflux of
cellular lipids to apoA-I. J Lipid Res. 47:832–843. 2006.
View Article : Google Scholar : PubMed/NCBI
|
|
21
|
Llaverias G, Rebollo A, Pou J,
Vázquez-Carrera M, Sánchez RM, Laguna JC and Alegret M: Effects of
rosiglitazone and atorvastatin on the expression of genes that
control cholesterol homeostasis in differentiating monocytes.
Biochem Pharmacol. 71:605–614. 2006. View Article : Google Scholar : PubMed/NCBI
|
|
22
|
Li C, Tu Y, Liu TR, Guo ZG, Xie D, Zhong
JK, Fan YZ and Lai WY: Rosiglitazone attenuates atherosclerosis and
increases high-density lipoprotein function in atherosclerotic
rabbits. Int J Mol Med. 35:715–723. 2015. View Article : Google Scholar : PubMed/NCBI
|
|
23
|
Jin X, Sviridov D, Liu Y, Vaisman B,
Addadi L, Remaley AT and Kruth HS: ABCA1 (ATP-binding cassette
transporter A1) mediates ApoA-I (Apolipoprotein A-I) and ApoA-I
mimetic peptide mobilization of extracellular cholesterol
microdomains deposited by macrophages. Arterioscler Thromb Vasc
Biol. 36:2283–2291. 2016. View Article : Google Scholar : PubMed/NCBI
|
|
24
|
Liu X, Ren K, Suo R, Xiong SL, Zhang QH,
Mo ZC, Tang ZL, Jiang Y, Peng XS and Yi GH: ApoA-I induces S1P
release from endothelial cells through ABCA1 and SR-BI in a
positive feedback manner. J Physiol Biochem. 72:657–667. 2016.
View Article : Google Scholar : PubMed/NCBI
|
|
25
|
Li D, Weng S, Yang B, Zander DS, Saldeen
T, Nichols WW, Khan S and Mehta JL: Inhibition of arterial thrombus
formation by ApoA1 Milano. Arterioscler Thromb Vasc Biol.
19:378–383. 1999. View Article : Google Scholar : PubMed/NCBI
|
|
26
|
Wang Y, Lu Z, Zhang J, Yang Y, Shen J,
Zhang X and Song Y: The APOA5 rs662799 polymorphism is associated
with dyslipidemia and the severity of coronary heart disease in
Chinese women. Lipids Health Dis. 15:1702016. View Article : Google Scholar : PubMed/NCBI
|
|
27
|
Oliva I, Guardiola M, Vallvé JC, Ibarretxe
D, Plana N, Masana L, Monk D and Ribalta J: APOA5 genetic and
epigenetic variability jointly regulate circulating triacylglycerol
levels. Clin Sci (Lond). 130:2053–2059. 2016. View Article : Google Scholar : PubMed/NCBI
|
|
28
|
Kershaw EE, Schupp M, Guan HP, Gardner NP,
Lazar MA and Flier JS: PPARgamma regulates adipose triglyceride
lipase in adipocytes in vitro and in vivo. Am J Physiol Endocrinol
Metab. 293:E1736–E1745. 2007. View Article : Google Scholar : PubMed/NCBI
|
|
29
|
Musunuru K: Atherogenic dyslipidemia:
Cardiovascular risk and dietary intervention. Lipids. 45:907–914.
2010. View Article : Google Scholar : PubMed/NCBI
|
|
30
|
Watson JD: Type 2 diabetes as a redox
disease. Lancet. 383:841–843. 2014. View Article : Google Scholar : PubMed/NCBI
|
|
31
|
Baldwin SJ, Clarke SE and Chenery RJ:
Characterization of the cytochrome P450 enzymes involved in the in
vitro metabolism of rosiglitazone. Br J Clin Pharmacol. 48:424–432.
1999. View Article : Google Scholar : PubMed/NCBI
|
|
32
|
Konno Y, Negishi M and Kodama S: The roles
of nuclear receptors CAR and PXR in hepatic energy metabolism. Drug
Metab Pharmacokinet. 23:8–13. 2008. View Article : Google Scholar : PubMed/NCBI
|
|
33
|
Kelder T, Verschuren L, van Ommen B, van
Gool AJ and Radonjic M: Network signatures link hepatic effects of
anti-diabetic interventions with systemic disease parameters. BMC
Syst Biol. 8:1082014. View Article : Google Scholar : PubMed/NCBI
|
|
34
|
Nelson DR, Zeldin DC, Hoffman SM, Maltais
LJ, Wain HM and Nebert DW: Comparison of cytochrome P450 (CYP)
genes from the mouse and human genomes, including nomenclature
recommendations for genes, pseudogenes and alternative-splice
variants. Pharmacogenetics. 14:1–18. 2004. View Article : Google Scholar : PubMed/NCBI
|
|
35
|
Ma B, Xiong X, Chen C, Li H, Xu X, Li X,
Li R, Chen G, Dackor RT, Zeldin DC and Wang DW: Cardiac-specific
overexpression of CYP2J2 attenuates diabetic cardiomyopathy in male
streptozotocin-induced diabetic mice. Endocrinology. 154:2843–2856.
2013. View Article : Google Scholar : PubMed/NCBI
|
|
36
|
Panunti B and Fonseca V: Effects of PPAR
gamma agonists on cardiovascular function in obese, non-diabetic
patients. Vascul Pharmacol. 45:29–35. 2006. View Article : Google Scholar : PubMed/NCBI
|
|
37
|
Castro MCD and Singer BH: Controlling the
false discovery rate: A new application to account for multiple and
dependent tests in local statistics of spatial association.
Geographical Anal. 38:180–208. 2006. View Article : Google Scholar
|