Introduction
The number of patients suffering from chronic kidney
disease is rapidly growing worldwide, with increasing incidence,
prevalence and progressiveness resulting in end-stage renal disease
(ESRD) (1). Kidney transplantation
is the most effective treatment for ESRD (2). In 1954, a team headed by Murray ushered
in the modern era of organ transplantation with the first
successful human organ transplantation between two identical twins
(3). Scholars then began to explore
kidney transplantation and experiments revealed that successful
kidney transplantation may significantly improve the quality of
life for patients with ESRD. Advances in immunosuppression over the
last three decades have led to vast improvements in the control of
acute rejection and short-term graft survival in kidney transplant
patients (4). However, no
significant improvements in long-term outcomes have been achieved,
and concerns over the morbidity of lifelong regimens of
immunosuppressive drugs remain. Analysis using the Kaplan-Meier
method indicated a cumulative probability of graft survival at 1,
3, 5, 7 and 10 years of 99.1, 97.7, 94.3, 85.7 and 62.1%,
respectively (5). Acute rejection is
the major cause of kidney transplant loss and an independent risk
factor affecting kidney function and long-term survival, which are
dependent on immune rejection and the side effects of
immunosuppressive regimens (6).
Following kidney transplantation, immunosuppressants are used to
prevent graft rejection, which greatly enhances the probability of
survival of the transplant (7).
However, since the rejection process is difficult to reverse once
the typical clinical symptoms occur, the prevention and reduction
of early acute rejection is conducive to transplant recipients.
The rejection of kidney transplants is essentially
an immune response. Cellular immunity is the core factor for
transplant immunization. The immune cells of the recipient attack
the transplanted kidney directly or indirectly by releasing a large
amount of various cytokines. Concerning the particular cell types
involved, several studies have discussed the role of T-cell
receptors (TCRs) in transplant rejection. Velásquez et al
(8) suggested that differential
expression of particular TCR β chain variable families and high
levels of circulating CD4(+) CD25 (high) T cells in long-term
surviving renal transplant patients contribute to an active and
specific state of immunologic suppression. Matsutani et al
(9) indicated that the skew in TCR
usage was correlated with the levels of clonal T-cell expansion,
indicating that the expanding T cells were responsible for the skew
in TCR usage. These results demonstrate that clonal T-cell
expansion in the periphery has a negative impact on long-term graft
function. In addition, a previous study by our group on TCR after
kidney transplantation indicated that the TCR repertoire diversity
of transplantation groups was relatively lower compared with that
in the NC group (10). The diversity
of TCRs, B-cell receptors (BCRs) and secreted antibodies makes up
the core of the complex immune system, and they serve as pivotal
defensive components to protect the body against invading
pathogens, including viruses and bacteria (11). However, the changes in B cells and
BCRs in patients with acute rejection after kidney transplantation
at the molecular level remain to be determined and their role in
the underlying pathological process requires to be investigated.
BCR antigens (Ags) are formed through the rearrangement of the
immunoglobulin (Ig) heavy chain (IGH) variable (IGHV), IGH
diversity (IGHD) and IGH joining (IGHJ) gene segments of the
complementarity-determining region 3 (H-CDR3) of the BCR. CDR3 is
the most hyper-variable region in the BCR and the most important
structure in Ag recognition, as it determines the fate of
developing and responding lymphocytes (12), which provides the most important
structural basis for Ag binding. CDR3 is the product of multiple
VDJ gene rearrangements and multiple non-coding N nucleotide
insertions.
In the present study, the IGH of the CDR3 region of
BCR was assessed in peripheral blood mononuclear cells (PBMCs) of 3
cases of typical acute rejection after kidney transplantation by
using high-throughput sequencing. Comparative CDR3 diversity and
length distribution analyses were performed and the IGHD, IGHJ and
IGHV gene family expression as well as the IGHV-IGHJ family
distribution were assessed. In addition, the Shannon entropy (SE),
highly expanded clone (HEC) distributions, Simpson's diversity (SD)
index and the Gini coefficient for the diversity and molecular
expression of the IGH of the CDR3 region of BCR were calculated and
analyzed. The present study enhances the current understanding of
the balance between immunodeficiency and immune oversuppression in
kidney transplant recipients. It provides knowledge to guide the
individualized and rational use of immunosuppressive agents for
preventing acute rejection or infection in renal transplant
recipients.
Patients and methods
Patients and controls
With the widespread use of various novel
immunosuppressive agents, the incidence of acute rejection has
decreased in recent years, therefore, 3 cases encountered over 1.5
years were included in the current study (13). The study assessed 3 patients with
typical acute rejection after kidney transplantation. Following
obtainment of informed consent and in accordance with a protocol
approved by the Ethics Committee of Guangxi Key Laboratory of
Metabolic Disease Research (Guilin, China), a total of 3.5 ml
peripheral blood was drawn from 3 typical patients [post-operative
renal function and normal recovery within two weeks of acute
rejection; pathological examination results and diagnostic criteria
in line with the Baff classification of acute rejection (14)] at Guilin No. 924 Hospital (Guilin,
China) between October 2014 and June 2016. Samples were collected 1
day prior to kidney transplantation (Pre1), 1 day after kidney
transplantation (Post1) and 7 days after kidney transplantation
(Post7). These samples were collected from one female patient aged
51 years (Case 1; weight, 54 kg), one female patient aged 47 years
(Case 2; weight, 51 kg) and one male patient aged 61 years (Case 3;
weight, 63 kg). The clinicopathological characteristics of the
patients are listed in Table I. The
treatment of each of the patients prior to and after
transplantation/rejection is summarized in Table II.
 | Table I.Clinicopathological characteristics of
the patients. |
Table I.
Clinicopathological characteristics of
the patients.
| Case no. | Sex | Age (years) | Time-point | Temperature (°C) | Urinary volume
(ml) | Urine protein
(g/l) | Creatinine
(µmol/l) | Lymphocytes
(109/l) | Tacrolimus
(ng/ml) |
|---|
| 1 |
|
| Pre1 | 36.4 | 6,710 | 1+ | 223 | 0.05 | / |
|
| Female | 51 | Post1 | 37.2 | 4,300 | 1+ | 112 | 0.09 | / |
|
|
|
| Post7 | 36.8 | 3,700 | 1+ | 108 | 0.07 | 4.3 |
| 2 |
|
| Pre1 | 36.0 | 2,050 | / | 454 | 1.59 | / |
|
| Female | 47 | Post1 | 36.0 | 6,560 | 1+ | 549 | 0.14 | / |
|
|
|
| Post7 | 36.5 | 2,500 | +/− | 156 | 0.14 | 9.0 |
| 3 |
|
| Pre1 | 36.5 | 4,260 | 1+ | 1,925 | 1.16 | / |
|
| Male | 61 | Post1 | 36.0 | 5,820 | +/− | 530 | 0.23 | / |
|
|
|
| Post7 | 36.3 | 3,980 | +/− | 81 | / | 6.3 |
| Table II.Response to therapy in the
patients. |
Table II.
Response to therapy in the
patients.
| Case no. | Pre-operative
management of renal dysfunction | Post-operative and
prior to acute rejection medication intravenous drip | Oral medication
(post-operative and prior to acute rejection) | Following acute
rejection medication administration via intravenous drip |
|---|
| 1 | Hemodialysis | Anti-human T
Lymphocyte Porcine Immunoglobulin | Tacrolimus (3.5 mg,
2 times/day) | Methylprednisolone
(500 mg/day, 2 days) |
|
|
| (Surgery and
post1-2, 500 mg/day; post3-7, 250 mg/day) | Mycophenolate
sodium enteric-coated | Anti-human T
Lymphocyte Porcine |
|
|
| Methylprednisolone
(Surgery and post1-2, 500 mg/day) | tablets (360 mg, 2
times/day) | Immunoglobulin (500
mg/day, 5 days) |
|
|
| Mycophenolate
mofetil (Post1-2, 1,000 mg, 2 times/day) | Methylprednisolone
(8 mg/day) |
|
| 2 | Hemodialysis | Anti-human T
Lymphocyte Rabbit Immunoglobulin | Tacrolimus (3.0 mg
morning, 3.5 mg night) | Anti-human T
Lymphocyte Rabbit |
|
|
| (Surgery and
post1-2, 500 mg/day; post3-7, 250 mg/day) | Mycophenolate
mofetil (750 mg, 2 times/day) | Immunoglobulin (500
mg/day, 4 days) |
|
|
| Methylprednisolone
(Surgery and post1-2, 500 mg/day) | Methylprednisolone
(16 mg/day) |
|
|
|
| Mycophenolate
mofetil (Post1-2, 1,000 mg/day) |
|
|
| 3 | Hemodialysis | Anti-human T
Lymphocyte Porcine Immunoglobulin | Tacrolimus (3.0 mg,
2 times/day) | Methylprednisolone
(500 mg/day, 3 days) |
|
|
| (Surgery and
post1-2, 500 mg/day; post3-7, 250 mg/day) | Mycophenolate
mofetil (750 mg, 2 times/day) |
|
|
|
| Methylprednisolone
(Surgery and post1-2, 500 mg/day) | Methylprednisolone
(16 mg/day) |
|
|
|
| Mycophenolate
mofetil (Post1-2, 1,000 mg, 2 times/day) |
|
|
B-cell isolation and DNA
extraction
Ficoll lymphocyte separation medium (cat. no.
MD-YSZ707; Mei De Biotechnology Co., Ltd., Tianjin, China) and
density gradient centrifugation were used to separate peripheral
mononuclear cells from the blood obtained at different time points
(Pre1, Post1 and Post7). The PBMCs of each patient were separated
from the blood obtained at the different time-points. A QIAamp DNA
Mini kit (cat. no. 51304; Qiagen, Hilden, Germany) was used to
extract genomic DNA from 9 peripheral blood samples of the 3
patients, which was stored at −20°C.
Multiplex polymerase chain reaction
(PCR) amplification of the BCR H-CDR3 region
DNA samples (500 ng; minimum concentration of no
less than 35 ng/µl) were obtained from each patient. Specifically
designed V-region primers and J-region primers were used. Multiplex
PCR was performed with the Qiagen multiplex PCR kit (cat. no.
Y5-206145; Qiagen). The 12 forward primers and 4 reverse primers
utilized were used for multiplex PCR to amplify the rearranged
H-CDR3 region (Table III). High
fidelity enzyme was used for multiplex PCR (Qiagen Multiplex PCR
kit; Qiagen). For each sample, the same amount of DNA was used for
multiplex PCR. The PCR conditions were set as 95°C for 15 min,
followed by 25 cycles of 94°C for 15 sec and 60°C for 3 min, with a
final extension at 72°C for 10 min. PCR was performed using the
ProFlex™ PCR machine (Applied Biosystems; Thermo Fisher Scientific,
Inc., Waltham, MA, USA) and the PCR products were purified by
AMPure XP beads (Beckman Coulter, Brea, CA, USA) to remove primer
sequences. A second round of PCR was performed to add a sequencing
index to each sample. The PCR conditions were set as 98°C for 1
min, followed by 25 cycles of 98°C for 20 sec, 65°C for 30 sec and
72°C for 30 sec, with a final extension at 72°C for 5 min. The
library was separated on agarose gel and the target region was
isolated and cleaned using QIAquick Gel Extraction kits (cat. no.
Y5-28704; Qiagen). A total of 5 µl DNA sample was mixed with the
appropriate amount of bromophenol blue indicator spotting buffer
for electrophoresis. Subsequently, 3 µl DNA marker and 0.7% agarose
gel were added. Electrophoresis was performed for 40 min at 150
volts (large electrophoresis tank); electrophoresis to bromophenol
blue migrated for a suitable distance in the gel. The gel was
removed and the ethidium bromide color was checked, followed by
capturing of images under ultraviolet light.
| Table III.Multiplex-PCR amplification primers
of the IGH complementarity-determining region 3 region. |
Table III.
Multiplex-PCR amplification primers
of the IGH complementarity-determining region 3 region.
| Primer name | Sequence
(5′-3′) |
|---|
| IGHV1-18 |
CAGACGTGTGCTCTTCCGATCTAGAGAGTCACCATGACCACAGAC |
| IGHV1-2/1-46 |
CAGACGTGTGCTCTTCCGATCTAGAGAGTCACCAKKACCAGGGAC |
| IGHV1-24 |
CAGACGTGTGCTCTTCCGATCTAGAGAGTCACCATGACCGAGGAC |
| IGHV1-3/1–45 |
CAGACGTGTGCTCTTCCGATCTAGAGAGTCACCATTACYAGGGAC |
| IGHV1-69/1-f |
CAGACGTGTGCTCTTCCGATCTAGAGAGTCACGATWACCRCGGAC |
| IGHV1-8 |
CAGACGTGTGCTCTTCCGATCTAGAGAGTCACCATGACCAGGAAC |
| IGH2-70/26/5 |
CAGACGTGTGCTCTTCCGATCTAGACCAGGCTCACCATYWCCAAGG |
| IGHV3 |
CAGACGTGTGCTCTTCCGATCTAGGGCCGATTCACCATCTCMAG |
| IGH4 |
CAGACGTGTGCTCTTCCGATCTAGCGAGTCACCATRTCMGTAGAC |
| IGHV5-51 |
CAGACGTGTGCTCTTCCGATCTAGCAGCCGACAAGTCCATCAGC |
| IGHV6-1 |
CAGACGTGTGCTCTTCCGATCTAGAGTCGAATAACCATCAACCCAG |
| IGHV7-NEW |
CAGACGTGTGCTCTTCCGATCTAGGACGGTTTGTCTTCTCCTTG |
| IGHJ-Rev1 |
CTACACGACGCTCTTCCGATCTCTGAGGAGACRGTGACCAGGGTG |
| IGHJ-Rev2 |
CTACACGACGCTCTTCCGATCTCTGAAGAGACGGTGACCATTGTC |
| IGHJ-Rev3 |
CTACACGACGCTCTTCCGATCTCTGAGGAGACGGTGACCAGGGT |
| IGHJ-Rev4 |
CTACACGACGCTCTTCCGATCTTGAGGAGACGGTGACCGTGGTC |
Electrophoresis was performed to recover 100–190 bp
multiplex PCR products using a QIAquick Gel Extraction kit
(Qiagen). End Repair Mix (Sangon Biotech Co., Ltd., Shanghai,
China) was added and the terminal repair reaction was performed at
20°C, in accordance with the manufacturer's protocol, followed by
purification (cat. no. Y5-28106; QIAquick PCR Purification kit;
Qiagen). The DNA fragment obtained after the terminal repair was
attached to the ‘A’ base at its 3′ end. The adapter was ligated
with Adapter oligo mix and DNA ligase. The linker-modified DNA
fragment was enriched by PCR and subsequently, the PCR products
were subjected to agarose gel electrophoresis. After the target
fragment was excised from the gel, the QIAquick Gel Extraction kit
(Qiagen) was used for gel purification and the fragment containing
the PCR product dissolved in Elution Buffer (provided by the Gel
Extraction kit). The library was then constructed.
High-throughput sequencing
High-throughput sequencing approaches to study BCR
repertoires may be used to measure the diversity of B-cell
populations (15). For
high-throughput sequencing, each sample must be prepared in the
same manner, containing 2 µg total DNA. Multiplex PCR with a
mixture of primers targeted the rearranged V and J segments to
represent receptor diversity (16).
Multiplex PCR amplification was performed to amplify rearranged
CDR3 sequences. An upstream primer and downstream primer in the
IGHV functional gene region and IGHJ functional gene region were
designed. Each primer was specific for a particular site of the
H-CDR3 of BCR. Using the Illumina HiSeq 2000 sequencing platform
(Illumina, Inc., San Diego, CA, USA) to perform the sequencing of
PCR products, NaOH was added and samples were diluted to a certain
concentration according to the expected amount of data obtained
with the machine. The library was added to FlowCell (part of the
Illumina Hiseq 2000 platform) after denaturation and dilution.
PCR-bridged amplification was performed using the reagent TruSeq PE
Cluster kit v3-cBot-HS (cat. no. PE-401-3001; Illumina, Inc.) on
the cluster generation platform cBot. Finally, the prepared Flow
Cell was sequenced with the HiSeq 2000 sequencing system and the
reagent TruSeq SBS KIT-HS v3 (FC-401-3001; both Illumina,
Inc.).
Bioinformatics analysis
Raw sequences in the FASTQ format were processed
using the Basic Local Alignment Search Tool (BLAST) online software
(http://blast.ncbi.nlm.nih.gov/Blast.cgi). PCR products
were sequenced using an Illumina Genome Analyzer and the sequences
were scored and filtered with the subsequent formula. Firstly the
sequences with connectors were filtered out and the reads with an
average quality score <15 (Illumina 0–40 quality system) were
removed. For unknown bases (N bases), the quantity was ≤5%.
Regarding the sequences at the tail with low quality, those with a
score <10 were removed to ensure the average quality score of
sequences was >15 and the length of remaining sequences were
>60 nt following filtration. With the above filtration steps,
clean data was generated. Two Pair-end (PE) sequences from clean
data were merged into a contig sequence in two steps: i) By
aligning the tail parts of two sequences and assessing the identity
[COPEv1.1.3 software; Bureau Gravimetrique International (BGI),
Toulouse, France] with at least 10 bases of overlap required and
the overlapping section having 90% base match; ii) as different
primers may result in sequences of different lengths, the short
certain products (<100 bp) were merged by aligning the head part
of the sequence (FqMerger software; BGI). Using this method, the
merged contig sequences and the length of the distribution plot
were obtained.
Statistical analysis
The statistical analyses were performed with
GraphPad Prism software (GraphPad Software, Inc., La Jolla, CA,
USA), and the Student's t-test was used with Bonferroni correction.
P<0.05 was considered to indicate a statistically significant
difference.
Results
Sequencing
Using high-throughput sequencing (Illumina Genome
Analyzer), BCR H-CDR3 repertoires were sequenced from B cells
isolated from the PBMCs of 3 kidney transplant patients with acute
rejection by obtaining an average of 401967.4 total raw reads per
sample. After filtering and removing adaptor sequences,
contamination and low-quality reads, an average of 369,389.9 reads
that met the quality requirements were collected. The sequence
statistics for each sample after comparison and statistical
analysis are provided in Table
IV.
| Table IV.Sequence statistics for each
sample. |
Table IV.
Sequence statistics for each
sample.
|
Case/time-point | Total reads
(n) | Immune sequences
(n) | In-frame sequences
(n) | Out-of-frame
sequences (n) | Total CDR3
sequences (n) | Unique CDR3 nt
sequences (n) | Unique CDR3 AA
sequences (n) |
|---|
| Case 1 |
|
|
|
|
|
|
|
|
Pre1 | 435,064 | 431,037 | 340,034 | 90,817 | 285,020 | 39,406 | 32,744 |
|
Post1 | 496,537 | 486,442 | 268,278 | 217,707 | 182,009 | 18,828 | 15,331 |
|
Post7 | 403,593 | 398,636 | 220,842 | 177,542 | 150,370 | 23,895 | 20,310 |
| Case 2 |
|
|
|
|
|
|
|
|
Pre1 | 572,795 | 480,031 | 404,703 | 75,068 | 352,553 | 51,913 | 43,978 |
|
Post1 | 650,859 | 356,884 | 242,488 | 114,047 | 191,181 | 21,340 | 17,431 |
|
Post7 | 588,477 | 323,629 | 253,726 | 69,720 | 209,382 | 29,920 | 25,090 |
| Case 3 |
|
|
|
|
|
|
|
|
Pre1 | 922,607 | 313,193 | 240,813 | 72,173 | 202,578 | 26,384 | 21,771 |
|
Post1 | 130,4368 | 393,937 | 300,335 | 93,207 | 257,911 | 28,326 | 22,837 |
|
Post7 | 770,650 | 383,720 | 271,055 | 112,466 | 224,214 | 24,027 | 19,428 |
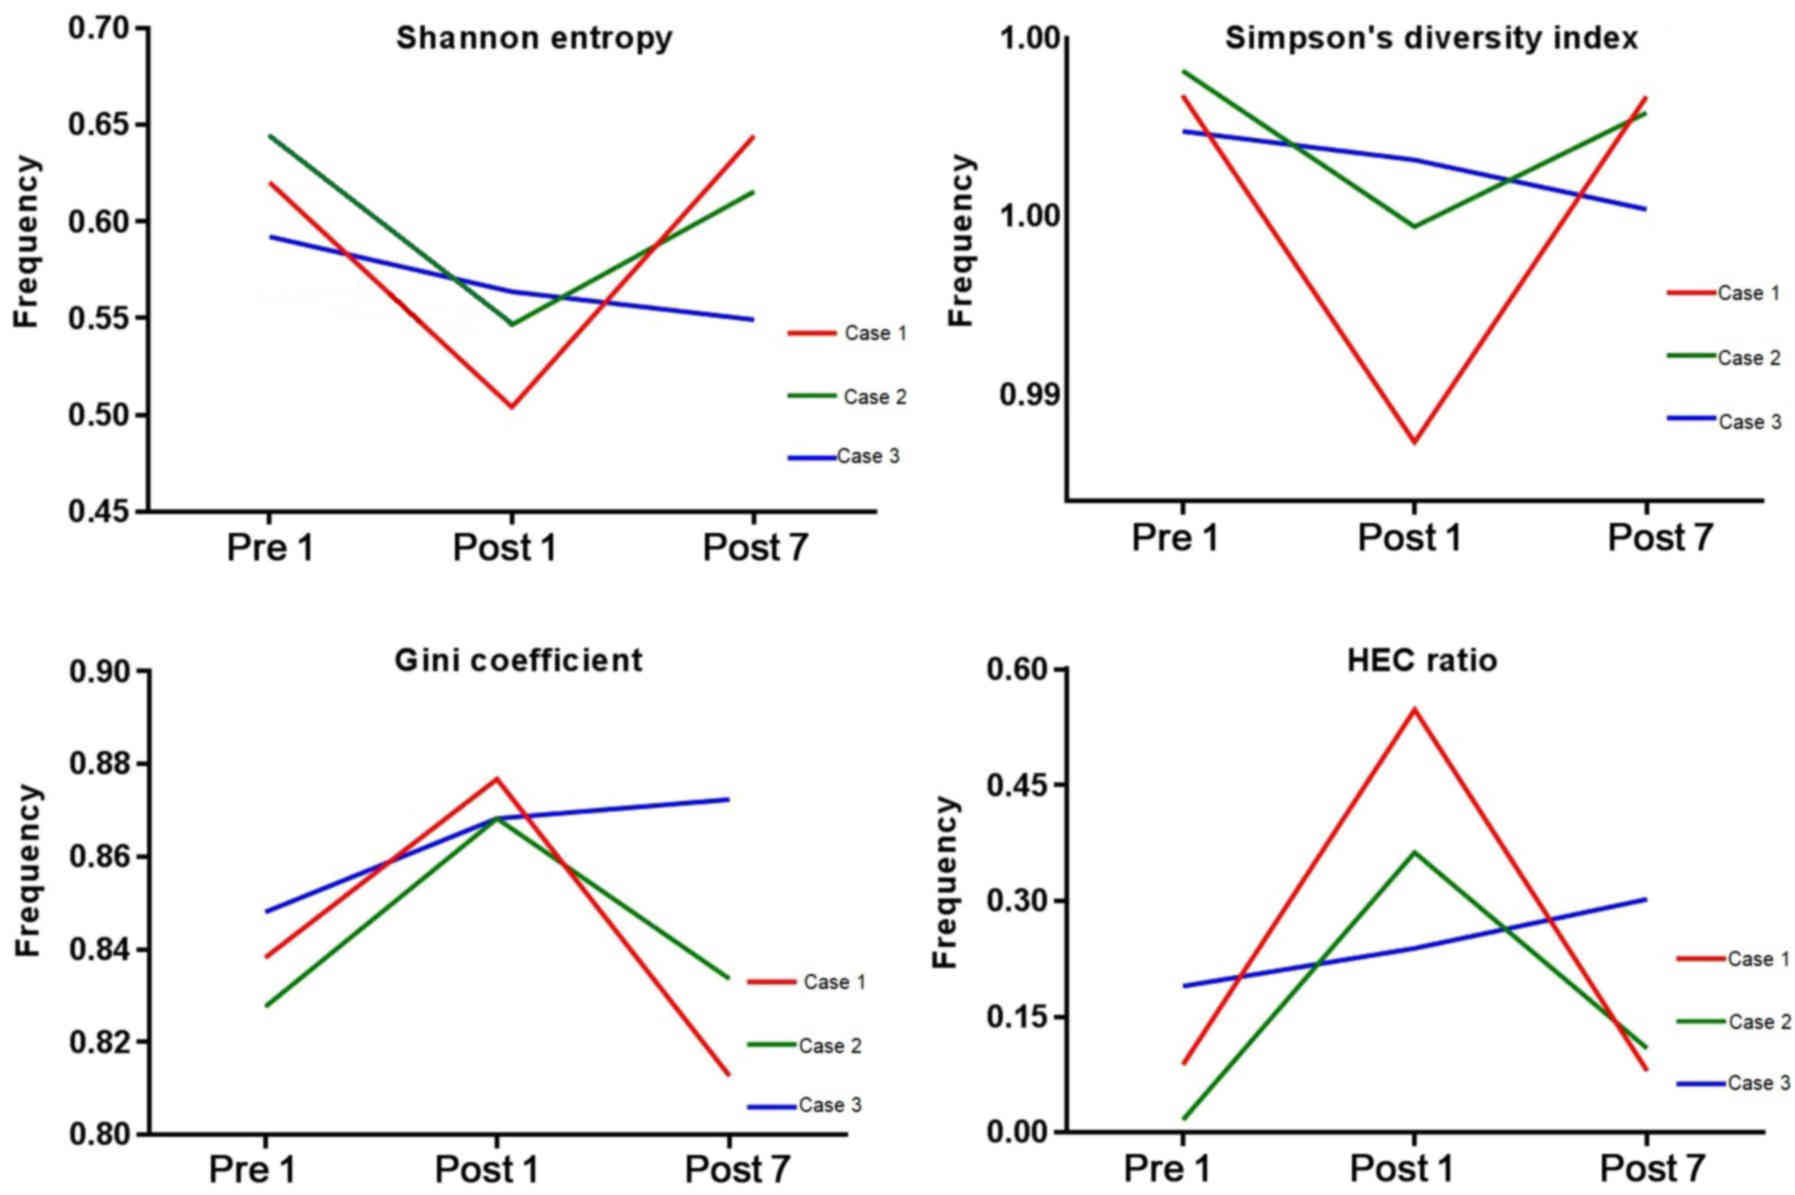
Diversity evaluation of the BCR
repertoire
To evaluate the diversity of the BCR repertoire, the
SE, SD, the Gini coefficient and HEC distributions were determined
at the three different time-points (Fig.
1). SE is a measure of diversity in the immune repertoire, with
a value closer to 1 indicating a higher diversity. The SE for Case
1, 2 and 3 was 0.620, 0.645 and 0.592, respectively, at Pre1,
0.504, 0.547 and 0.563, respectively, at Post1, and 0.644, 0.615
and 0.549, respectively, at Post7. The SE at Pre1 was significantly
lower than that at Post1 (P=0.0267). The SD index may be used to
describe the diversity of the clone type of the BCR H-CDR3 in each
patient at different time-points, which a larger index indicating a
greater diversity. The SD index for Case 1, 2 and 3 at Pre1 was
0.9984, 0.9991 and 0.9974, respectively, that at Post1 was 0.9885,
0.9947 and 0.9966, respectively and that at Post7 was 0.9984,
0.9979 and 0.9952 respectively. The Gini coefficient is used to
measure the heterogeneity of different clone types, with 1
indicating only one clone and 0 indicating the same frequency of
all clones in the samples. At Pre1, the Gini coefficient for Case
1, 2 and 3 was 0.838, 0.828 and 0.848, respectively, that at Post1
was 0.877, 0.868 and 0.868, respectively, and that at Post7 was
0.813, 0.834 and 0.872, respectively. The Gini coefficient at Post1
was significantly lower than that at Pre1 (P=0.0164). The HEC ratio
is defined as the expression of a certain CDR3 sequence exceeding
0.5% of the total CDR3 sequence. At Pre1, the HEC ratio for Case 1,
2 and 3 was 0.088, 0.017 and 0.190, respectively, that at Post1 was
0.547, 0.363 and 0.239, respectively and that at Post7 was 0.080,
0.109 and 0.302, respectively. Fig.
1 indicates that the initial diversity of the BCR repertoire of
Case 1 and 2 was higher at Pre1, decreased at Post1 and then
increased at Post7. That of Case 3 was lower at Pre1 and then
decreased after transplantation. From the results, the current
study hypothesized that the pre-operative induction drugs and
surgical trauma increased the HEC number and reduced the immune
diversity of CDR3. With the recovery of immune function after
transplantation, or the assumed lack of withdrawal
immunosuppression, the number and ratio of HECs decreased in the
patients and then increased.
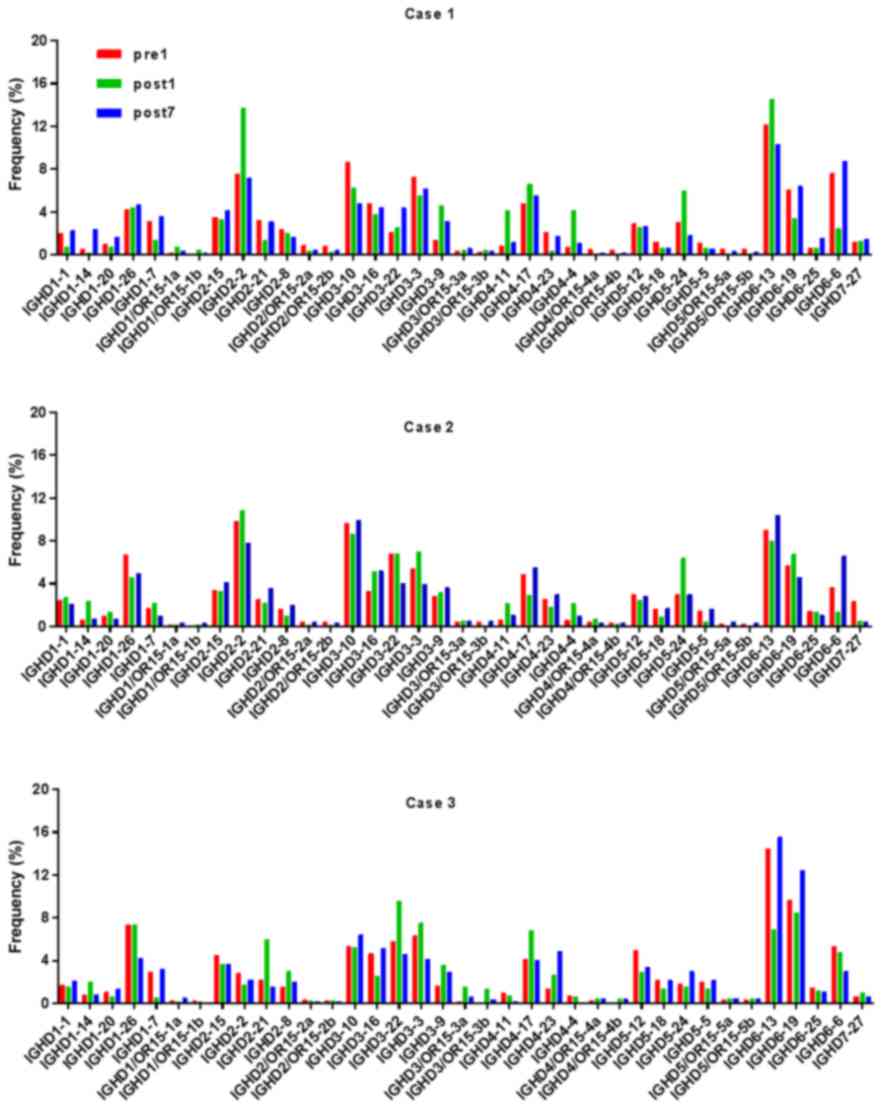
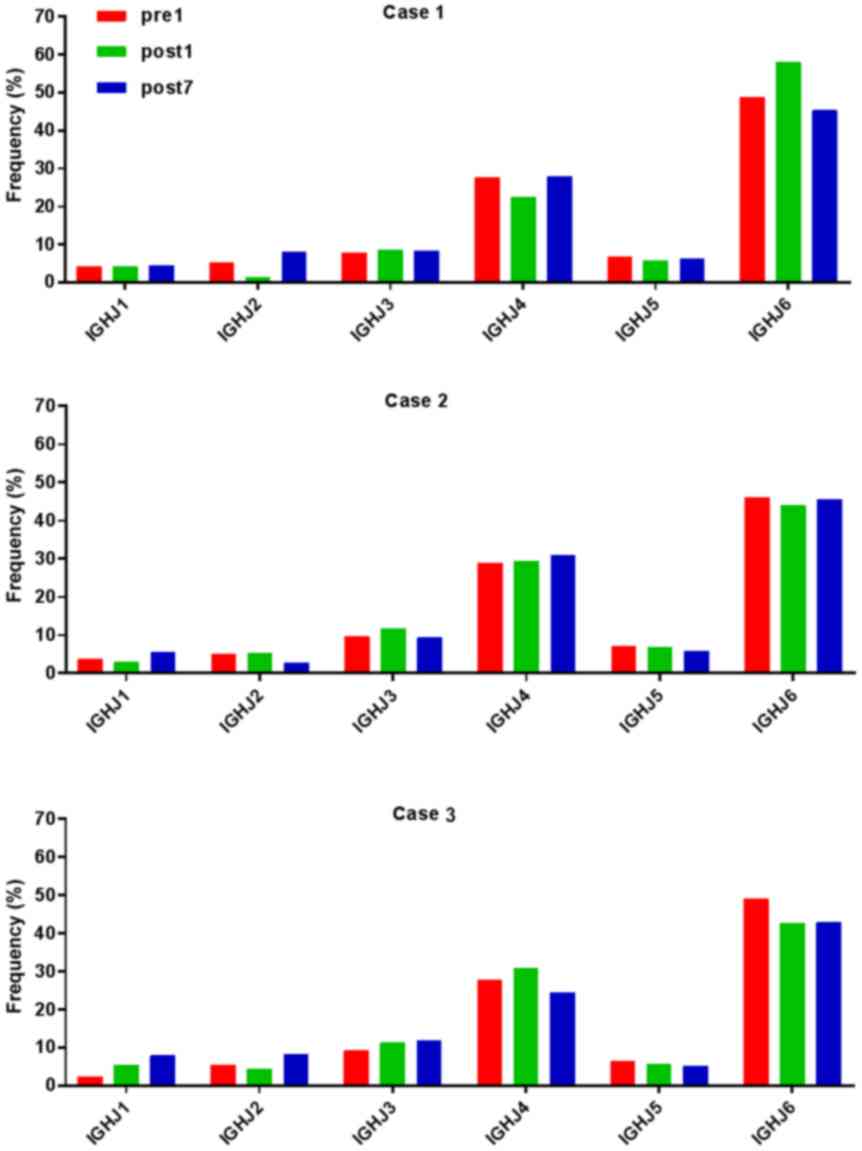
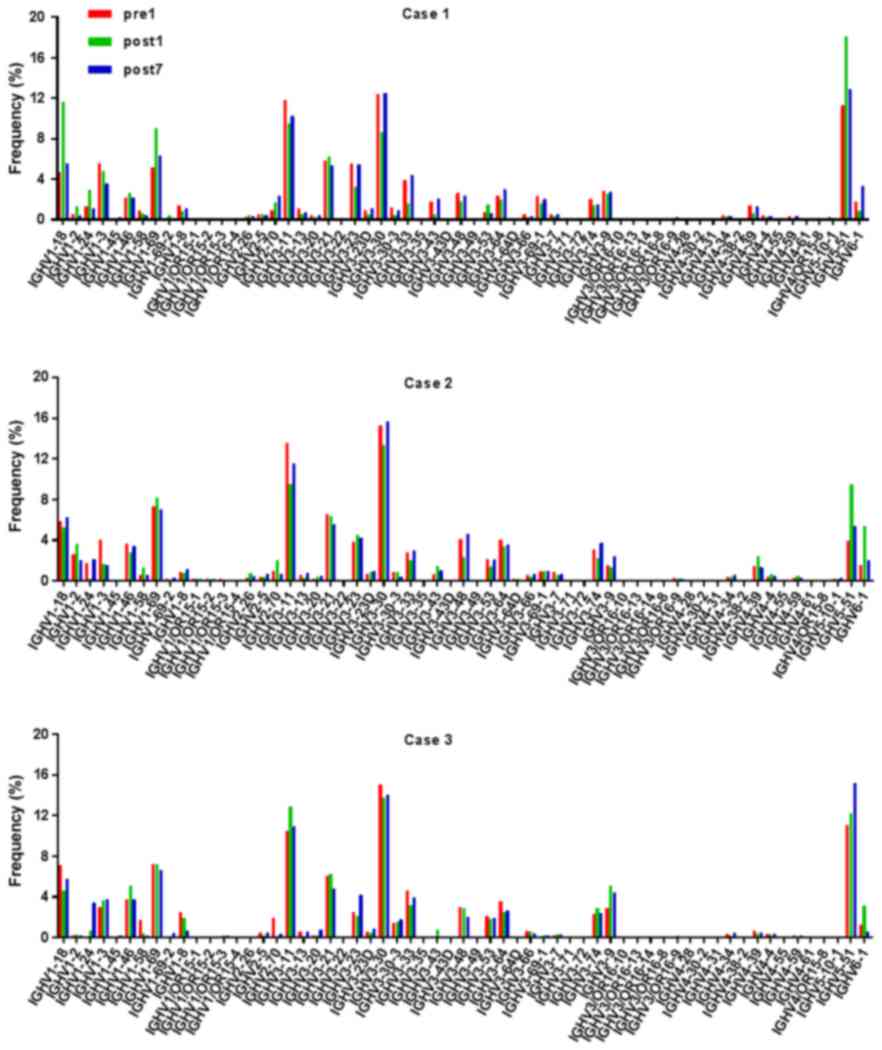
Analysis of IGHD, IGHJ and IGHV gene
families
Ig gene sequences have recently gained significance
in clinical decision-making. To evaluate changes in the IGHD, IGHJ
and IGHV gene frequencies of the three patients over time, the
frequencies were calculated at different time-points. As indicated
in Figs. 2, 3 and 4,
respectively, the IGHD, IGHJ and IGHV gene family distributions of
the patients have different expressions levels at each time-point.
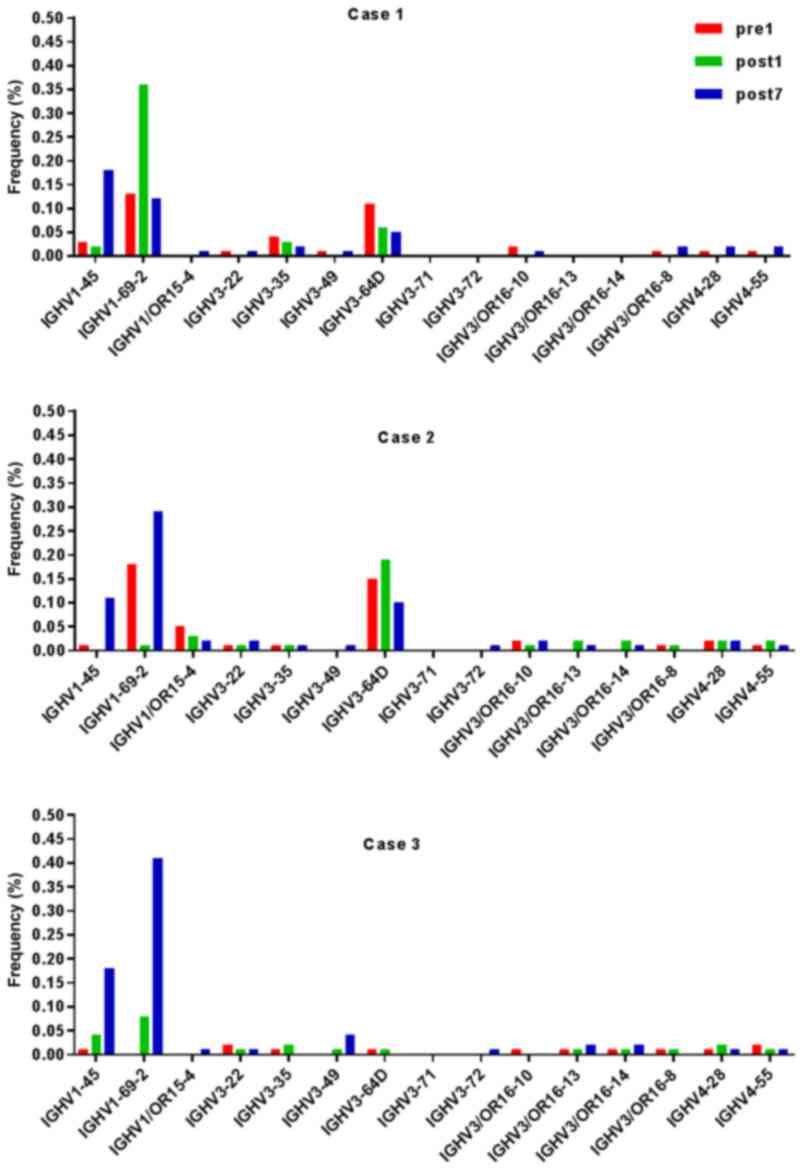
Fig. 5 indicates that the BCR
repertoire of the IGHV gene family was altered after
transplantation. For instance, Case 1 lost IGHV3-22, IGHV3-49,
IGHV3/OR16-10, IGHV4-28 and IGHV4-55 after transplantation. Case 2
gained new IGHV usage at a low frequency, including IGHV3-64D and
IGHV3-72. Case 3 gained new IGHV usage, IGHV1-69-2 at Post1 and
IGHV1/OR15-4 and IGHV3-72 at Post7, while he lost IGHV3-64D and
IGHV3/OR16-8 at Post7. Of note, these gene changes were all within
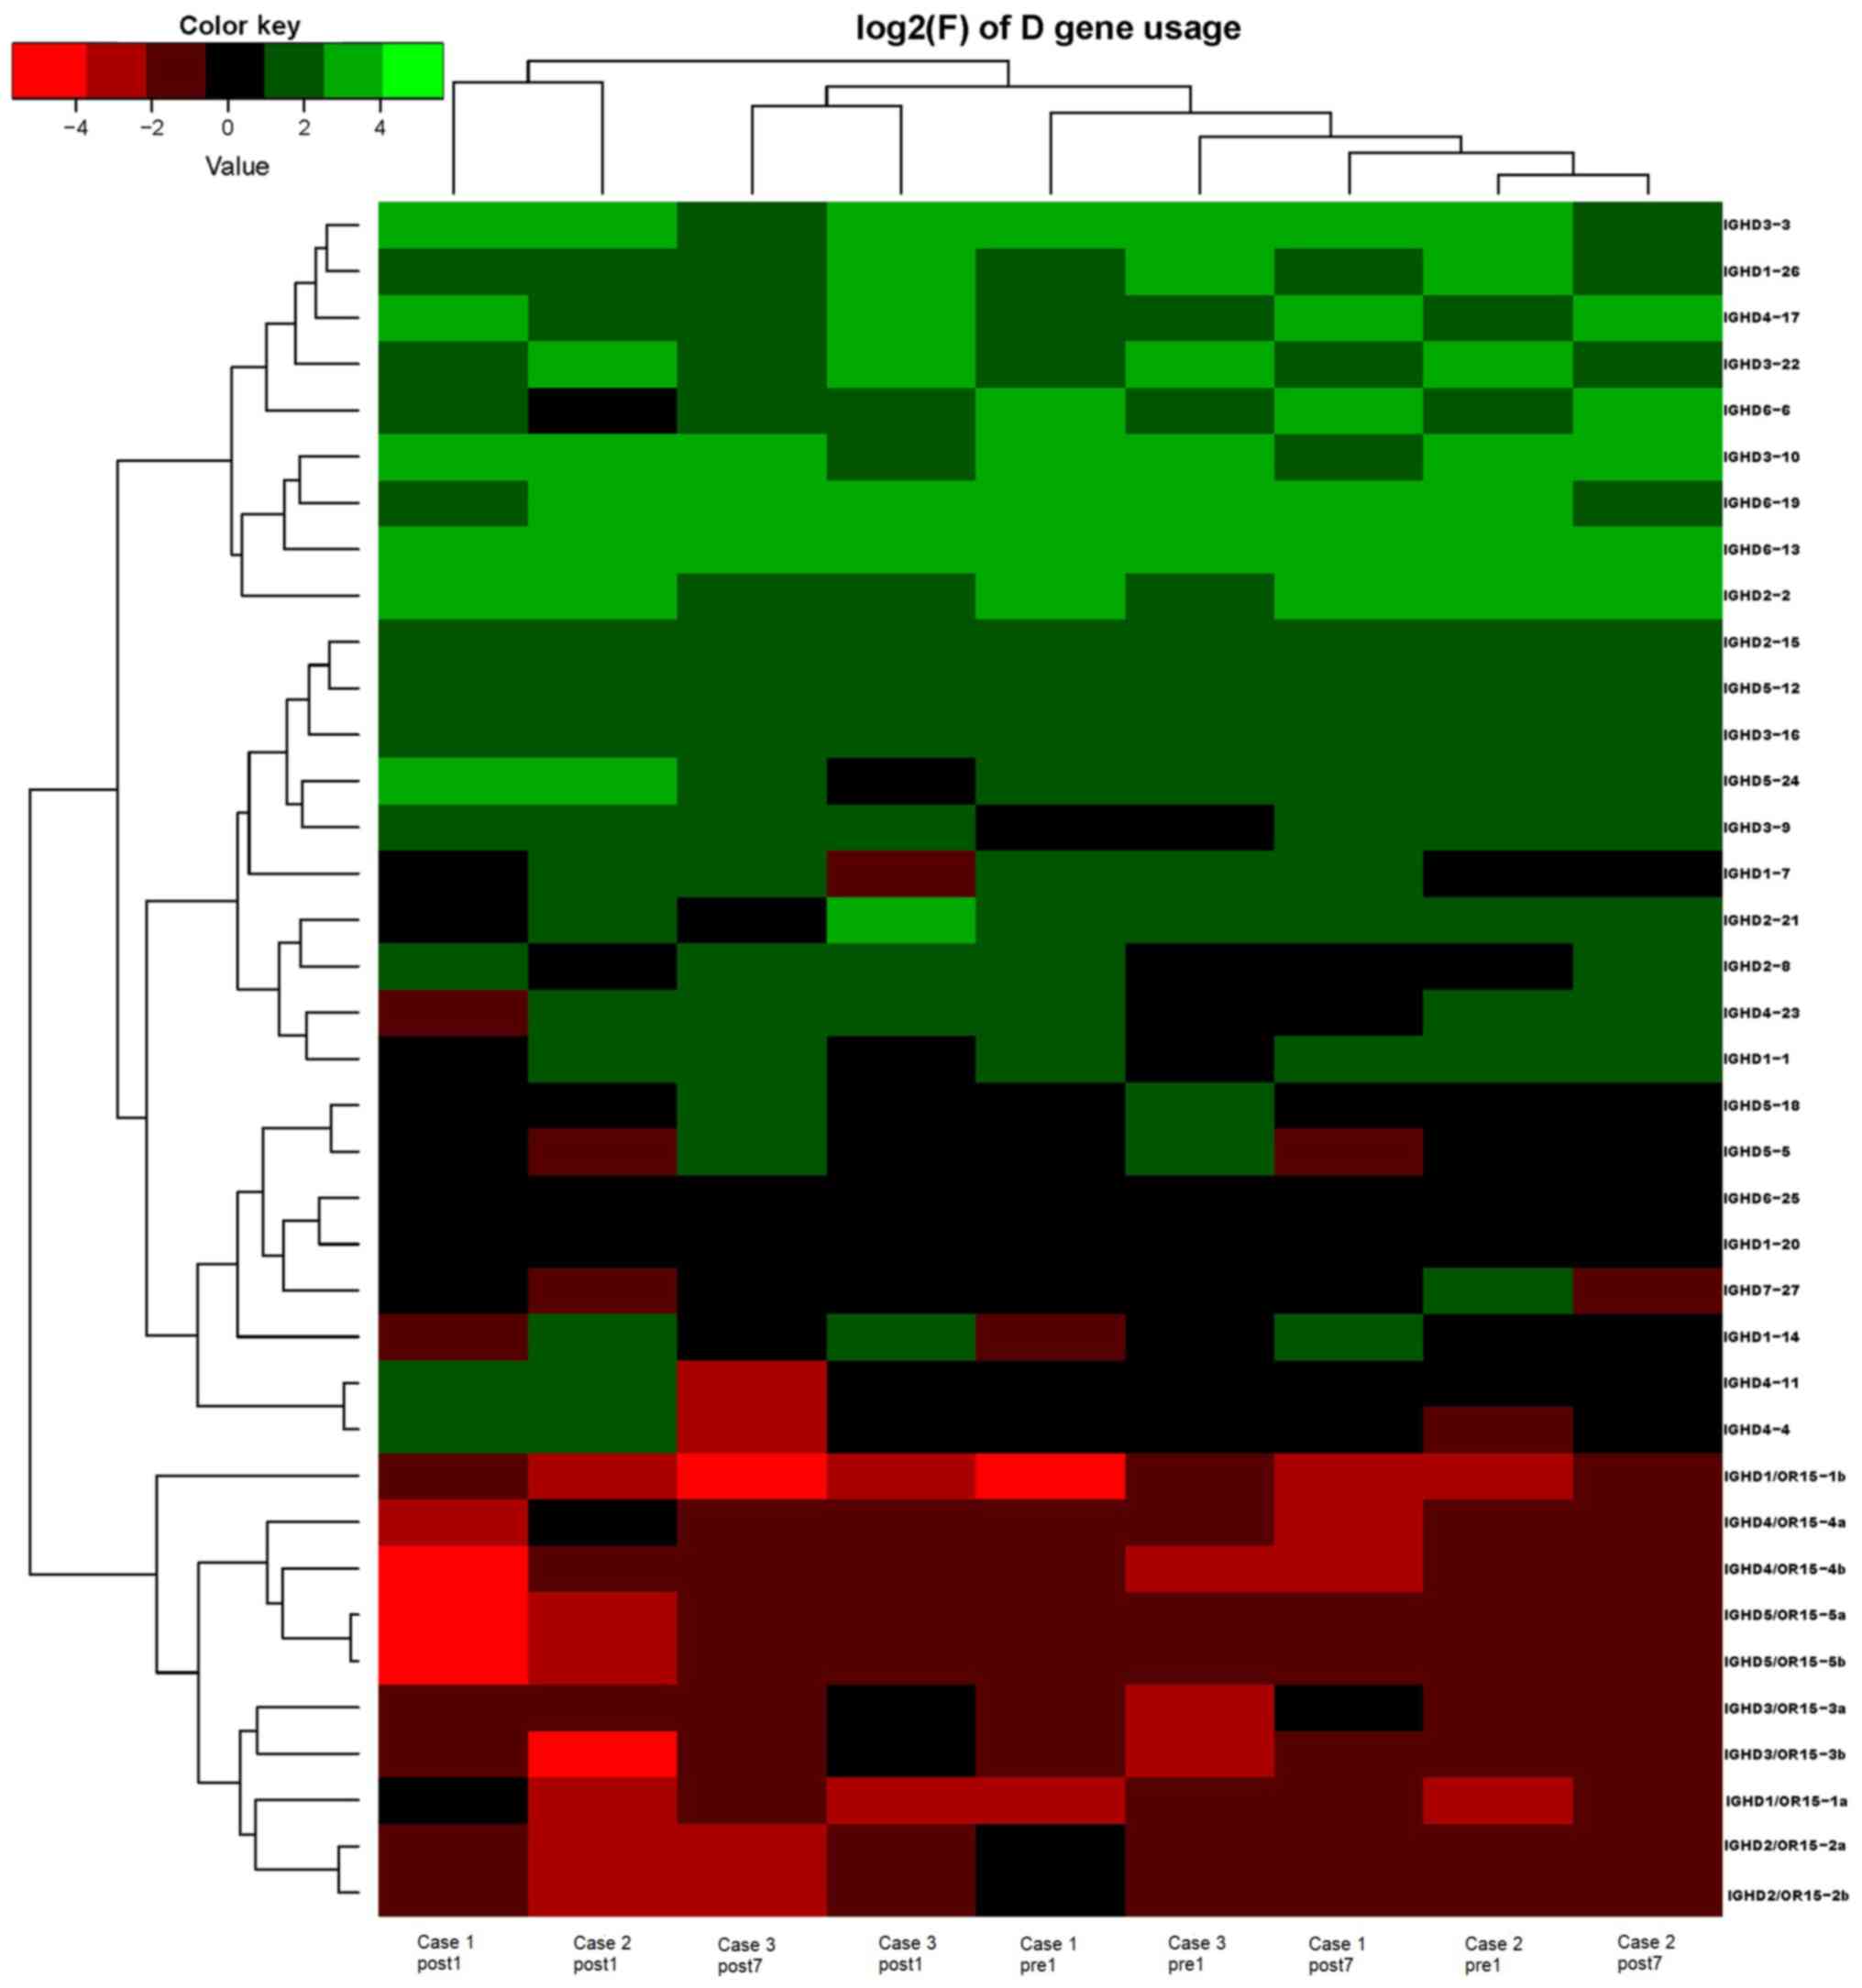
the IGHV3 family. The usage frequency of the IGHD and IGHV gene
families was also analyzed, and it was assessed which genes were
upregulated and downregulated. At Post1, IGHV3/OR was significantly
upregulated (P=0.0474), while IGHD3-9 was significantly
downregulated (P=0.0437). At Post7, IGHV3-21 was significantly
upregulated (P=0.0328), and IGHD2-15 and IGHV1-45 were
significantly downregulated (P=0.0456 and 0.0143, respectively).
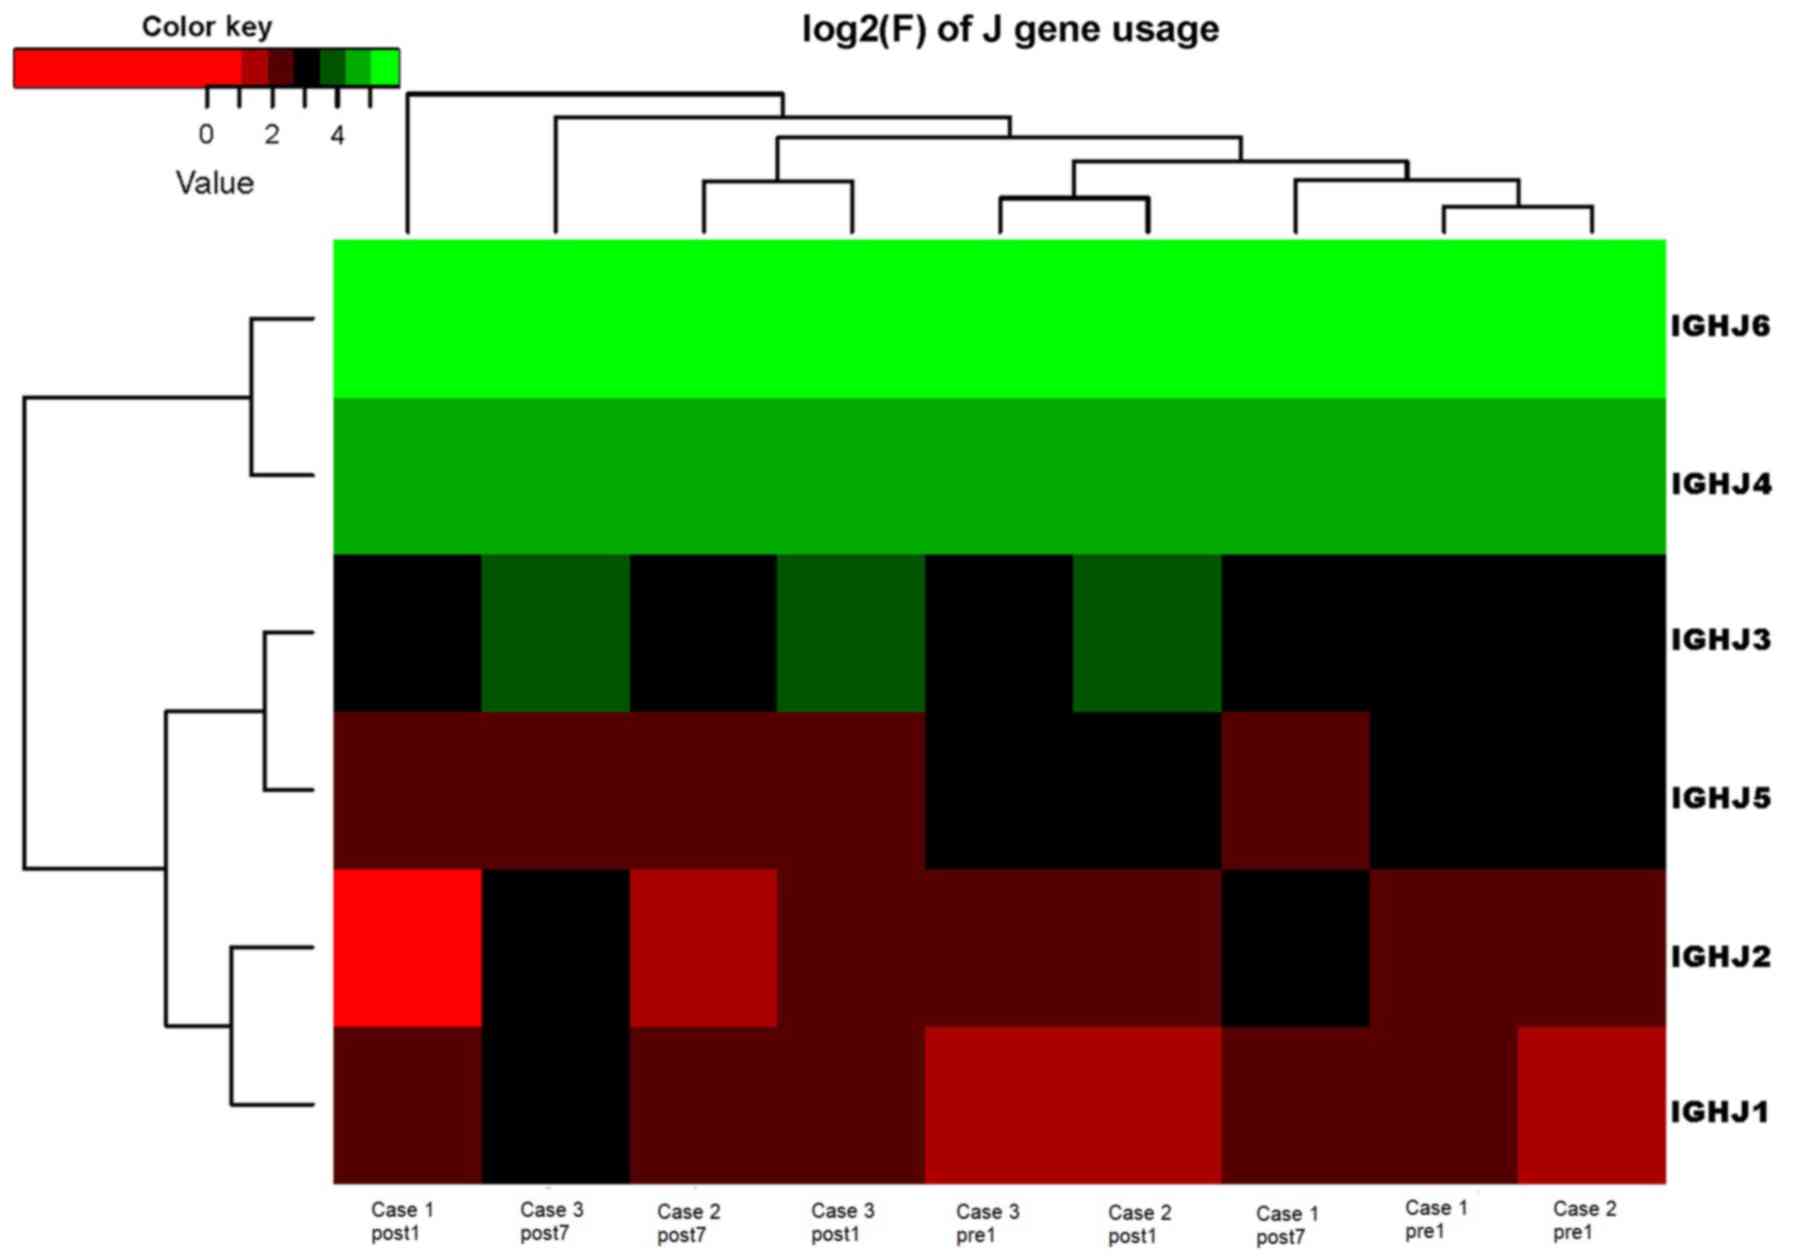
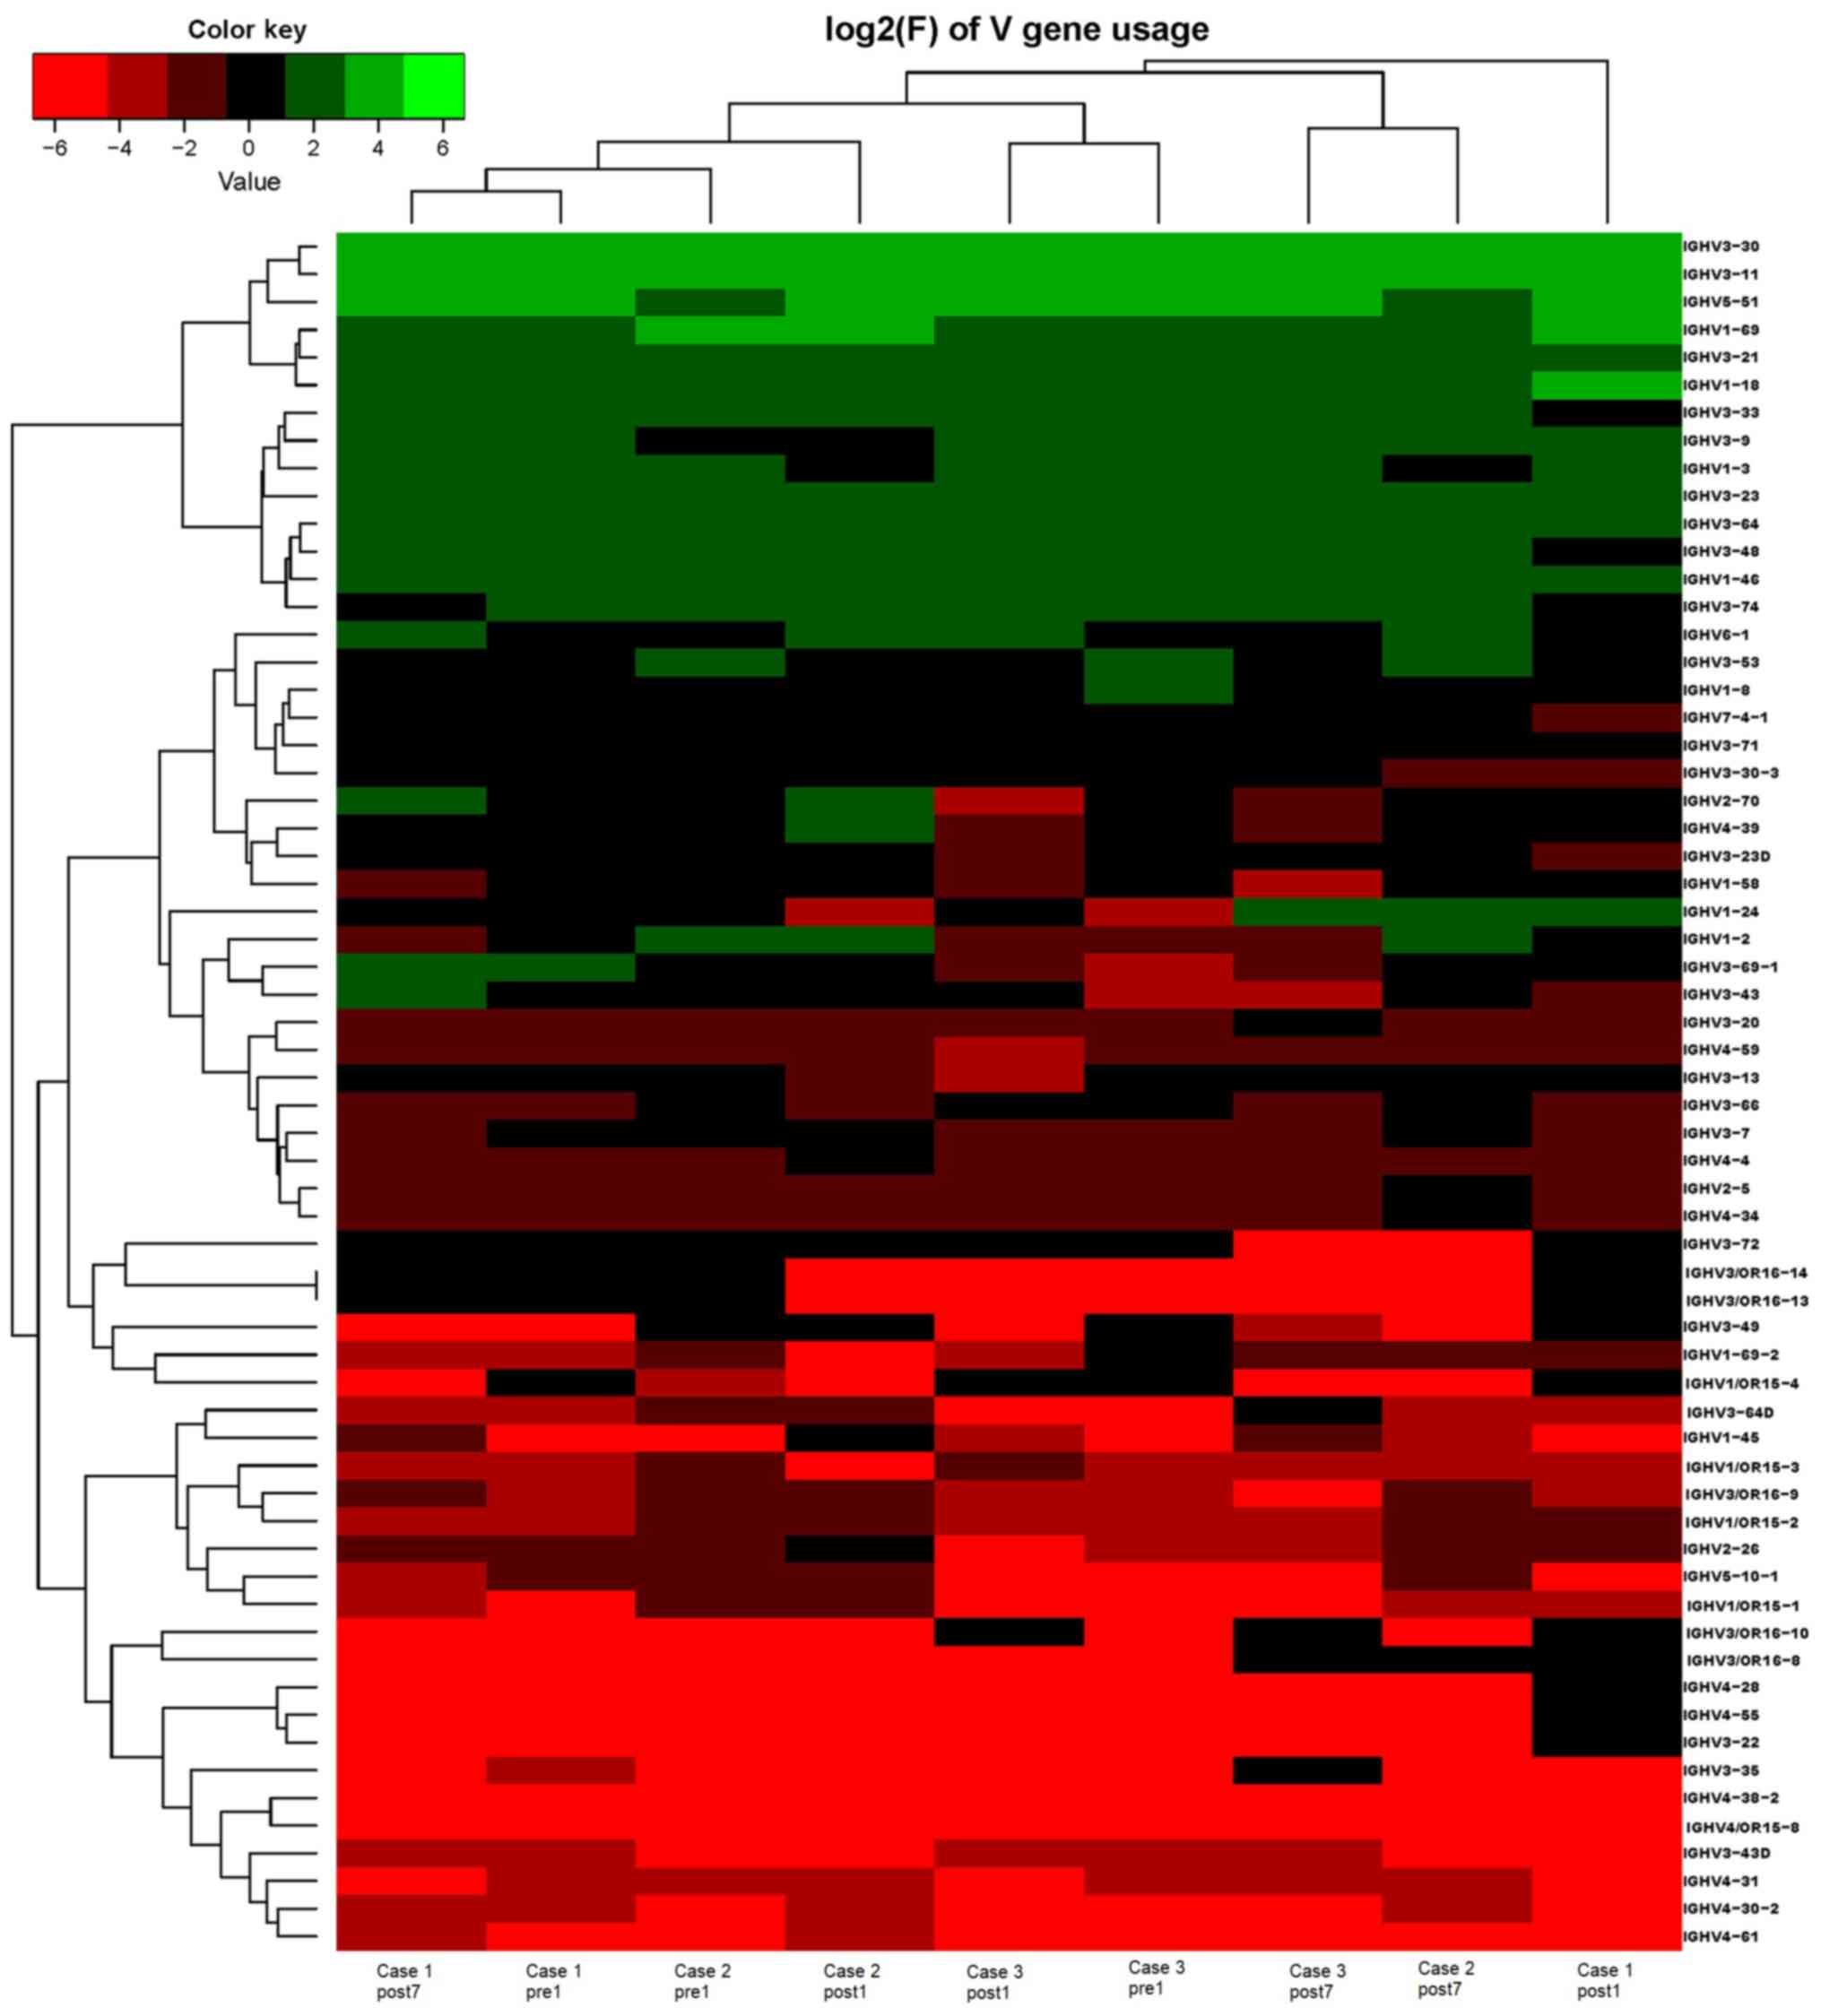
Heat maps detailing the differential expression of the genes among
the different patients at different time-points are presented in
Fig. 6, while those for IGHJ are
provided in Fig. 7 and those for the
IGHV gene family in Fig. 8.
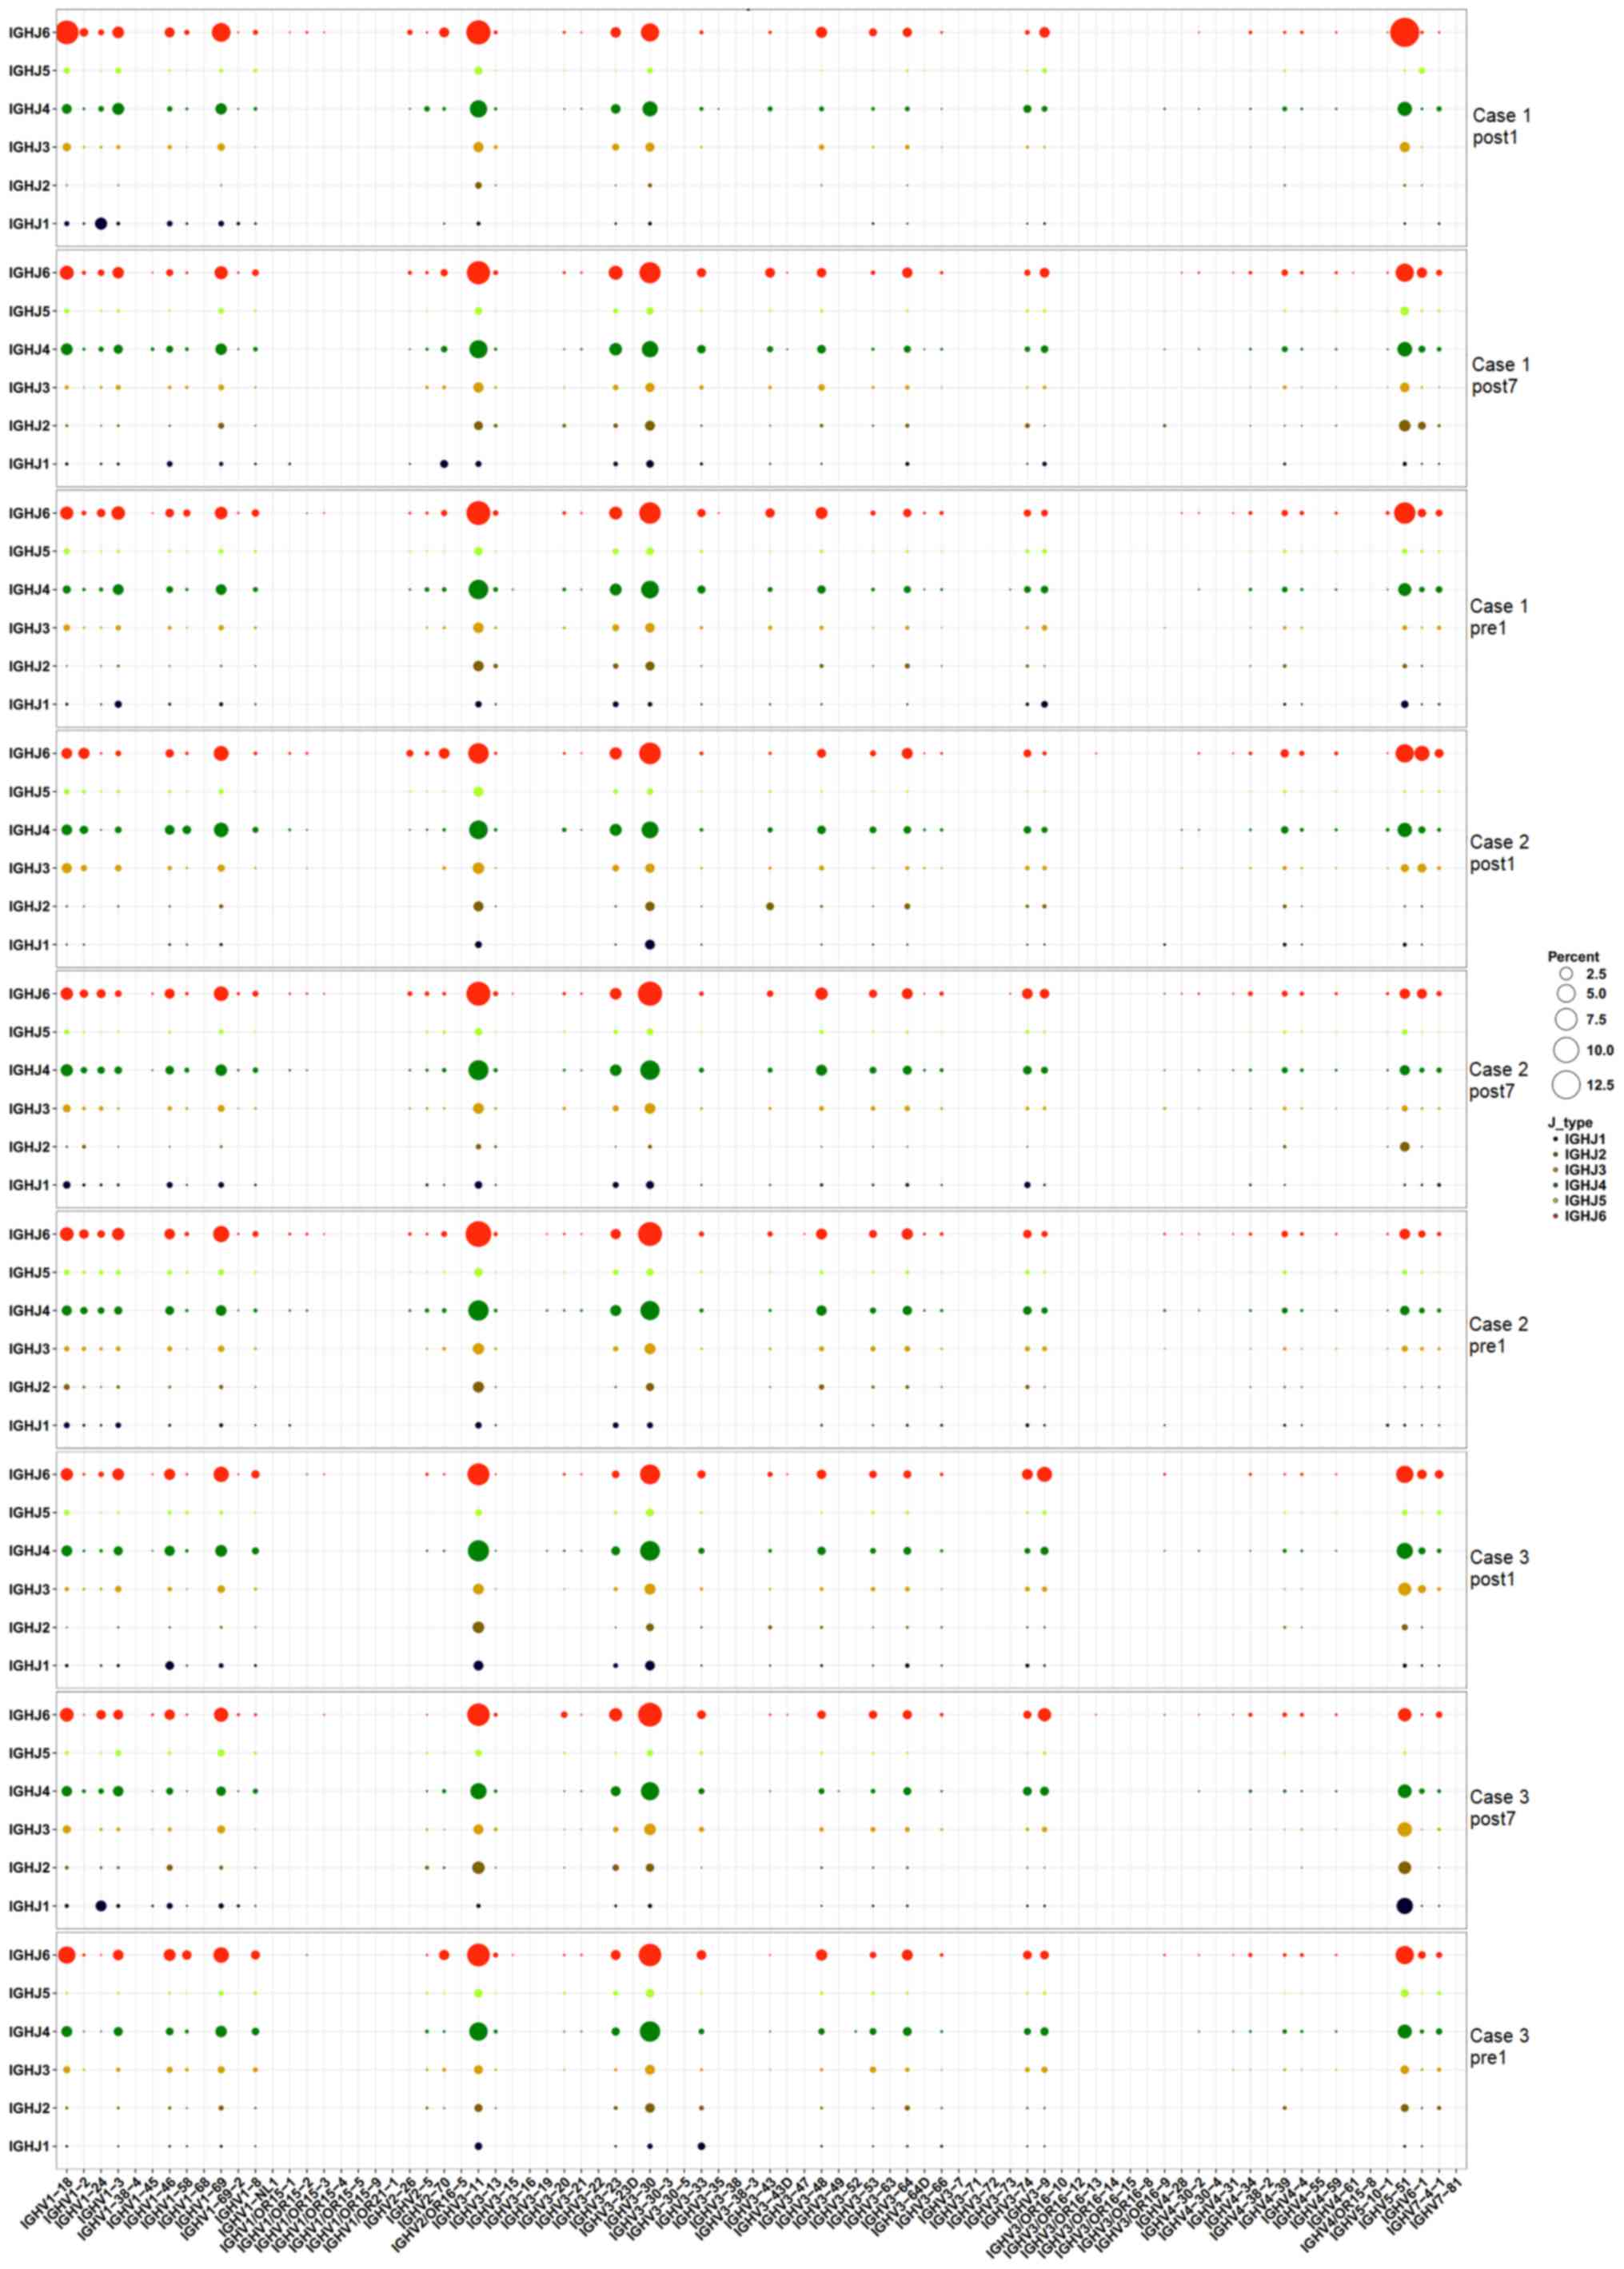
Pairing of IGHV-IGHJ genes
To assess changes in IGHV-IGHJ gene pairing over
time, the frequency of IGHV-IGHJ pairing was calculated for the
three time-points. The heat map in Fig.
9 indicates that IGHV-IGHJ gene pairing in the three patients
was not markedly changed at the three time-points. It is worth
noting that all 3 cases had a similar dominant pairing. Different
colors represent different IGHJ genes, and the size of the circles
represents the level of expression. The genes that exhibited high
expression levels included IGHJ6-IGHV3-11, IGHJ4-IGHV3-11,
IGHJ6-IGHV3-30, IGHJ4-IGHV3-30 and IGHJ6-IGHV5-51.
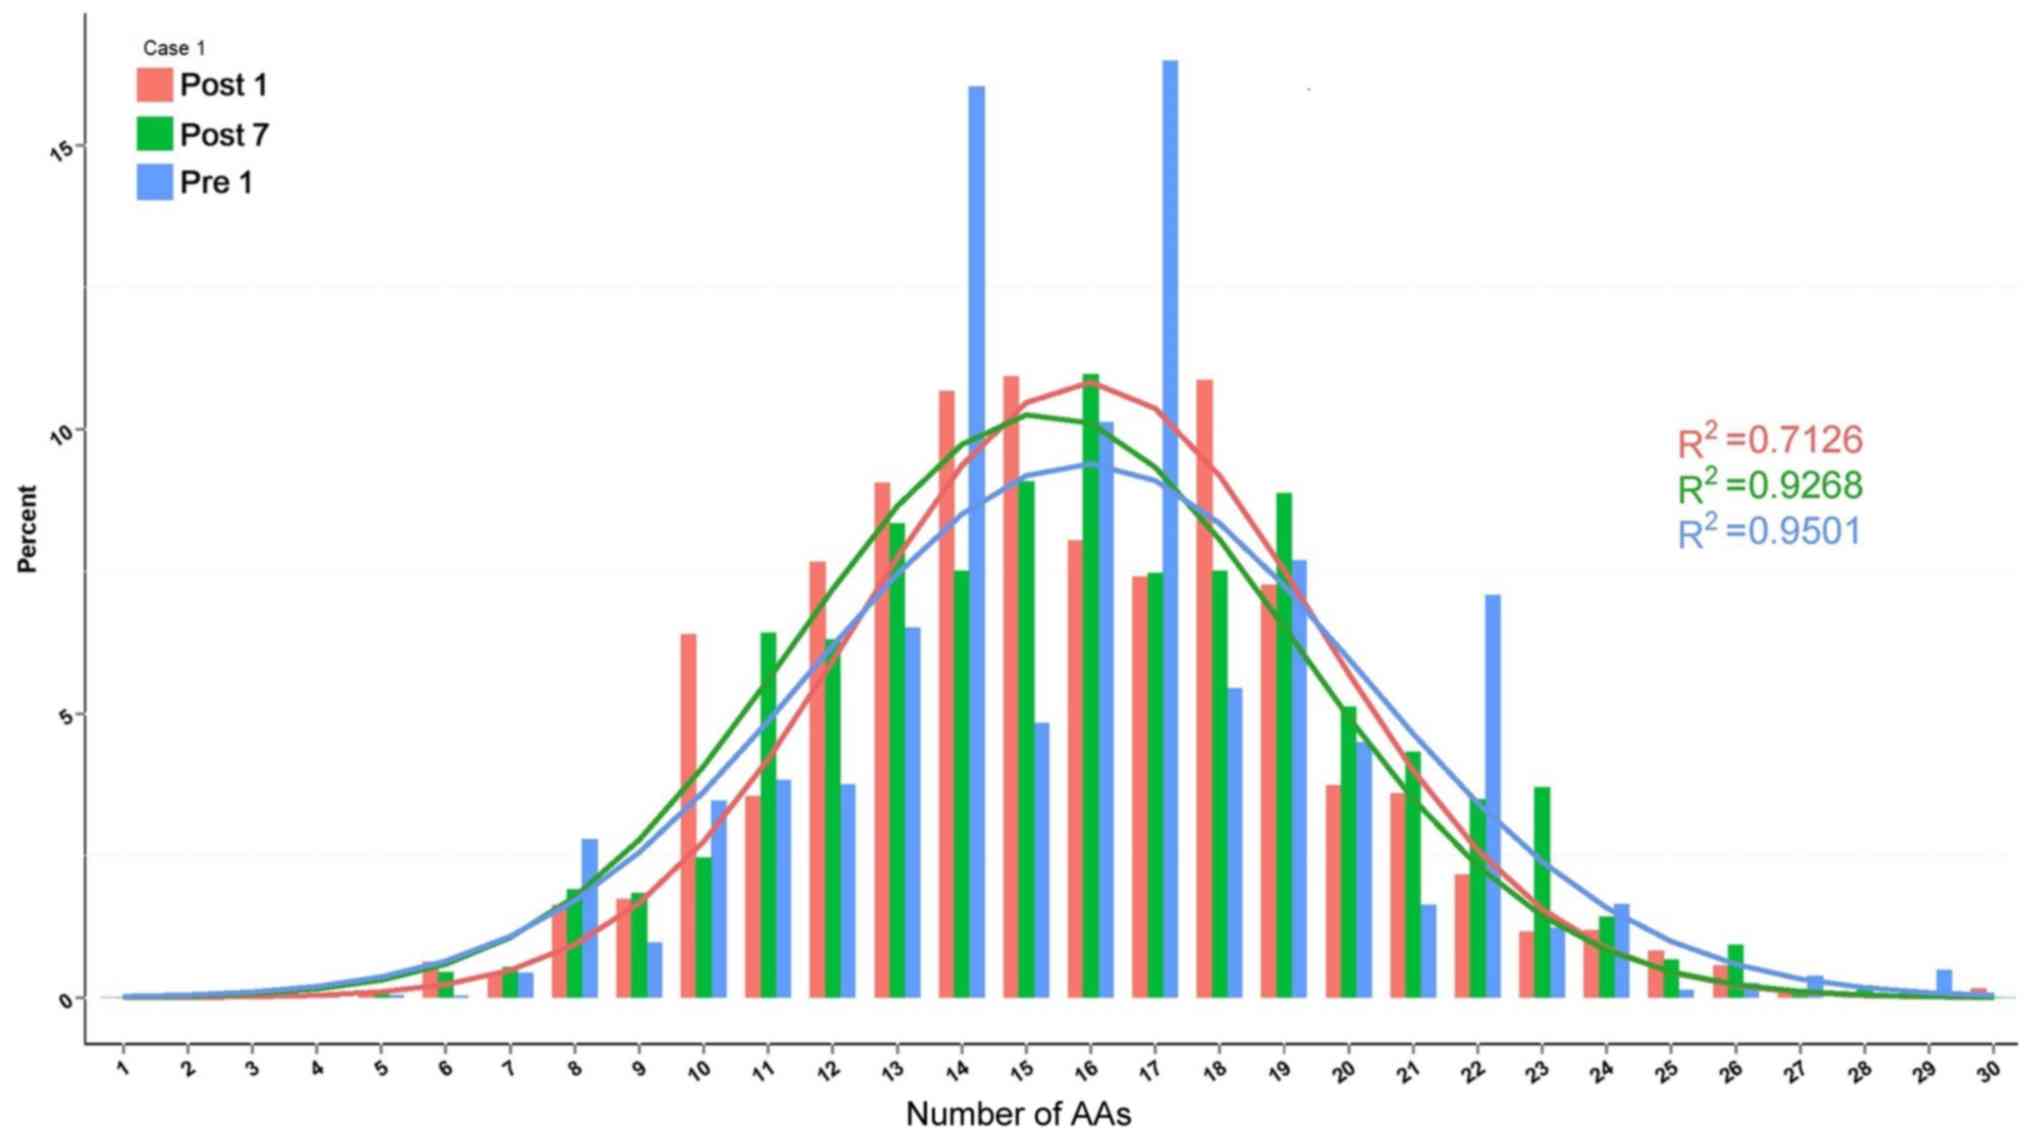
Length distribution of H-CDR3
The change in composition of unique H-CDR3 over
time, including H-CDR3 length distribution and H-CDR3 amino acid
(AA) usage, was then assessed. The change in H-CDR3 length
distribution in the 3 patients is provided in Figs. 10–12. The length of CDR3 in healthy people
should be similar to the gaussian distribution. Where R2
is the fitting value of gaussian distribution, R2 is the
closer to 1 and the value is the closer to the gaussian
distribution. For the H-CDR3 length distribution of Case 1, the
R2 value at Pre1, Post1 and Post7 was 0.9501, 0.7126 and
0.9268, respectively. The AA usage of unique H-CDR3 in Case 1 was
17 and 14 AA at Pre1, 14, 15 and 18 AA at Post1 and 16 AA at Post7
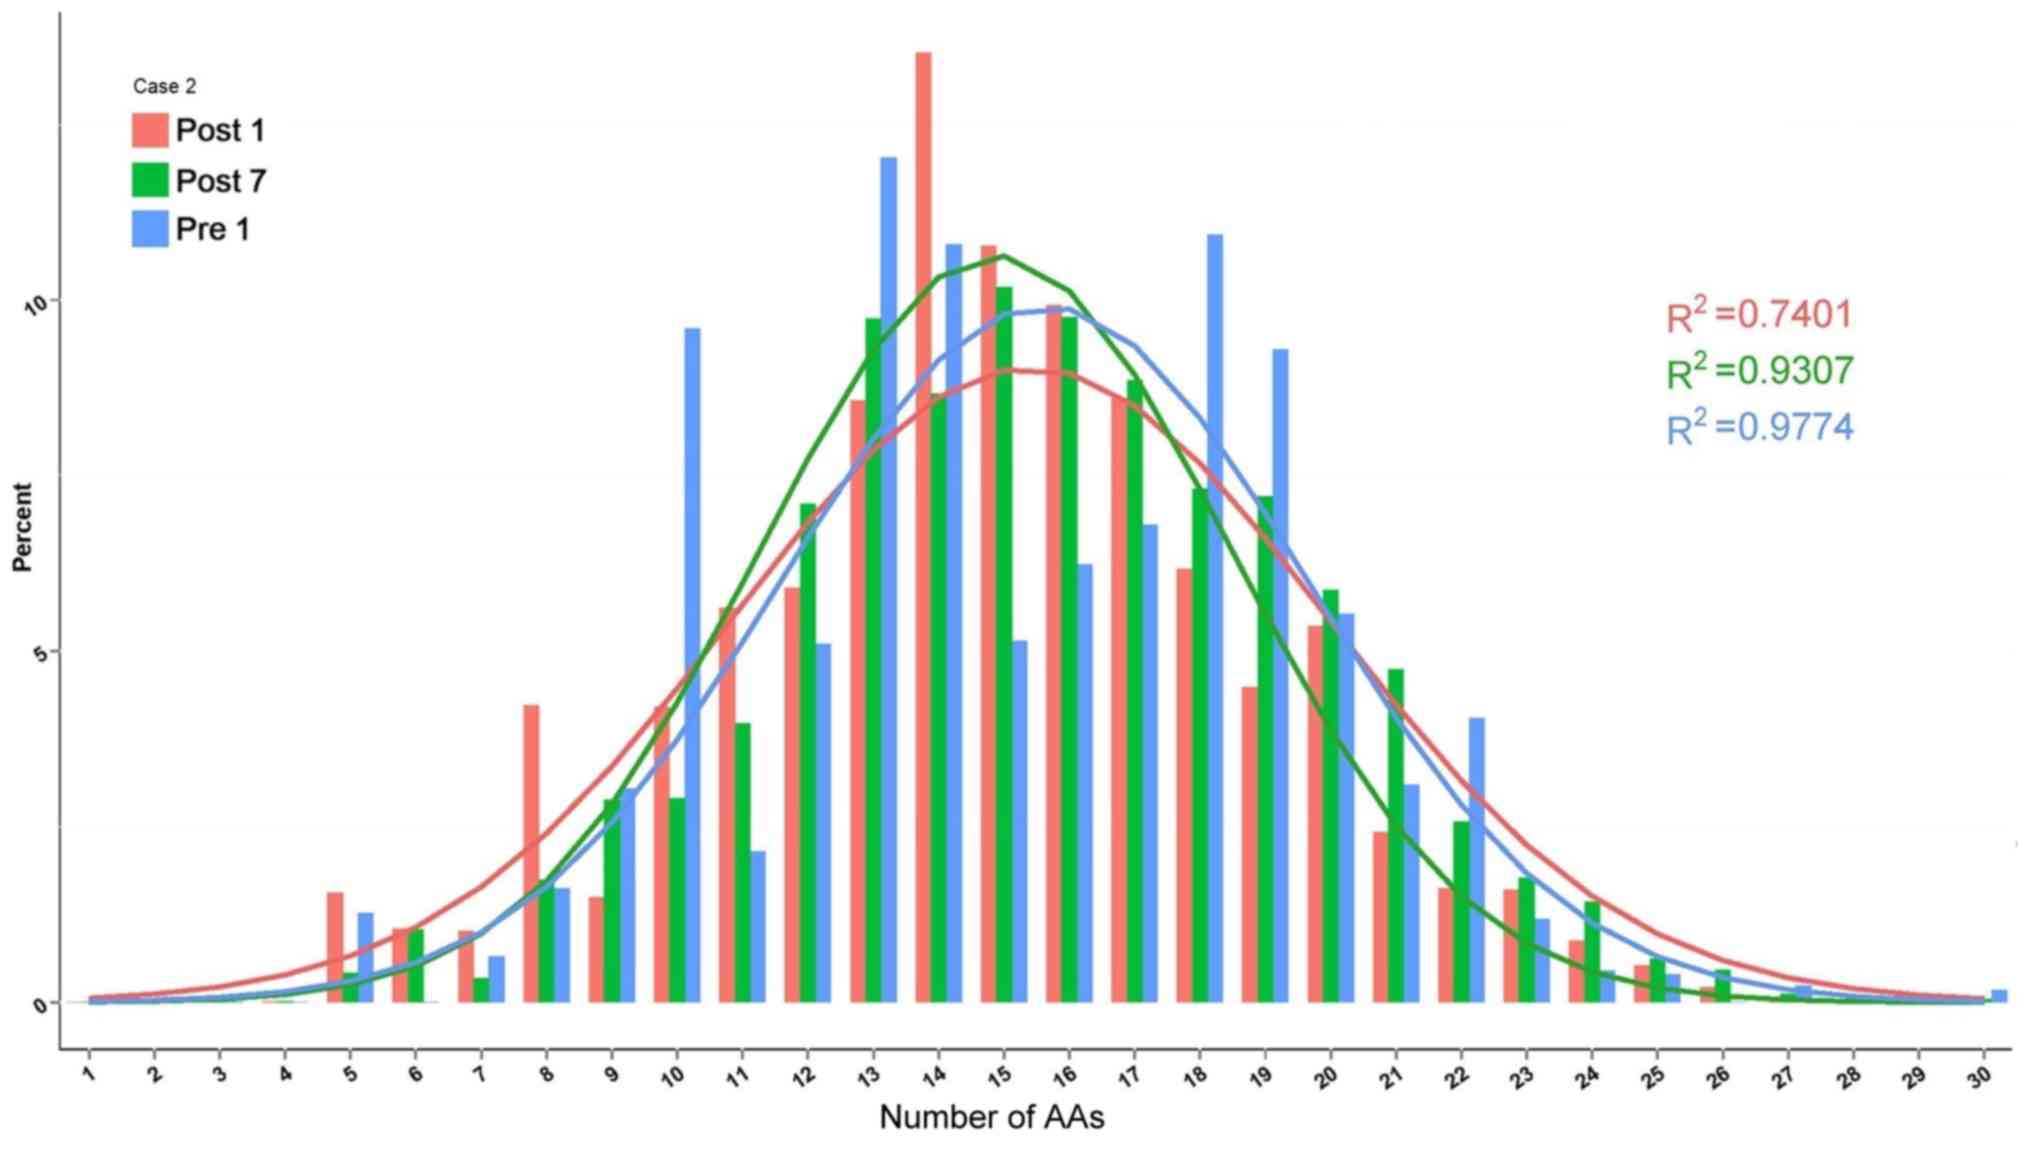
(Fig. 10). For the H-CDR3 length
distribution of Case 2, the R2 value at Pre1, Post1 and
Post7 was 0.9774, 0.7401 and 0.9307, respectively (Fig. 11). The AA usage of unique H-CDR3 for
Case 2 was 13, 14 and 18AA at Pre1, 14 and 15 AA at Post1 and 13,
15 and 16 AA at Post7. The CDR3 length distribution of Case 1 was
similar to that of Case 2. The diversity of the BCR repertoire was
the highest at Pre1 and the lowest at Post1, and was then increased
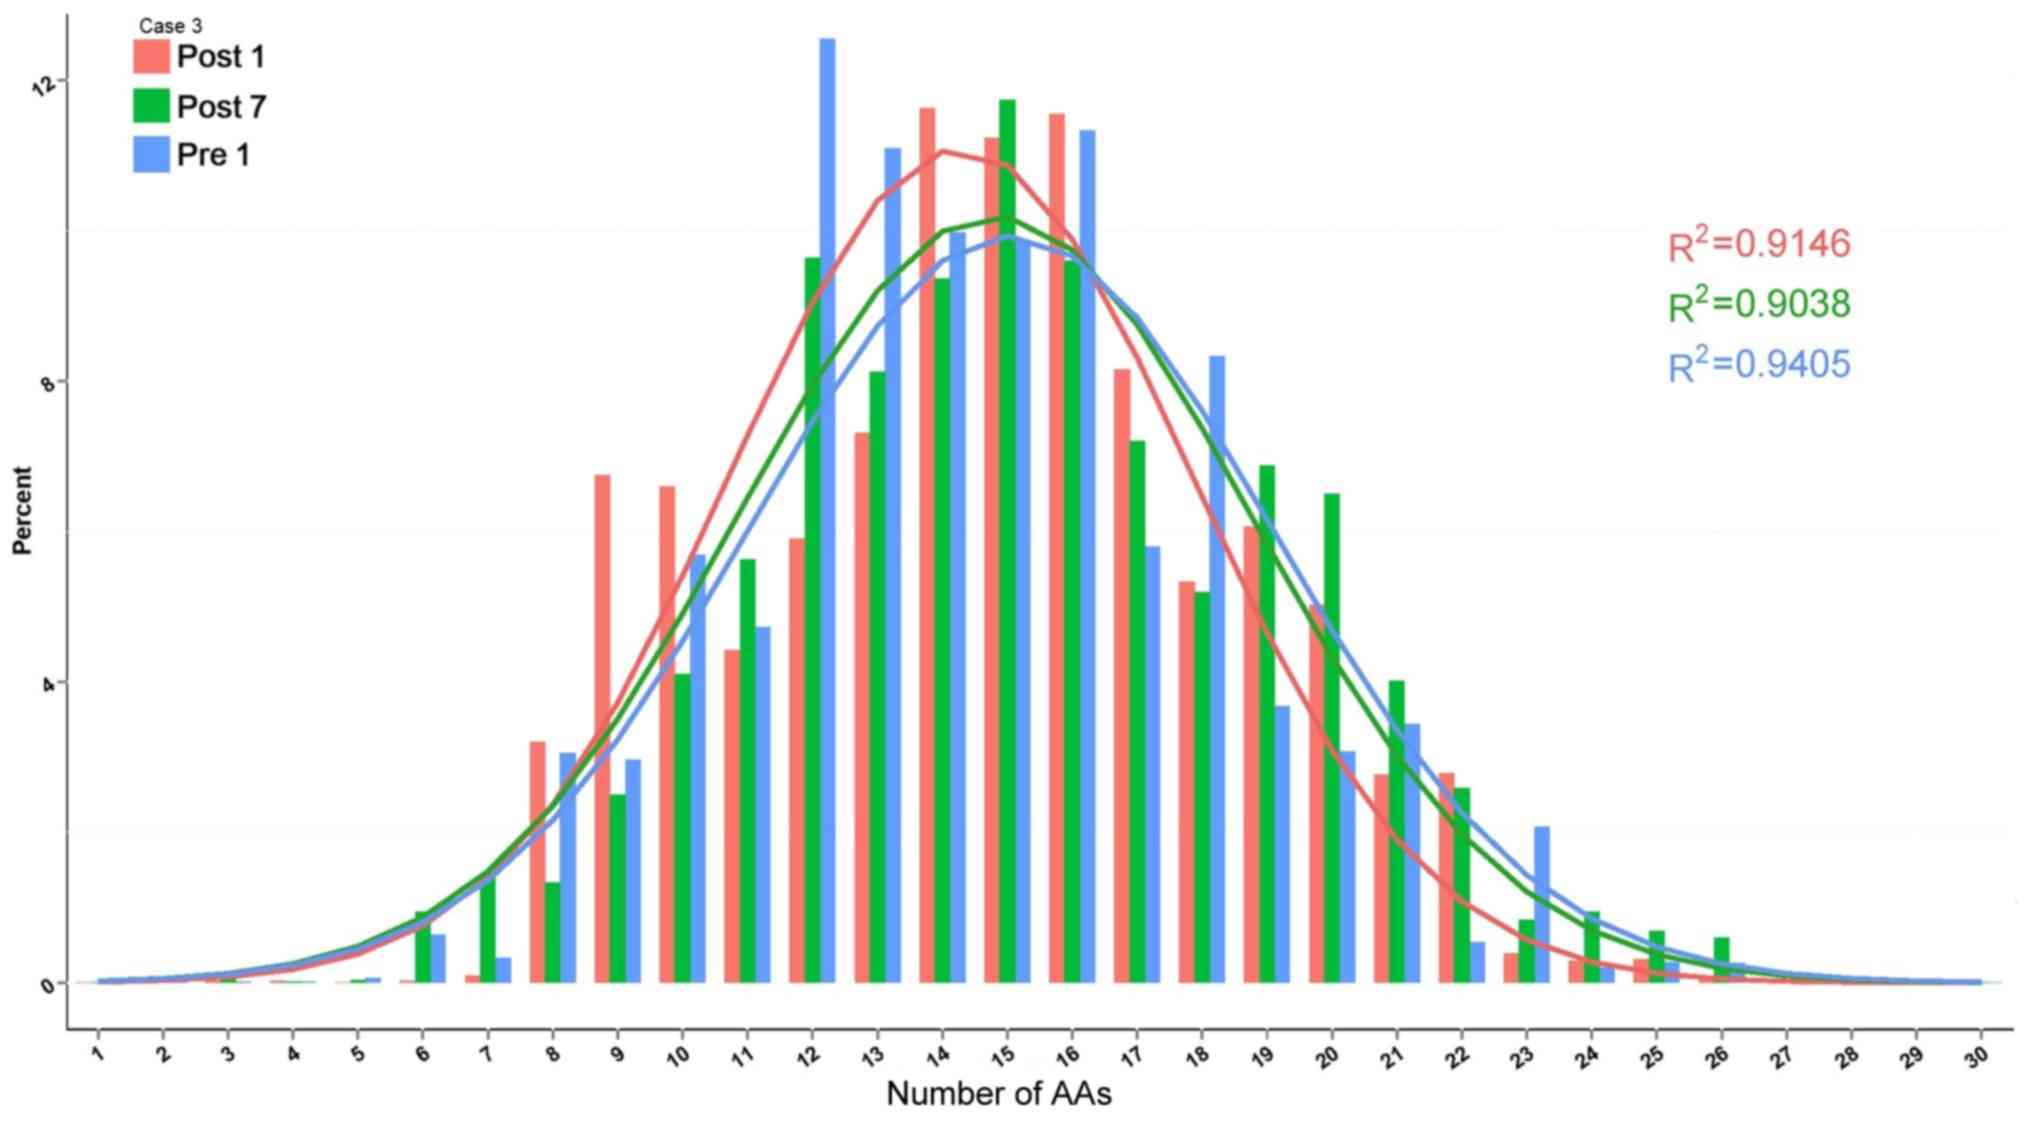
again at Post7, but not to the pre-operative level. For the H-CDR3
length distribution of Case 3, the R2 value at Pre1,
Post1 and Post7 was 0.9405, 0.9146 and 0.9038 (Fig. 12). The AA usage of unique H-CDR3 for
Case 3 was 12 and 13AA at Pre1, 14–16 AA at Post1 and 15AA at
Post7. The diversity of the BCR repertoire of Case 3 did not change
significantly.
Discussion
B cells represent a major component of the cellular
immune system. Acute rejection after kidney transplantation is
mainly caused by cellular immunity and is reversible in a large
proportion of cases. When rejection occurs, the patient produces a
large number of cytotoxic T cells, which then kill their target
cells directly, and furthermore, the patient's T cells help to
activate lymphokines to then promote the differentiation of
B-cells, which produce antibodies against the graft, ultimately
leading to acute rejection after kidney transplantation (17). Certain studies conclude that B-cell
diversity exhibits a marked decrease with age, and B-cell immune
frailty is also a marker of general frailty (18). Patients with Omenn syndrome have a
high proportion of class-switched IHC transcripts and an increased
somatic hypermutation rate, suggesting in vivo activation of
these B cells (19). The BCR is an
indispensable functional receptor for B cells and its diversity
ensures that B cells are able to respond to a variety of different
Ags. B cells also participate in the anti-inflammatory response and
tolerance induction (20). Studies
have indicated that in addition to its association with the
clinical and phenotypic presentation, renal allograft tolerance is
highly associated with the B-cell signature. Newell et al
(21) demonstrated that the
regulation of cellular immunity is a critical role for B cells and
provided a set of candidate genes for the wider-scale screening of
kidney transplant recipients.
Characterization of Ag-specific BCR repertoires is
essential for understanding disease mechanisms involving humoral
immunity. A study by Ma et al (22) suggests that the mechanism of
high-frequency CDR3 generation is associated with the maturation of
IgG affinity (somatic hypermutation) during the recombinant HBV
vaccine-induced B-lymphocyte responses. In the present study, using
high-throughput sequencing, the BCR H-CDR3 region was analyzed in
the DNA from PBMCs of 3 kidney transplant patients with typical
acute rejection after kidney transplantation. The results suggested
that the diversity of the BCR repertoire in patients was the
highest at Pre1, while it was the lowest at Post1, which may be due
to the induction of immunosuppressive agents and the effect of
surgical trauma. The diversity increased again at Post7 but failed
to achieve pre-transplantation levels before acute rejection
occurred. It may be hypothesized that the number of Ig subtypes
increased in patients after kidney transplantation.
The present study comprehensively analyzed the IGHD,
IGHJ and IGHV gene family distribution and the frequency of
IGHV-IGHJ gene pairing. The results suggested that the IGHV3-22,
IGHV3-49, IGHV3/OR16-10, IGHV4-28, IGHV4-55, IGHV3-64D and
IGHV3/OR16-8 genes were lost from the IGHV gene family. In
addition, the newly formed IGHV3-72, IGHV1-69-2 and IGHV1/OR15-4
genes were expressed at low levels. Among the lost genes identified
in the present study, the IGHV gene family was also reported in
other studies. A study by Roy et al (23) revealed features of a disease- and
Ag-specific autoantibody repertoire with preferred paired H chain V
region and L chain V region usage and pairings, limited mutations,
molecular dominance and selection of particular CDR3 sequences.
According to individual gene segments of kidney transplantation
patients divided into different groups, blood group
ABO-incompatible patients with accommodation (ABOiA),
ABO-compatible stable patients (ABOcS), and ABO-incompatible
patients with biopsy-proven acute antibody-mediated rejection
(ABOiR), gene segments of IGHV3, IGKV1, IGLV2 and IGLJ3 were most
frequently used in all groups, while IGHV3-7, IGHV3-15, IGHV4-59,
IGKV3-11, IGLV1-44, IGLV2-14, IGLV4-69 and IGLV7-46 were more
frequently used in the ABOcS group than in the other groups, and
IGKV3-7 was more frequently used in the ABOiR group than in the
other groups. IGLV5-52 and IGLV7-43 were more frequently used in
the ABOiA group than in the ABOcS group (24). The BCR repertoires of systemic lupus
erythematosus patients lost a certain amount of IGHV gene usage
after high-dose glucocorticoid treatment (25). IGHV genes from the IGHV3 superfamily
encode antibodies against the D Ag (26). It is presumed that B-cell expansion
against allogeneic Ags prior to the occurrence of acute rejection
leads to the production of these abnormally expressed genes, with
highly expanded clones disrupting the diversity of the CDR3 region.
The three patients of the present study had a similar dominant
IGHV-IGHJ gene pairing (IGHJ6-IGHV3-11, IGHJ4-IGHV3-11,
IGHJ6-IGHV3-30, IGHJ4-IGHV3-30 and IGHJ6-IGHV5-51), suggesting that
the rejection in the patients may be associated with the auto-Ag
that is induced. A previous study by our group on the T-cell
repertoire following kidney transplantation determined by
high-throughput sequencing revealed that that the length of CDR3
varied from 16 to 106 nt, and the 5 most frequently observed CDR3
lengths were 42, 45, 39, 36 and 48 nt. The 5 most frequently
observed VD indel lengths were 0, 2, 3, 1 and 4 nt. The 5 most
commonly observed DJ indel lengths were 4, 0, 3, 1 and 2 nt
(10). The results of the length
distribution analysis of H-CDR3 suggested a similar length (14–18
AA) among the three patients. The length distribution at Pre1 and
Post7 tended to be consistent with a normal distribution pattern.
However, at Post1, a skewed distribution was observed. The length
distribution of CDR3 in Case 3 was stable at 12–16 AA and tended to
exhibit a normal distribution pattern. These results suggest that
the length distribution of H-CDR3 may change after kidney
transplantation, but the specific AA sites require to be
determined. Whether these observed changes in IGHV genes and IGHD
genes may serve as better markers in B-cell immunology requires
further investigation. The study by Beausang et al (27) suggested that subjects that responded
to de-sensitization therapy had pre-treatment repertoires composed
of a larger fraction of class-switched (IgG and IgA) isotypes
compared to non-responding candidates, indicating that the
measurement of B-cell repertoires may be applied to identify
candidates that respond to de-sensitization therapy. In the present
study, three patients with acute rejection after kidney
transplantation were assessed for the purpose of performing a
composition and diversity analysis of the BCR H-CDR3 repertoire.
The next step will be to assess the association of the repertoire
with clinical conditions. The study of de-sensitization therapy for
renal transplant patients is a promising field.
Due to the limited sample size of the present study,
most differences were not observed to reach statistical
significance. The small sample size is a limitation of the present
study, and therefore, more samples should be included in follow-up
studies to reach statistical significance. The association of the
variation of the BCR H-CDR3 repertoire with clinical outcomes in
kidney transplantation patients should also be explored. This may
offer potential guidance for individualized treatment with
immunosuppressive agents and contribute to the improvement of the
short- and long-term survival of kidney transplant recipients.
Traditional sequencing and cloning methods only
generate a small amount of sequence information on BCR dominant
clones; it is difficult to obtain individual BCR sequence library
information, and it is impossible to evaluate the immune status.
Using high-throughput sequencing, a large number of BCR sequences
in kidney transplant patients may be obtained from a small amount
of peripheral blood, and the BCR dominant clones as well as
quantitative indicators, including the SE and the diversity of the
BCR, may be determined. Furthermore, changes in BCR CDR3 diversity
may be observed in patients with acute rejection after renal
transplantation in order to investigate its potential clinical
application for early detection of acute rejection. In future
studies, the utility of dynamic monitoring of BCR CDR3 should be
verified by prospective analyses and comparisons. BCR CDR3
diversity helps to determine the patient's immune status following
transplantation and is instructive for applying the correct
treatment regimen.
Acknowledgements
Not applicable.
Funding
The present study was supported by the Guangxi
Natural Science Foundation (grant no. 2017GXNSFAA198185), the
National Natural Science Foundation of China (grant nos. 81671596
and 31700795), The Science and Technology Plan of Shenzhen (grant
no. JCYJ20160422164313440) and the Science and Technology Plan of
Guilin (grant no. 20170117-1).
Availability of data and materials
All data generated or analyzed during this study are
included in this published article.
Authors' contributions
LL, XZ, QY and YD conceived the study and designed
the experiments. LL, HC and WS performed the experiments. DT, JZ
and YL analyzed the data. LL, XZ and YD wrote the manuscript and
QY, YD and XZ revised it. All authors read and approved the final
version of the manuscript.
Ethics approval and consent to
participate
Informed consent was obtained from the patients. The
protocol was approved by the Ethics Committee of Guangxi Key
Laboratory of Metabolic Disease Research under the reference no.
160125-2.
Patient consent for publication
Consent was obtained from all patients prior to
publication.
Competing interests
The authors declare that they have no competing
interests.
References
|
1
|
Liyanage T, Ninomiya T, Perkovic V,
Woodward M, Stirnadel-Farrant H, Matsushita K, Iseki K, Seong HL,
Monaghan H and Jha V: Chronic kidney disease in Asia: Protocol for
a collaborative overview. Nephrology (Carlton). 22:456–462. 2017.
View Article : Google Scholar : PubMed/NCBI
|
|
2
|
Roodnat JI, Hilbrands LB, Hené RJ, de
Sévaux RG, Smak Gregoor PJ, Kal-van Gestel JA, Konijn C, van Zuilen
A, van Gelder T, Hoitsma AJ and Weimar W: 15-year follow-up of a
multicenter, randomized, calcineurin inhibitor withdrawal study in
kidney transplantation. Transplantation. 98:47–53. 2014. View Article : Google Scholar : PubMed/NCBI
|
|
3
|
Ota K: Organ transplantation-approching
the 21st century. Nihon Geka Gakkai Zasshi. 99:110–112. 1998.(In
Japanese). PubMed/NCBI
|
|
4
|
Yilmaz S: Chronic allograft nephropathy
(chronic allograft damage): Can it be avoided? Curr Transpl Rep.
1:91–99. 2014. View Article : Google Scholar
|
|
5
|
Shahbazi F, Ranjbaran M, Karamifar S,
Soori H and Manesh HJ: Graft survival rate of renal transplantation
during a period of 10 years in Iran. J Res Med Sci. 20:1046–1052.
2015. View Article : Google Scholar : PubMed/NCBI
|
|
6
|
San Segundo D, Rodrigo E, Kislikova M,
Ruiz JC, Fernandez-Fresnedo G, Asensio E, Arias M and Lopez-Hoyos
M: Frequencies of circulating B-cell subpopulations before kidney
transplantation identify patients at risk of acute rejection.
Transplant Proc. 47:54–56. 2015. View Article : Google Scholar : PubMed/NCBI
|
|
7
|
Ming M, Zhao B, Qiang L and He YY: Effect
of immunosuppressants tacrolimus and mycophenolate mofetil on the
keratinocyte UVB response. Photochem Photobiol. 91:242–247. 2015.
View Article : Google Scholar : PubMed/NCBI
|
|
8
|
Velásquez SY, Arias LF, García LF and
Alvarez CM: T cell receptor beta chain (TCR-Vbeta) repertoire of
circulating CD4(+) CD25(−), CD4(+) CD25(low) and CD4(+) CD25(high)
T cells in patients with long-term renal allograft survival.
Transpl Int. 23:54–63. 2010. View Article : Google Scholar : PubMed/NCBI
|
|
9
|
Matsutani T, Ohashi Y, Yoshioka T, Tsuruta
Y, Doi H, Satomi S and Suzuki R: Skew in T-cell receptor usage and
clonal T-cell expansion in patients with chronic rejection of
transplanted kidneys. Transplantation. 75:398–407. 2003. View Article : Google Scholar : PubMed/NCBI
|
|
10
|
Lai L, Wang L, Chen H, Zhang J, Yan Q, Ou
M, Lin H, Hou X, Chen S, Dai Y and Sui W: T cell repertoire
following kidney transplantation revealed by high-throughput
sequencing. Transpl Immunol. 39:34–45. 2016. View Article : Google Scholar : PubMed/NCBI
|
|
11
|
Zhang W, Du Y, Su Z, Wang C, Zeng X, Zhang
R, Hong X, Nie C, Wu J, Cao H, et al: IMonitor: A robust pipeline
for TCR and BCR repertoire analysis. Genetics. 201:459–472. 2015.
View Article : Google Scholar : PubMed/NCBI
|
|
12
|
Zan H and Casali P: Editorial: Epigenetics
of B cells and antibody responses. Front ImmunoL. 6:6562015.
View Article : Google Scholar : PubMed/NCBI
|
|
13
|
Bican Demir A, Erer Özbek S, Bora I,
Hakyemez B, Tırnova I and Kaya E: Two cases with developing
neurologic complications after liver transplant. Exp Clin
Transplant. 14:685–687. 2016.PubMed/NCBI
|
|
14
|
Racusen LC, Solez K, Colvin RB, Bonsib SM,
Castro MC, Cavallo T, Croker BP, Demetris AJ, Drachenberg CB, Fogo
AB, et al: The Banff 97 working classification of renal allograft
pathology. Kidney Int. 55:713–723. 1999. View Article : Google Scholar : PubMed/NCBI
|
|
15
|
Galson JD, Pollard AJ, Trück J and Kelly
DF: Studying the antibody repertoire after vaccination: Practical
applications. Trends Immunol. 35:319–331. 2014. View Article : Google Scholar : PubMed/NCBI
|
|
16
|
Pickman Y, Dunn-walters D and Mehr R: BCR
CDR3 length distributions differ between blood and spleen and
between old and young patients, and TCR distributions can be used
to detect myelodysplastic syndrome. Phys Biol. 10:0560012013.
View Article : Google Scholar : PubMed/NCBI
|
|
17
|
Wang Z, Yang H, Liu X, Zhang J, Han Z, Tao
J, Zhao C, Ju X, Tan R and Gu M: Role of B and T lymphocyte
attenuator in renal transplant recipients with biopsy-proven acute
rejection. Med Sci Monit. 24:387–396. 2018. View Article : Google Scholar : PubMed/NCBI
|
|
18
|
Gibson KL, Wu YC, Barnett Y, Duggan O,
Vaughan R, Kondeatis E, Nilsson BO, Wikby A, Kipling D and
Dunn-Walters DK: B-cell diversity decreases in old age and is
correlated with poor health status. Aging Cell. 8:18–25. 2009.
View Article : Google Scholar : PubMed/NCBI
|
|
19
|
Lee YN, Frugoni F, Dobbs K, Tirosh I, Du
L, Ververs FA, Ru H, Ott de Bruin L, Adeli M, Bleesing JH, et al:
Characterization of T and B cell repertoire diversity in patients
with RAG deficiency. Sci Immunol. 1:eaah61092016. View Article : Google Scholar : PubMed/NCBI
|
|
20
|
Berthelot JM, Jamin C, Amrouche K, Le Goff
B, Maugars Y and Youinou P: Regulatory B cells play a key role in
immune system balance. Joint Bone Spine. 80:18–22. 2013. View Article : Google Scholar : PubMed/NCBI
|
|
21
|
Newell KA, Asare A, Kirk AD, Gisler TD,
Bourcier K, Suthanthiran M, Burlingham WJ, Marks WH, Sanz I,
Lechler RI, et al: Identification of a B cell signature associated
with renal transplant tolerance in humans. J Clin Invest.
120:1836–1847. 2010. View
Article : Google Scholar : PubMed/NCBI
|
|
22
|
Ma L, Wang X, Bi X, Yang J, Shi B, He X,
Ma R, Ma Q and Yao X: Characteristics peripheral blood IgG and IgM
heavy chain complementarity determining region 3 repertoire before
and after immunization with recombinant HBV vaccine. PLoS One.
12:e1704792017.
|
|
23
|
Roy B, Neumann RS, Snir O, Iversen R,
Sandve GK, Lundin KEA and Sollid LM: High-throughput single-cell
analysis of B cell receptor usage among autoantigen-specific plasma
cells in celiac disease. J Immunol. 199:782–791. 2017. View Article : Google Scholar : PubMed/NCBI
|
|
24
|
Jeon HJ, Fang T, Lee JG, Jang JY, Kim K,
Choi S, Yan JJ, Ryu JH, Koo TY, Ahn C and Yang J: VDJ gene usage of
B cell receptors in peripheral blood of ABO-incompatible kidney
transplantation patients. Transplant Proc. 50:1056–1062. 2018.
View Article : Google Scholar : PubMed/NCBI
|
|
25
|
Shi B, Yu J, Ma L, Ma Q, Liu C, Sun S, Ma
R and Yao X: Short-term assessment of BCR repertoires of SLE
patients after high dose glucocorticoid therapy with
high-throughput sequencing. Springerplus. 5:752016. View Article : Google Scholar : PubMed/NCBI
|
|
26
|
Dohmen SE, Muit J, Ligthart PC, Verhagen
OJ and van der Schoot CE: Anti-e found in a case of hemolytic
disease of the fetus and newborn make use of the IGHV3 superspecies
genes. Transfusion. 48:194–195. 2008. View Article : Google Scholar : PubMed/NCBI
|
|
27
|
Beausang JF, Fan HC, Sit R, Hutchins MU,
Jirage K, Curtis R, Hutchins E, Quake SR and Yabu JM: B cell
repertoires in HLA-sensitized kidney transplant candidates
undergoing desensitization therapy. J Transl Med. 15:92017.
View Article : Google Scholar : PubMed/NCBI
|