Introduction
A ketogenic diet (KD) consists of low carbohydrate,
high fat and adequate protein. This diet was designed to simulate
the biochemical effects of fasting, which is used for the treatment
of drug-refractory seizures (1,2). By
limiting the intake of carbohydrates, it forces the body to switch
to fatty acid oxidation as an energy source, leading to a ketogenic
state. This KD guarantees sufficient calories for normal activity
produced through ketogenesis, which occurs principally in the
mitochondrial matrix of the liver (3,4). While
KD is a classic therapy for refractory epilepsy, recent animal
studies have demonstrated that it is also effective in the
treatment of other neurodegenerative diseases, including
Parkinson's disease, amyotrophic lateral sclerosis, Alzheimer's
disease and traumatic brain injury (5–10).
Although KD has been used as a dietary regimen for
managing pediatric refractory epilepsy over the past decades, its
side effects remain controversial. Clinical trials have suggested
that KD is safe and efficient (11,12);
however, it also resulted in a progressive loss of bone mineral
content in pediatric patients, particularly in those with a low
body mass index (BMI) (13). A
previous study by our group confirmed that KD resulted in a
significant bone loss in the tibia and reduced mechanical function
in the femur of mice (14); such
side effects in cancellous-rich bones, e.g. the vertebrae, are
worthy of further investigation. In addition, the association
between bone loss and mechanical reduction under KD requires
clarification.
Clinically, osteoporosis is associated with a
reduced bone mineral density (BMD) and micro-architectural changes,
resulting in diminished bone strength and an increased risk of
fractures (15,16). Osteoporosis-associated fractures may
lead to substantial long-term disability and decreased quality of
life (17). Thus, it is necessary to
identify the osteoporosis-inducing effects of KD in various parts
of the skeleton, including reduced mechanical function of vertebral
bones. Micro-finite element (FE), based on the 3-dimensional (3D)
bone microarchitecture with high-resolution peripheral quantitative
computed tomography (CT), is used to examine age-associated changes
(18), effects of disease (19) and outcomes of various treatments on
the bone microstructure (20).
Analysis of bone mechanical performance using a micro-CT-based FE
model, and correlation with microstructural changes and reduced
mechanics of bones under a KD is essential.
The present study aimed to investigate the effects
of a long-term KD on the microarchitecture of appendicular and
axial bones, and the compressive stiffness and failure load based
on micro-FE analysis in a rat model. The secondary objective was to
assess the possible correlation between the microstructural changes
and the mechanical properties of appendicular and axial bones.
Materials and methods
Animal model
A total of 14 male 6-week-old Sprague-Dawley rats
(180–200 g; Laboratory Animal Center of Southern Medical University
Guangzhou, China) were purchased prior to the 2 weeks of adaptive
feeding with a standard diet, then all rats were randomly divided
into a control and a KD group (n=7 per group). All rats were housed
individually in hanging wire cages in an animal facility with the
room temperature maintained at 22±1°C, humidity maintained at
60–70% and under a 12-h light/dark cycle. Rats in the control group
were fed a standard diet (provided by the Laboratory Animal Center
of Southern Medical University), while rats in the KD group
received a KD (Jielikang, Shenzhen, China) containing a 3.1:1 ratio
of fat to carbohydrate and protein, and the remaining nutrients met
the AIN-93 criterion (18). The
specific composition of the two diets is provided in Table I. All rats had ad libitum
access to tap water and their designated diet throughout the 12
weeks of the study.
 | Table I.Comparison of basic nutrient content
between the standard and the ketogenic diet (per 100 g). |
Table I.
Comparison of basic nutrient content
between the standard and the ketogenic diet (per 100 g).
| Component/item | Standard diet | Ketogenic
dieta |
|---|
| Energy (kJ) | 1,338 | 2,804 |
| Protein (g) | 14.5 | 18.2 |
| Fat (g) | 4 | 65.1 |
| Carbohydrates
(g) | 55.5 | 2.7 |
| Dietary fibers
(g) | 4.5 | 7.4 |
| Calcium (mg) | 720 | 500 |
| Phosphorus
(mg) | 600 | 300 |
| Vitamin D (µg) | 2.5 | 2.5 |
Measurement of body weight, and blood
ketone and glucose levels
Rats were weighed every 2 weeks. Blood samples (0.1
ml each time) were obtained from the caudal vein biweekly, and were
used to determine blood glucose and blood ketone levels. The
Yicheng Blood Ketone Meter T-1 (Sentest, Inc., Beijing, China) and
a Medisense Precision Xtra monitor (Abbott Pharmaceutical Co.,
Ltd., Lake Bluff, IL, USA) were used to measure blood
β-hydroxybutyrate ketone concentrations, and the JPS-5 monitor
(Leapon, Inc., Beijing, China) was used to determine blood glucose
levels.
Measurement of total (T)BMD by dual
energy X-ray absorptiometry (DEXA)
Prior to the imaging examination and decapitation,
all rats were fasted for 6 h (to standardize gastrointestinal
filling). Following anesthesia with 0.3% pentobarbital (30 mg/kg),
rats were fixed face-down on the testing bed. The TBMD was analyzed
with DEXA (GE-Lunar iDXA; GE Healthcare, Little Chalfont, UK).
Specimen preparation
Following anesthesia by intraperitoneal injection of
0.3% pentobarbital (30 mg/kg), blood samples were obtained from the
inferior vena cava and stored at 4°C overnight. The next morning,
blood samples were centrifuged at 2,000 × g for 12 min at 4°C, and
serum from the supernatant was collected and stored at −80°C.
Humerus, tibia and L4 lumbar vertebra samples were
fixed in 4% paraformaldehyde for 24 h after removal of soft tissues
and then stored in 75% ethanol for subsequent measurements. In
addition, the full length of the tibiae, femurs and humeri were
measured with a vernier caliper.
Serum analysis
All serum samples were processed as previously
described. Circulating concentrations of calcium and phosphate
levels (Beckman Coulter, Inc., Brea, CA, USA), and total 25-hydroxy
vitamin D (25- (OH)-VD) and 25-dihydroxy vitamin D3
[1,25-(OH)2-D3; activated metabolite of 25-
(OH)-VD] contents were measured using commercially available kits
[25-(OH)-VD: Cat. no. 10699533; Siemens AG, Munich, Germany;
1,25-(OH)2-D3: cat. no. ml028285; Mlbio,
Shanghai, China] according to the manufacturer's instructions.
Micro-CT scan
The bone samples were scanned using a
high-resolution micro-CT system (µCT 80; Scanco Medical AG,
Brüttisellen, Switzerland) with an isotropic voxel size of 12 µm
(55 kv; 145 µA; integration time, 300 msec; average number of
readings, 2). The TBMD, bone volume fraction (BV/TV), trabecular
thickness (Tb.Th), trabecular number (Tb.N) and trabecular
separation (Tb.Sp) were measured for the cancellous bone, whereas
the total cross-sectional area inside the periosteal envelope
(Tarea), bone area (Barea) and cortical thickness (Ct.Th) were
measured for the cortical bone. The scanned and analyzed area of
humeri and tibiae was a 2.0-mm rectangular region below the
epiphyseal line, and the scanned area of the L4 vertebral body was
in the middle third region.
FE analysis
FE software is an addition to the Image Processing
Language software (version 1.13; Scanco Medical AG, Brüttisellen,
Switzerland) for image modification and enhancement. The software
uses a set of functions that enable FE analysis of structures as
represented by 3D micro-CT images.
The simulations were performed within the framework
of linear elasticity. The elastic material properties were
homogeneous (no distinction between cortical and trabecular bone)
and isotropic, with a Poisson's ratio of ν=0.3 and Young's modulus
of material=10,000 MPa. A ‘high-friction compression test in the
z-direction’ was selected for the simulation of the compression.
The simulation produced the compressive stiffness and failure load
of bones.
Statistical analysis
Measurement data are expressed as the mean ±
standard deviation. Two-way repeated-measures analysis of variance
was used to analyze the body weight, blood ketone levels and
glucose levels, while an independent-samples t-test was selected to
compare other parameters between the two dietary groups. The
Bivariate Correlations model was used to determine the Pearson
correlation coefficients of microstructure and biomechanical
parameters. Linear regression was used to analyze the correlation
coefficients and significance of two combined microstructure and
biomechanical parameters. P<0.05 was considered to indicate a
statistically significant difference.
Results
Body weight, blood ketone and glucose
levels
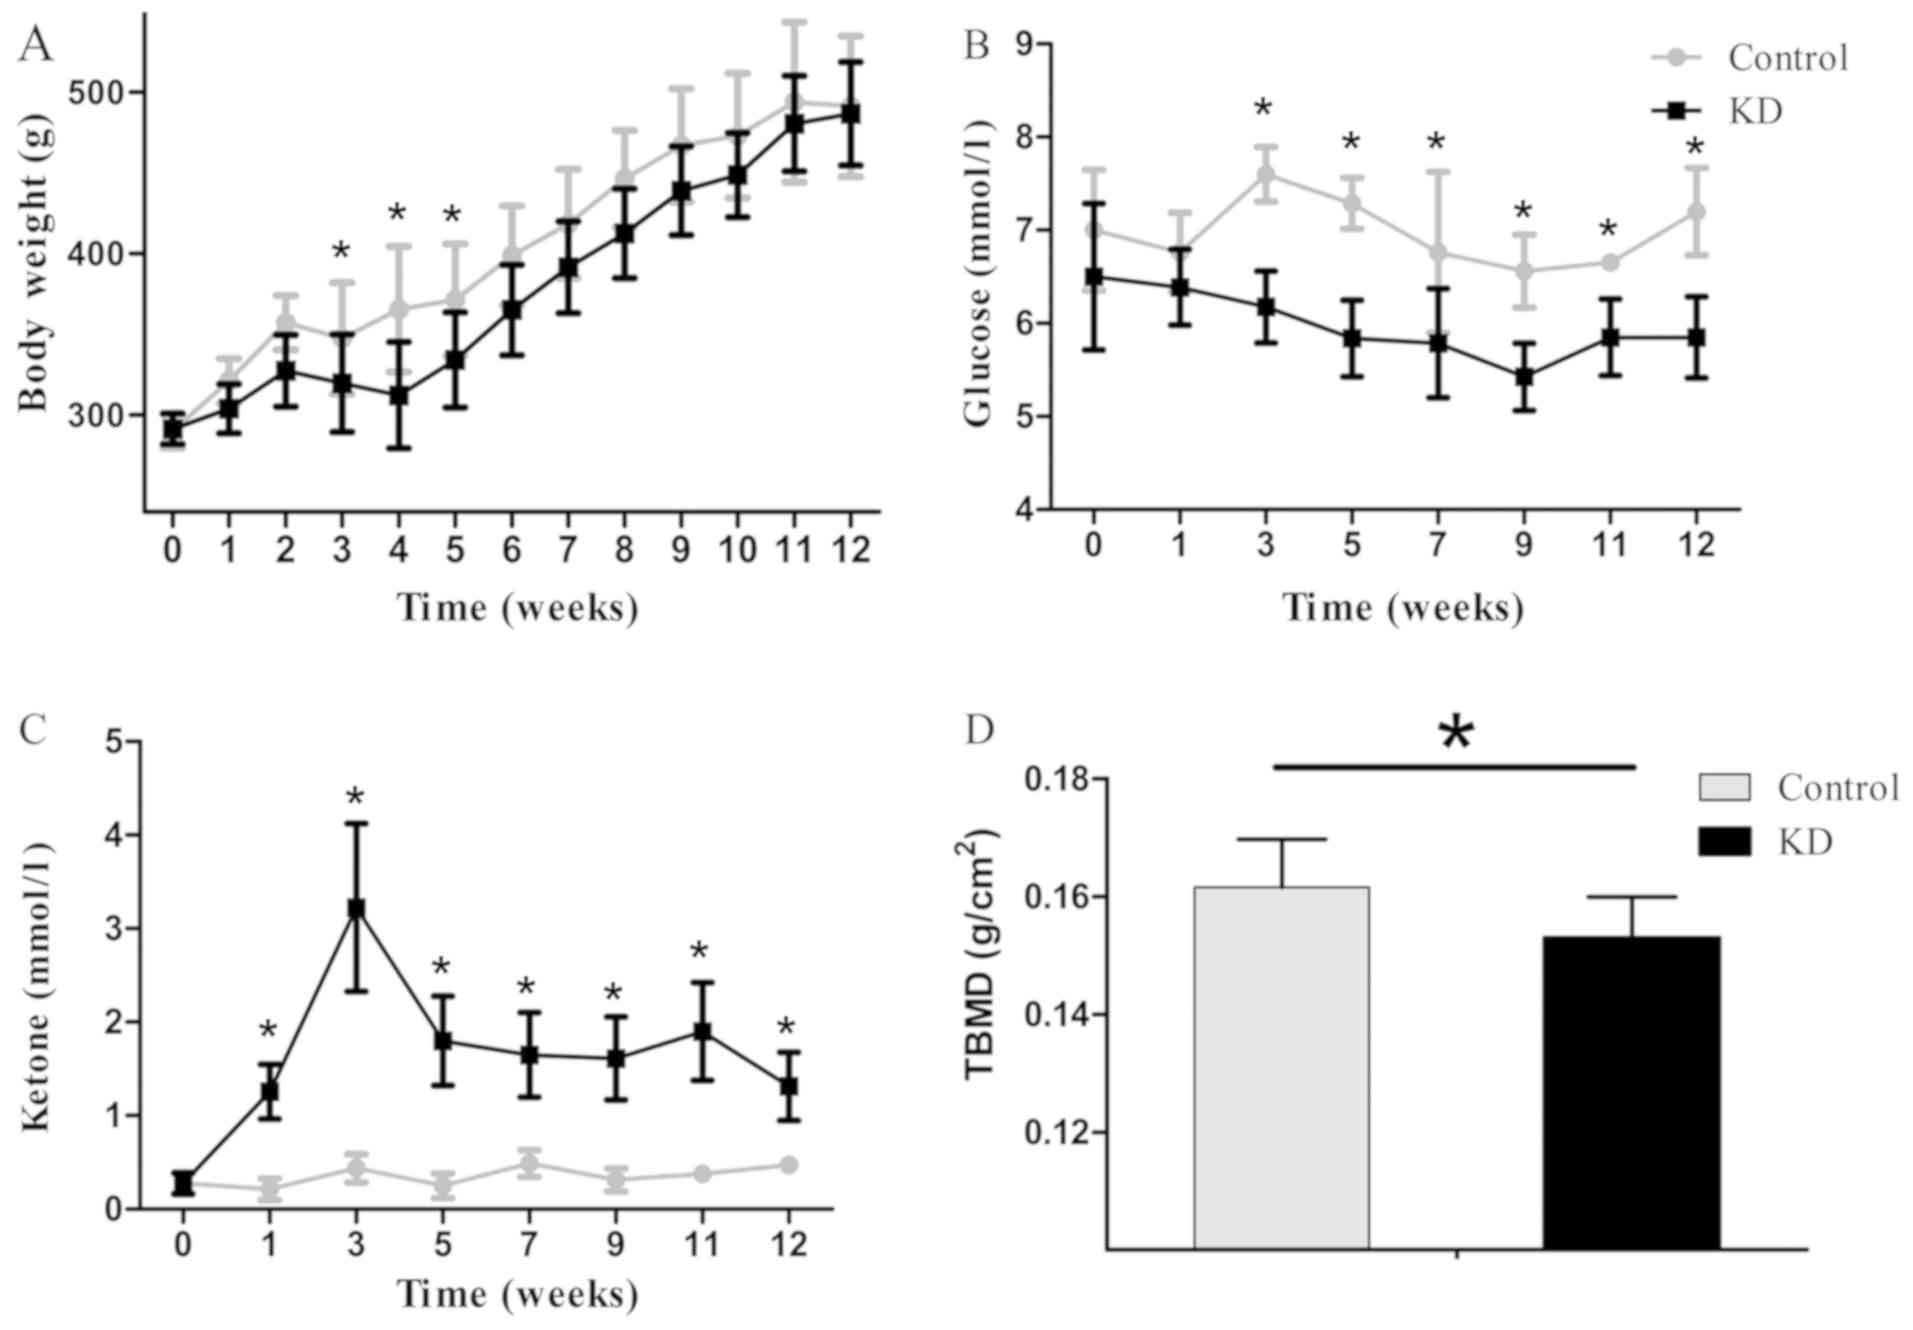
All rats gained weight consistently throughout the
experimental period, with the initial body weight ranging from
280–300 g (control, 290.4±10.6 g; KD, 291.4±9.4 g; P=0.845). The KD
group exhibited a significantly slower body weight increase
compared with that in the control group throughout the experiment,
and a significant difference in body weight growth was observed
(control, 491.1±43.6 g; KD, 486.5±32.0 g; P=0.038; Fig. 1A), while the differences were
significant only at week 3, 4 and 5.
The average ketone levels in the two groups were 0.4
and 1.6 mmol/l in the control and KD group, respectively. The KD
group reached a peak ketone level within the first 3 weeks, and the
ketone levels were significantly higher level than those in the
control group at each time points since week 1 (P<0.01).
However, the blood glucose levels were 7.0 mmol/l on average in the
control group, which were significantly higher than those in the KD
group (6.0 mmol/l on average; P<0.01; Fig. 1), and the different were also
significant at each time points since week 3 (P<0.05). The TBMD
was 0.153±0.007 g/cm2 in the KD group, which was
significantly lower than that in the control group (0.162±0.008
g/cm2; P=0.034).
Bone length
The length of the tibiae was 45.27±1.60 and
45.00±1.35 mm in the control and KD group, respectively (data not
shown). The length of femurs was 41.31±2.01 and 41.00±0.68 mm, and
the length of humeri was 31.36±1.15 and 31.09±1.19 mm in the
control and KD group, respectively (data not shown). There was no
significant difference in the bone length between the two groups
(data not shown).
Concentration of calcium, phosphorus
and vitamin D in serum
The calcium concentration was 2.52±0.06 and
2.51±0.09 mmol/l in the control and KD group, respectively, and the
phosphorus concentration was 2.30±0.21 mmol/l in the control group
and 2.33±0.24 mmol/l in the KD group (data not shown). There was no
significant difference in the calcium and phosphorus concentration
between the two groups (data not shown). Regarding the effect of
the KD on vitamin D, the level of total 25-OH-VD (control, 36.0±3.5
ng/ml; and KD, 35.0±2.6 ng/ml) and active vitamin D,
1,25-(OH)2-D3 (control, 33.2±3.8 ng/ml; and
KD, 35.7±3.6 ng/ml) exhibited no significant difference between the
two groups (data not shown).
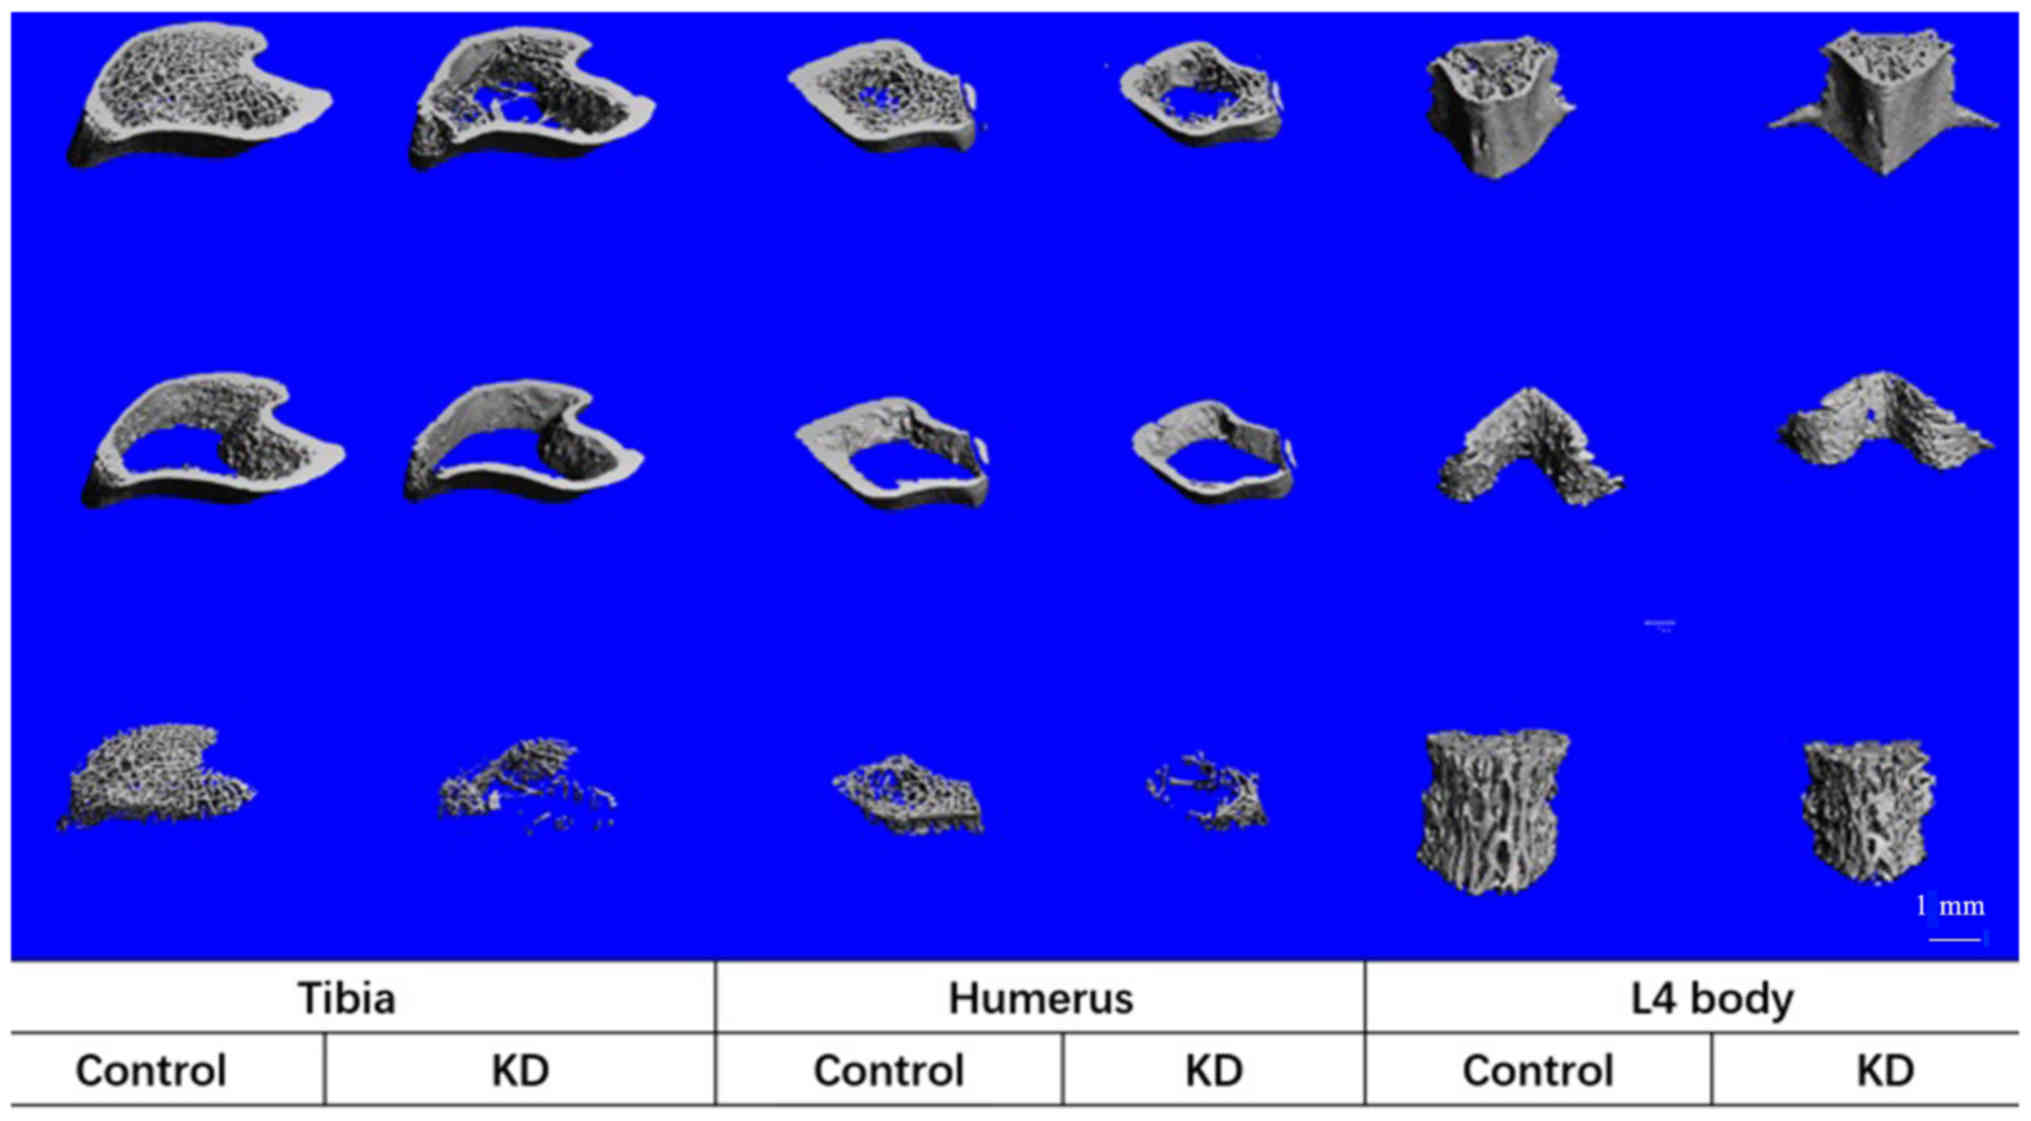
Effects of KD on cancellous bones
The KD group exhibited a decreased TBMD, BV/TV and
Tb.N, and an increased Tb.Sp compared with that in the control
group. In addition, trabecular thickness in the cancellous bone did
not change between the groups, indicating that the trabecular
structure became sparse following KD intervention (Table II; Figs.
2 and 3). These microstructural
parameters were significantly changed in the tibiae and humeri of
rats receiving the KD, whereas there were no significant
differences in the L4 vertebral body samples between the groups
(Table II; Figs. 2 and 3).
| Table II.Micro-computed tomography analysis of
cortical and cancellous bone of the proximal tibia, proximal
humerus and middle of the L4 vertebrae at 12 weeks. |
Table II.
Micro-computed tomography analysis of
cortical and cancellous bone of the proximal tibia, proximal
humerus and middle of the L4 vertebrae at 12 weeks.
| A, Cancellous
bone |
|---|
|
|---|
|
| Tibia | Humerus | Vertebrae |
|---|
|
|
|
|
|
|---|
| Parameter | KD (n=6) | Control (n=6) | KD (n=6) | Control (n=6) | KD (n=4) | Control (n=4) |
|---|
| BMD (mg/cm) | 27.4±4.4 |
144.0±68.0a | 89.4±16.6 |
162.0±37.1a | 201.0±86.8 | 285.0±42.3 |
| BV/TV | 0.049±0.006 |
0.191±0.081a | 0.135±0.027 |
0.206±0.047a | 0.258±0.110 | 0.359±0.050 |
| Tb.N (mm) | 1.04±0.14 |
2.65±0.85a | 1.16±0.15 |
2.34±0.75a | 2.57±0.76 | 3.33±0.21 |
| Tb.Sp (mm) | 0.99±0.15 |
0.40±0.16a | 0.92±0.13 |
0.48±0.17a | 0.40±0.15 | 0.26±0.02 |
| Tb.Th (mm) | 0.08±0.01 | 0.09±0.01 | 0.08±0.01 | 0.08±0.01 | 0.10±0.01 | 0.11±0.01 |
|
| B, Cortical
bone |
|
|
| Tibia | Humerus |
Vertebrae |
|
|
Parameter | KD
(n=6) | Control
(n=6) | KD
(n=6) | Control | KD
(n=6) | Control
(n=6) |
|
| Tarea
(mm2) | 6.01±0.89 |
7.96±0.44a | 3.96±0.25 |
5.04±0.40a | 2.61±0.21 | 2.86±0.29 |
| Barea
(mm2) | 5.60±0.863 |
7.49±0.39a | 3.47±0.196 |
4.37±0.155a | 2.31±0.18 | 2.58±0.26 |
| Ct.Th (mm) | 0.281±0.045 |
0.355±0.027a | 0.228±0.013 | 0.258±0.032 | 0.198±0.01 | 0.259±0.02 |
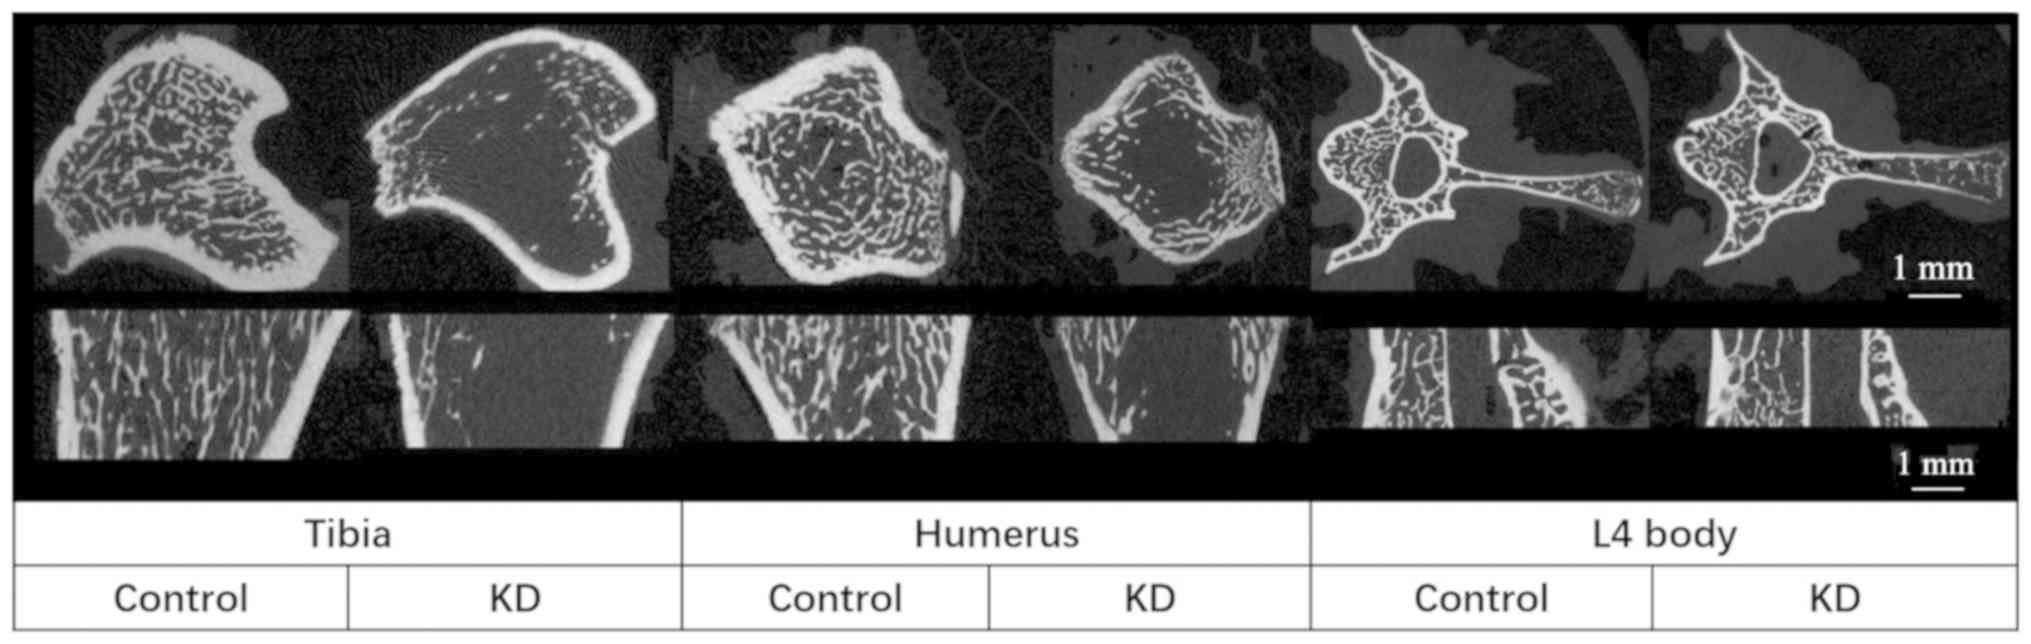
Cortical bones
The Tarea and Barea were significantly decreased in
the KD group (~20 and ~25% in the tibia and humerus, respectively)
compared with those in the control group, whereas only a 10%
decrease was obtained in the L4 vertebral body in the KD group, and
there was no significant difference compared with the control group
(Table II; Figs. 3 and 4). The only significant decrease in the
Ct.Th was in the tibiae of rats from the KD group; while the
largest decrease in Ct.Th was in the L4 vertebral body of KD group
vs. control group rats (23%), this decrease was not significant
(Table II; Figs. 2 and 3).
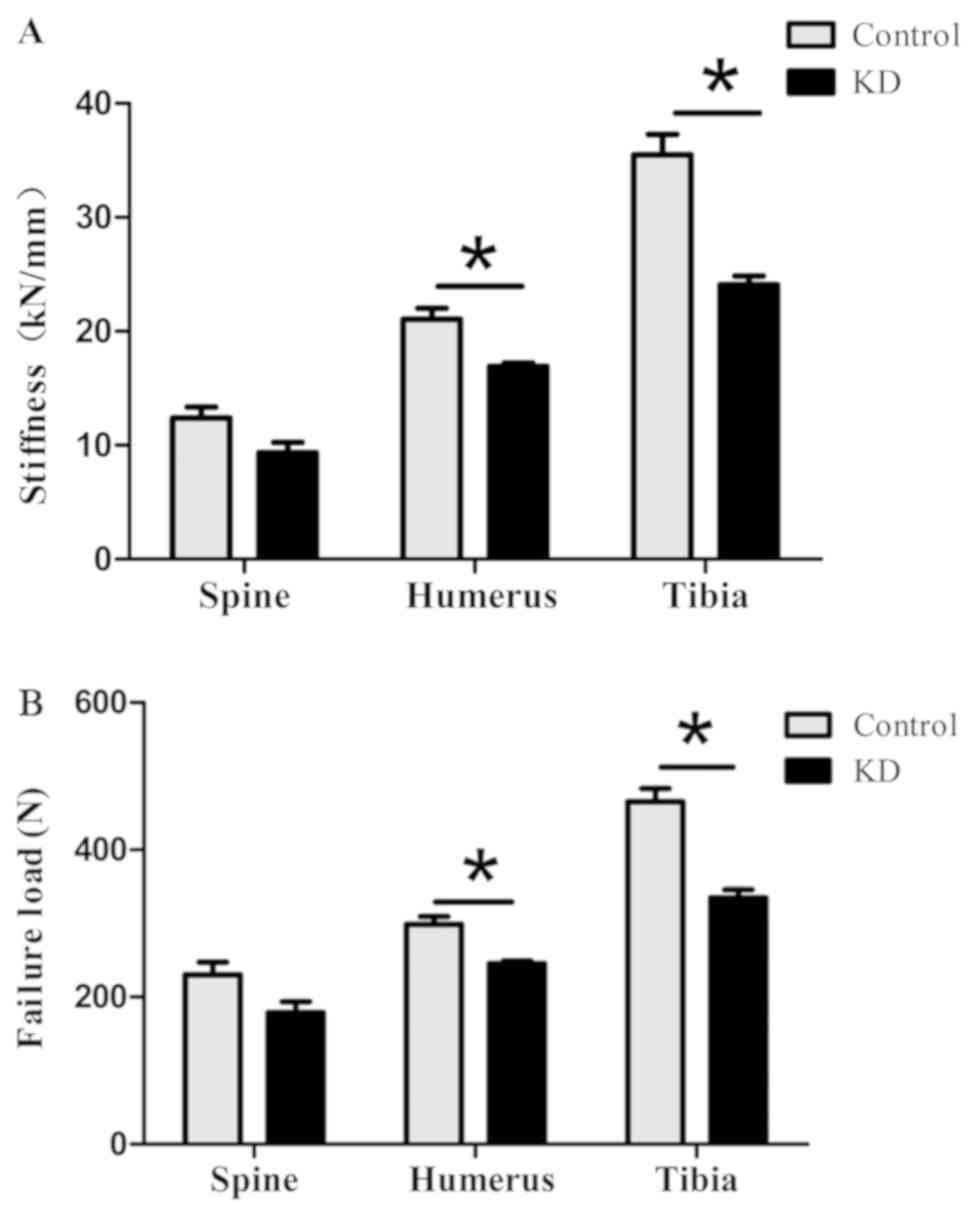
Micro-FE analysis
The compressive strength and stiffness of the tibiae
in the KD group were 0.323±0.040 kN and 23.1±3.0 kN/mm,
respectively, which were significantly lower than those in the
control group (0.458±0.044 kN and 35.0±4.2 kN/mm, respectively).
The compressive strength and stiffness of humeri were significantly
decreased from 0.293±0.035 N and 20.6±2.9 kN/mm in the control
group to 0.247±0.010 kN and 17.0±0.8 kN/mm in the KD group,
respectively. Although the compressive strength and stiffness of
the L4 vertebral body decreased to 0.178±0.030 kN (77%) and 9.4±1.8
kN/mm (75%) in the KD group, respectively, they were not
significantly different from those in the control group (Fig. 4).
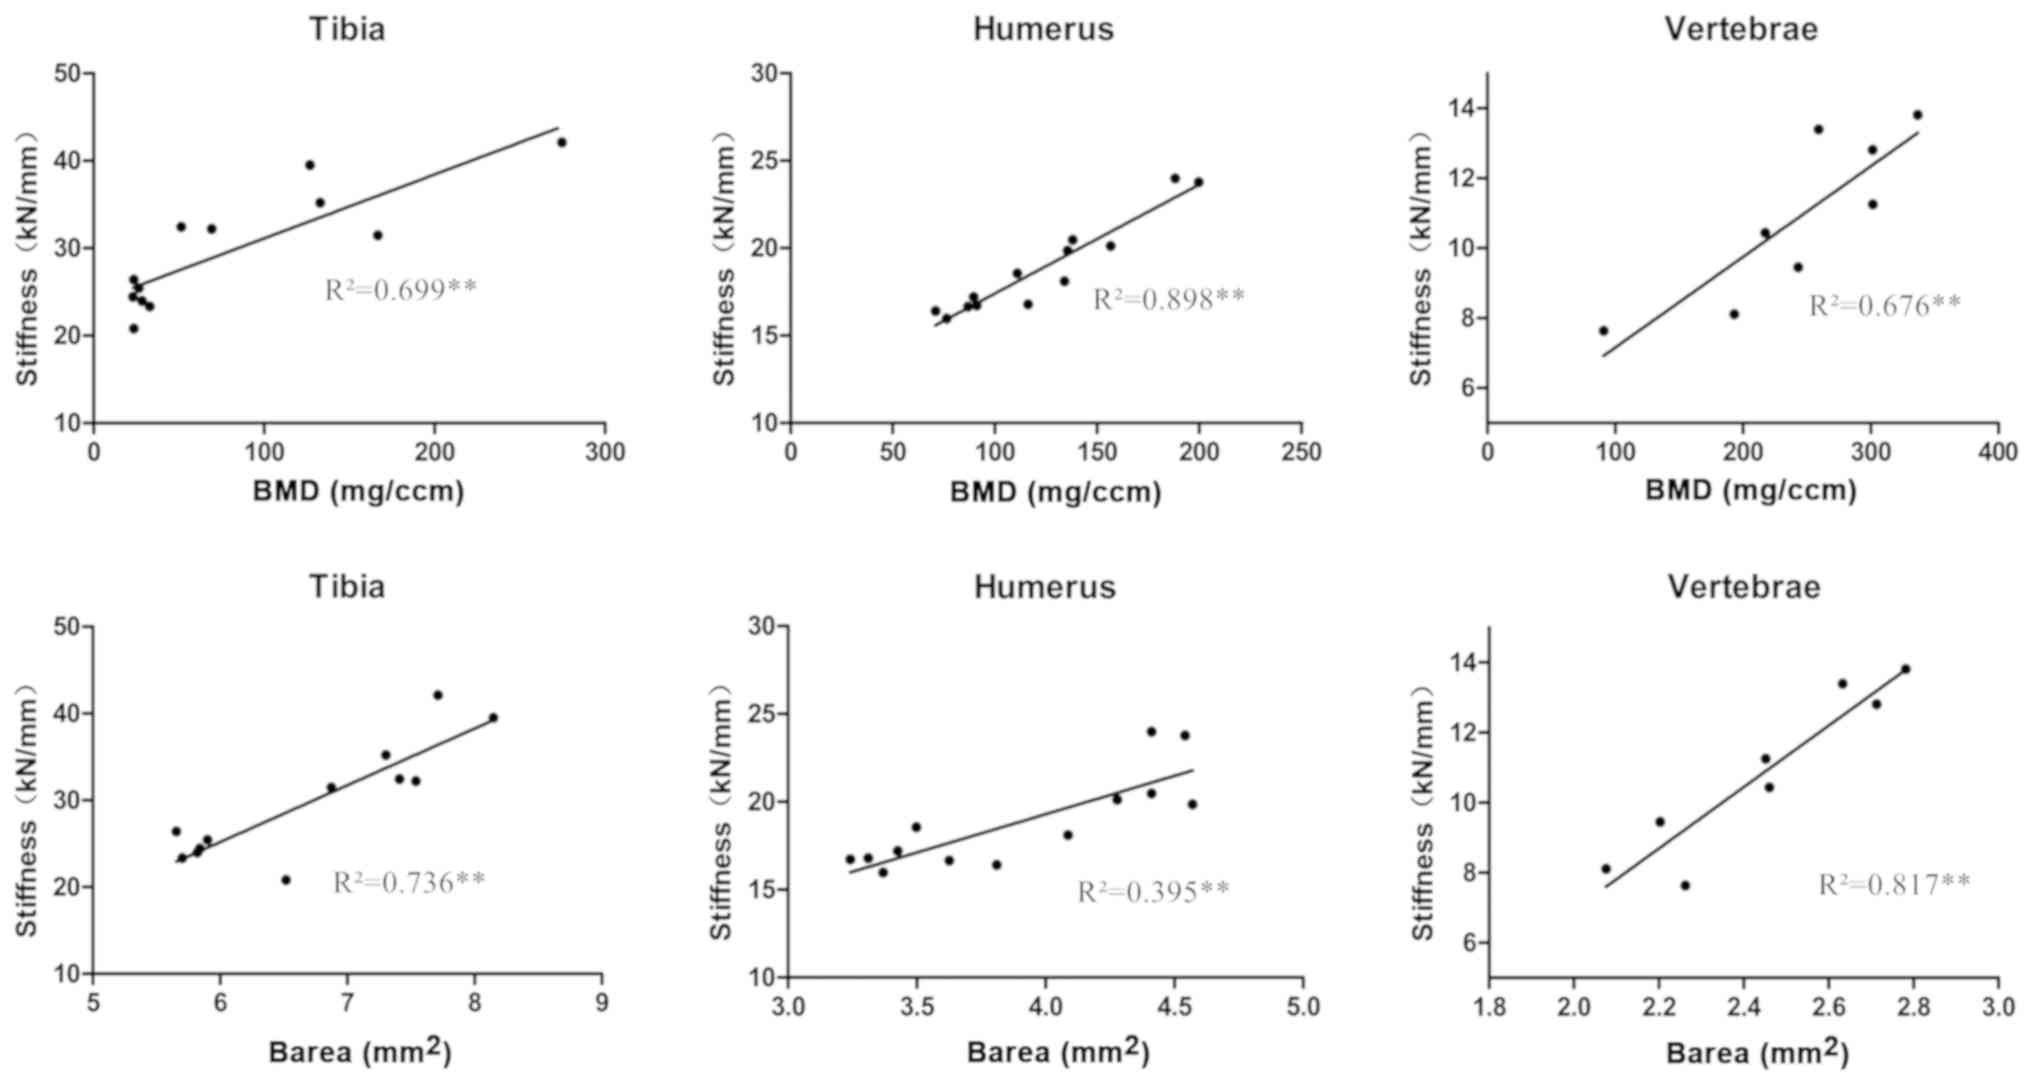
Correlation between microstructure and
biomechanical parameters
Among the measured microstructural parameters, the
BMD in the cancellous bone and the Barea in the cortical bone were
correlated with the compressive stiffness and strength in all three
bone types analyzed (Fig. 5). The
combination of BMD and Barea achieved a greater correlation with
the compressive stiffness (tibia, R2=0.858; humerus,
R2=0.893; and L4 vertebrae, R2=0.913) and the
compressive failure load (tibia, R2=0.813; humerus,
R2=0.910; and L4 vertebrae, R2=0.875)
compared with the BMD and Barea correlations alone (Table III).
| Table III.Correlation coefficients between
microstructure parameters and biomechanics parameters. |
Table III.
Correlation coefficients between
microstructure parameters and biomechanics parameters.
| Parameter | BMD | Barea | Combination |
|---|
| Stiffness |
|
|
|
|
Tibia | 0.699a | 0.736a | 0.858a |
|
Humerus | 0.898a | 0.395b | 0.893a |
|
Vertebrae | 0.676a | 0.817a | 0.913a |
| Failure load |
|
|
|
|
Tibia | 0.636a | 0.725a | 0.813a |
|
Humerus | 0.898a | 0.473a | 0.910a |
|
Vertebrae | 0.633a | 0.802a | 0.875a |
Discussion
The present study demonstrated a significant
decrease in the TBMD of rats fed KD for 12 weeks, with no
difference in the serum calcium and phosphate concentration between
the KD and control groups. Specifically, by scanning appendicular
bones of the extremities (humerus and tibia) and L4 vertebra using
micro-CT, it was observed that KD led to bone loss in cancellous
and cortical bones, with insignificant changes in L4 vertebral
bone. Furthermore, simulated compressive analysis using micro-FE
analysis revealed that the compressive stiffness and strength of
appendicular and axial bones were decreased under the KD, and were
highly correlated with the microstructural parameters of cancellous
and cortical bones.
The effects of KD bone loss in humans remain
inconclusive. A previous study has indicated that maintaining a
long-term KD did not cause any major negative effects on the bone
mineral content and BMD in adults with glucose transporter-1
deficiency syndrome (21). The
present study, which only included an animal experiment with a
small sample, does not allow for any conclusions regarding the
safety of KDs, and the results may not be comparable with previous
studies focusing on children with intractable epilepsy treated with
KD (13,22). However, the present study on a
ketogenic rat model may enhance the understanding of bone loss due
to KD, suggesting that this topic is worthy of further
investigation.
Ketogenic animal models are typically established by
feeding KD or by β-hydroxybutyrate administration (23,24);
however, to the best of our knowledge, there is currently no
unified ketogenic animal model. A previous study by Wu et al
(14) has indicated that KD caused
bone loss in mouse tibia, but the blood ketone levels in the KD
group were only ~1.0 mmol/l. In the present study, elevated blood
ketone levels (~2.0 mmol/l) were achieved with a customized KD
(24,25), which indicated that the ketogenic
model was efficient. In addition, the present study investigated
the bone loss in L4 vertebra and humerus, providing a comprehensive
overview of the bone loss in rats under the KD.
Body weight changes may be the first factor
associated with bone loss under KD. In the clinic, KD is effective
in suppressing the appetite, reducing lipogenesis and increasing
lipolysis (26,27), and also results in weight loss
(28). A low body weight or BMI is a
well-documented risk factor for fracture, and a body weight
increase is considered a protective factor against osteoporosis, as
mechanical loading and the associated hypertrophy of muscles
increases the bone mass (29). Thus,
theoretically, rats with low body weight have a lower bone mass,
which is in accordance with the results of the present study.
Furthermore, previous studies have reported that
chronic ketoacidosis led to an increase in bone minerals to
maintain the buffering capacity and decrease renal conversion of
25-(OH)-VD to 1,25-(OH)2-VD3 (30). Low 25-(OH)-VD levels, particularly
those <20 ng/ml, were associated with an elevated fracture risk
in women aged ≥50 years during a 15-year follow-up period (31). However, in the present study, the
levels of serum calcium and phosphorus in the KD group were similar
to those in the standard diet group; this trend was also observed
in the total vitamin D and active vitamin D levels, which implied
that neither the bone mineral content nor the conversion of vitamin
D is a key factor for the bone loss under the KD.
The present study used DEXA to evaluate the TBMD as
a primary endpoint in rats fed with the KD. DEXA is the gold
standard for the diagnosis of osteoporosis, and the T-score is
highly correlated with the fracture risk (32). While the present results indicated an
obvious decrease in the TBMD in the KD group, the bone loss within
certain specific bones required further evaluation. In order to
determine microstructural changes of different bones in detail,
micro-CT analysis was performed on the bones of the upper limbs,
lower limbs and axial skeleton.
KD led to cancellous and cortical bone loss in the
tibia and humerus, which was consistent with findings of tibia bone
loss in a previous study by our group (14). A previous study by our group
demonstrated that KD specifically caused cortical bone loss of
tibiae in mice when compared with ovariectomized mice (14). The present study also investigated
the bone loss in middle of L4 vertebra and the humerus, providing a
comprehensive overview of the bone loss under KD. Furthermore, the
present study revealed that the most severe trabecular bone loss
and structural deterioration occurred in the metaphyseal area of
the tibia, and was sensitive to the location selected. By contrast,
similar cortical bone loss occurred in the tibia and humerus, while
a lesser decrease was apparent in appendicular bones. In spite of
greater microstructural changes in cancellous bone of L4 vertebral
bodies in the KD group, the present study failed to detect
significant changes, potentially due to the small sample size.
However, the thickness of trabecular bone remained unchanged
between the KD rats and the control group, which indicated a
decrease in trabecular bone density associated with the bone
loss.
The present study further verified the biomechanical
changes under the KD, and a correlation between the bone
morphological changes with the bone function was identified.
Previous studies have estimated bone strength using high-resolution
peripheral quantitative CT and the FE method, and provided
important insight into fracture risk in patients (33,34). The
present study used a micro-FE model based on the micro-CT images,
and evaluated the compressive stiffness and strength of
appendicular and axial bones under the KD. The micro-FE analysis is
suitable in cases where the sample size is small and the region of
interest unavailable for actual mechanical tests. A significant
decrease in biomechanical performance of appendicular bones was
detected by micro-FE analysis. The non-significant decrease in
compressive stiffness and strength of L4 vertebrae in KD group was
potentially due to the small sample size (n=4). These biomechanical
features were consistent with the microstructural changes of the
appendicular and axial bones under KD. The results of the present
study suggest that KD therapy for ~12 weeks increases the risk of
fracture.
Mechanical properties may be correlated with
microstructural parameters; however, the correlation coefficient
between the compressive stiffness and a single microstructural
parameter was dissatisfactory in the present study. BMD, as the
gold standard for evaluating bone strength, is associated with bulk
modulus through a power law association in bone (cm scale). By
contrast, the association is weak at the tissue level (µm-mm
scale), likely due to the effect of microstructural features at
small-length scales (35). In
vitro studies have demonstrated that the combination of the
trabecular microarchitecture and BMD improved the prediction of
trabecular bone mechanical behavior and vertebral strength
(36,37). In the present study, the combination
of the BMD of trabecular bone with the Barea of cortical bone
produced a satisfactory prediction of bone mechanical properties,
with the adjusted R2 ranging from 0.81 to 0.91.
The effects of diet on bone microstructure may be
achieved by reduced mineral absorption or increased bone turnover.
The present study confirmed that KD did not affect mineral
absorption, suggesting that the KD affected the bone metabolism. In
the present study, the KD successfully converted glycometabolism to
ketone body metabolism, as ketone levels were high and blood
glucose levels were low (38).
Although no increase in bone turnover induced by a low-carbohydrate
diet was observed in humans (39),
our previous studies have confirmed that KD and ovariectomy
resulted in a similar promotion of bone absorption via activation
of osteoclasts, rather than inhibition of bone formation mediated
by osteoblasts (14). In addition,
certain studies have reported that ketone bodies are important
endogenous factors that may regulate bone metabolism under
physiological and pathological conditions, as the ketone bodies
modulate osteoblast functions bi-directionally (40).
The effects of KD on bone loss have been rarely
reported (14,22). The present study demonstrated more
general bone loss under a KD for the first time, to the best of our
knowledge, and evaluated the mechanical performance using a
micro-FE model. These results establish a link between the
microstructure and the function of bones. However, the dynamical
changes in bone microstructure should also be evaluated at multiple
time-points. For instance, the dynamic changes in bone
microstructure and the effects of KD on cortical bone may be
evaluated using in vivo micro-CT (41). In addition, the molecular mechanisms
of bone loss caused by KD, which is expected to differ from the
effects of a high-fat diet, was not determined in the present
study; the effect of a KD on bone metabolism has been assessed by a
previous study (40), but it should
be further elucidated in the future.
In conclusion, the present study demonstrated that a
KD led to bone loss and biomechanical reduction in appendicular
bones, with a lesser impact on axial bones. Thickness was reduced
in the cortical bone, and trabecular density was decreased in the
cancellous bone in rats under KD, also leading to decreased
compressive stiffness and strength of appendicular bones. The
present study demonstrated a significant correlation between the
compressive properties and microstructural parameters of cancellous
and cortical bones, respectively.
Acknowledgements
Not applicable.
Funding
This study was supported by National Science
Foundation of China (grant no. 81472084), Guangdong Province
Natural Science Foundation of China (grant no. 2015A030313276) and
the Dean Foundation of Southern Medical University Nanfang Hospital
(grant no. 2016Z021).
Availability of data and materials
All experimental data are available upon request
from the corresponding author.
Authors' contributions
QZ, XW, JD and XX designed the experiments. QL and
RL performed the animal experiments. ZhH and ZuH performed the
experimental sampling. JD and XX wrote the manuscript. YL, JL, GK
and ZY performed the data analysis, and QZ revised the
manuscript.
Ethical approval and informed consent
The study was approved by the Nanfang Hospital
Animal Experiments Ethics Committee (no. NFYY-2017-41). All animal
experiments were performed according to the Guidelines for the Care
of Laboratory Animals by the Ministry of Science and Technology of
the P.R. China.
Patient consent for publication
Not applicable.
Competing interests
The authors declare that they have no competing
interests.
References
|
1
|
Kose E, Guzel O, Demir K and Arslan N:
Changes of thyroid hormonal status in patients receiving ketogenic
diet due to intractable epilepsy. J Pediatr Endocrinol Metab.
30:411–416. 2017. View Article : Google Scholar : PubMed/NCBI
|
|
2
|
McArtney R, Bailey A and Champion H: What
is a ketogenic diet and how does it affect the use of medicines?
Arch Dis Child Educ Pract Ed. 102:194–199. 2017. View Article : Google Scholar : PubMed/NCBI
|
|
3
|
Fukao T, Lopaschuk GD and Mitchell GA:
Pathways and control of ketone body metabolism: On the fringe of
lipid biochemistry. Prostaglandins Leukot Essent Fatty Acids.
70:243–251. 2004. View Article : Google Scholar : PubMed/NCBI
|
|
4
|
Krebs HA: The regulation of the release of
ketone bodies by the liver. Adv Enzyme Regul. 4:339–354. 1966.
View Article : Google Scholar : PubMed/NCBI
|
|
5
|
Van der Auwera I, Wera S, Van Leuven F and
Henderson ST: A ketogenic diet reduces amyloid beta 40 and 42 in a
mouse model of Alzheimer's disease. Nutr Metab (Lond). 2:282005.
View Article : Google Scholar : PubMed/NCBI
|
|
6
|
Tai KK and Truong DD: Ketogenic diet
prevents seizure and reduces myoclonic jerks in rats with cardiac
arrest-induced cerebral hypoxia. Neurosci Lett. 425:34–38. 2007.
View Article : Google Scholar : PubMed/NCBI
|
|
7
|
Tai KK, Nguyen N, Pham L and Truong DD:
Ketogenic diet prevents cardiac arrest-induced cerebral ischemic
neurodegeneration. J Neural Transm (Vienna). 115:1011–1017. 2008.
View Article : Google Scholar : PubMed/NCBI
|
|
8
|
Puchowicz MA, Zechel JL, Valerio J,
Emancipator DS, Xu K, Pundik S, LaManna JC and Lust WD:
Neuroprotection in diet-induced ketotic rat brain after focal
ischemia. J Cereb Blood Flow Metab. 28:1907–1916. 2008. View Article : Google Scholar : PubMed/NCBI
|
|
9
|
Prins ML, Fujima LS and Hovda DA:
Age-dependent reduction of cortical contusion volume by ketones
after traumatic brain injury. J Neurosci Res. 82:413–420. 2005.
View Article : Google Scholar : PubMed/NCBI
|
|
10
|
VanItallie TB, Nonas C, Di Rocco A, Boyar
K, Hyams K and Heymsfield SB: Treatment of Parkinson disease with
diet-induced hyperketonemia: A feasibility study. Neurology.
64:728–730. 2005. View Article : Google Scholar : PubMed/NCBI
|
|
11
|
Colica C, Merra G, Gasbarrini A, De
Lorenzo A, Cioccoloni G, Gualtieri P, Perrone MA, Bernardini S,
Bernardo V, Di Renzo L and Marchetti M: Efficacy and safety of
very-low-calorie ketogenic diet: A double blind randomized
crossover study. Eur Rev Med Pharmacol Sci. 21:2274–2289.
2017.PubMed/NCBI
|
|
12
|
Mackay MT, Bicknell-Royle J, Nation J,
Humphrey M and Harvey AS: The ketogenic diet in refractory
childhood epilepsy. J Paediatr Child Health. 41:353–357. 2005.
View Article : Google Scholar : PubMed/NCBI
|
|
13
|
Bergqvist AC, Schall JI, Stallings VA and
Zemel BS: Progressive bone mineral content loss in children with
intractable epilepsy treated with the ketogenic diet. AM J Clin
Nutr. 88:1678–1684. 2008. View Article : Google Scholar : PubMed/NCBI
|
|
14
|
Wu X, Huang Z, Wang X, Fu Z, Liu J, Huang
Z, Kong G, Xu X, Ding J and Zhu Q: Ketogenic diet compromises both
cancellous and cortical bone mass in mice. Calcif Tissue Int.
101:412–421. 2017. View Article : Google Scholar : PubMed/NCBI
|
|
15
|
Bouxsein ML: Determinants of skeletal
fragility. Best Pract Res Clin Rheumatol. 19:897–911. 2005.
View Article : Google Scholar : PubMed/NCBI
|
|
16
|
Chen C, Zhang X, Guo J, Jin D, Letuchy EM,
Burns TL, Levy SM, Hoffman EA and Saha PK: Quantitative imaging of
peripheral trabecular bone micro-architecture using MDCT. Med Phys.
45:236–249. 2018. View
Article : Google Scholar : PubMed/NCBI
|
|
17
|
Adachi JD, Loannidis G, Berger C, Joseph
L, Papaioannou A, Pickard L, Papadimitropoulos EA, Hopman W,
Poliquin S, Prior JC, et al: The influence of osteoporotic
fractures on health-related quality of life in community-dwelling
men and women across Canada. Osteoporos Int. 12:903–908. 2001.
View Article : Google Scholar : PubMed/NCBI
|
|
18
|
Kazakia GJ, Nirody JA, Bernstein G, Sode
M, Burghardt AJ and Majumdar S: Age- and gender-related differences
in cortical geometry and microstructure: Improved sensitivity by
regional analysis. Bone. 52:623–631. 2013. View Article : Google Scholar : PubMed/NCBI
|
|
19
|
Trombetti A, Stoermann C, Chevalley T, Van
Rietbergen B, Herrmann FR, Martin PY and Rizzoli R: Alterations of
bone microstructure and strength in end-stage renal failure.
Osteoporos Int. 24:1721–1732. 2013. View Article : Google Scholar : PubMed/NCBI
|
|
20
|
Burghardt AJ, Kazakia GJ, Sode M, de Papp
AE, Link TM and Majumdar S: A longitudinal HR-pQCT study of
alendronate treatment in postmenopausal women with low bone
density: Relations among density, cortical and trabecular
microarchitecture, biomechanics, and bone turnover. J Bone Miner
Res. 25:2558–2571. 2010. View
Article : Google Scholar : PubMed/NCBI
|
|
21
|
Bertoli S, Trentani C, Ferraris C, De
Giorgis V, Veggiotti P and Tagliabue A: Long-term effects of a
ketogenic diet on body composition and bone mineralization in
GLUT-1 deficiency syndrome: A case series. Nutrition. 30:726–728.
2014. View Article : Google Scholar : PubMed/NCBI
|
|
22
|
Simm PJ, Bicknell-Royle J, Lawrie J,
Nation J, Draffin K, Stewart KG, Cameron FJ, Scheffer IE and Mackay
MT: The effect of the ketogenic diet on the developing skeleton.
Epilepsy Res. 136:62–66. 2017. View Article : Google Scholar : PubMed/NCBI
|
|
23
|
Caminhotto RO, Komino ACM, de Fatima Silva
F, Andreotti S and Sertié RAL: Boltes Reis G and Lima FB: Oral
β-hydroxybutyrate increases ketonemia, decreases visceral adipocyte
volume and improves serum lipid profile in Wistar rats. Nutr Metab
(Lond). 14:312017. View Article : Google Scholar : PubMed/NCBI
|
|
24
|
Newell C, Bomhof MR, Reimer RA, Hittel DS,
Rho JM and Shearer J: Ketogenic diet modifies the gut microbiota in
a murine model of autism spectrum disorder. Mol Autism. 7:372016.
View Article : Google Scholar : PubMed/NCBI
|
|
25
|
Urbain P and Bertz H: Monitoring for
compliance with a ketogenic diet: What is the best time of day to
test for urinary ketosis? Nutr Metab (Lond). 13:772016. View Article : Google Scholar : PubMed/NCBI
|
|
26
|
Veldhorst MA, Westerterp-Plantenga MS and
Westerterp KR: Gluconeogenesis and energy expenditure after a
high-protein, carbohydrate-free diet. Am J Clin Nutr. 90:519–526.
2009. View Article : Google Scholar : PubMed/NCBI
|
|
27
|
Cahill GJ Jr: Fuel metabolism in
starvation. Annu Rev Nutr. 26:1–22. 2006. View Article : Google Scholar : PubMed/NCBI
|
|
28
|
Johnstone AM, Horgan GW, Murison SD,
Bremner DM and Lobley GE: Effects of a high-protein ketogenic diet
on hunger, appetite, and weight loss in obese men feeding ad
libitum. Am J Clin Nutr. 87:44–55. 2008. View Article : Google Scholar : PubMed/NCBI
|
|
29
|
Meyer HE, Sogaard AJ, Falch JA, Jorgensen
L and Emaus N: Weight change over three decades and the risk of
osteoporosis in men: The norwegian epidemiological osteoporosis
studies (NOREPOS). Am J Epidemiol. 168:454–460. 2008. View Article : Google Scholar : PubMed/NCBI
|
|
30
|
Sampath A, Kossoff EH, Furth SL, Pyzik PL
and Vining EP: Kidney stones and the ketogenic diet: Risk factors
and prevention. J Child Neurol. 22:375–378. 2017. View Article : Google Scholar
|
|
31
|
Tamaki J, Iki M, Sato Y, Kajita E, Nishino
H, Akiba T, Matsumoto T and Kagamimori S;: JPOS Study Group: Total
25-hydroxyvitamin D levels predict fracture risk: Results from the
15-year follow-up of the Japanese Population-based Osteoporosis
(JPOS) Cohort study. Osteoporos Int. 28:1903–1913. 2017. View Article : Google Scholar : PubMed/NCBI
|
|
32
|
Schönenberg D, Guggenberger R, Frey D,
Pape HC, Simmen HP and Osterhoff G: CT-based evaluation of
volumetric bone density in fragility fractures of the pelvis-a
matched case-control analysis. Osteoporos Int. 29:459–465. 2018.
View Article : Google Scholar : PubMed/NCBI
|
|
33
|
Macneil JA and Boyd SK: Bone strength at
the distal radius can be estimated from high-resolution peripheral
quantitative computed tomography and the finite element method.
Bone. 42:1203–1213. 2008. View Article : Google Scholar : PubMed/NCBI
|
|
34
|
Pistoia W, van Rietbergen B, Lochmüller
EM, Lill CA, Eckstein F and Rüegsegger P: Estimation of distal
radius failure load with micro-finite element analysis models based
on three-dimensional peripheral quantitative computed tomography
images. Bone. 30:842–848. 2002. View Article : Google Scholar : PubMed/NCBI
|
|
35
|
Nobakhti S and Shefelbine SJ: On the
relation of bone mineral density and the elastic modulus in healthy
and pathologic bone. Curr Osteoporos Rep. 16:404–410. 2018.
View Article : Google Scholar : PubMed/NCBI
|
|
36
|
Hildebrand T, Laib A, Müller R, Dequeker J
and Rüegsegger P: Direct three-dimensional morphometric analysis of
human cancellous bone: Microstructural data from spine, femur,
iliac crest, and calcaneus. J Bone Miner Res. 14:1167–1174. 1999.
View Article : Google Scholar : PubMed/NCBI
|
|
37
|
Buckley JM, Loo K and Motherway J:
Comparison of quantitative computed tomography-based measures in
predicting vertebral compressive strength. Bone. 40:767–774. 2007.
View Article : Google Scholar : PubMed/NCBI
|
|
38
|
Newman JC and Verdin E: Ketone bodies as
signaling metabolites. Trends Endocrinol Metab. 25:42–52. 2014.
View Article : Google Scholar : PubMed/NCBI
|
|
39
|
Carter JD, Vasey FB and Valeriano J: The
effect of a low-carbohydrate diet on bone turnover. Osteoporos Int.
17:1398–1403. 2006. View Article : Google Scholar : PubMed/NCBI
|
|
40
|
Saito A, Yoshimura K, Miyamoto Y, Kaneko
K, Chikazu D, Yamamoto M and Kamijo R: Enhanced and suppressed
mineralization by acetoacetate and β-hydroxybutyrate in osteoblast
cultures. Biochem Biophys Res Commun. 473:537–544. 2016. View Article : Google Scholar : PubMed/NCBI
|
|
41
|
Waarsing JH, Day JS, van der Linden JC,
Ederveen AG, Spanjers C, De Clerck N, Sasov A, Verhaar JA and
Weinans H: Detecting and tracking local changes in the tibiae of
individual rats: A novel method to analyse longitudinal in vivo
micro-CT data. Bone. 34:163–169. 2004. View Article : Google Scholar : PubMed/NCBI
|