Introduction
Amyotrophic lateral sclerosis (ALS) is characterized
by widespread loss of motor neurons in the major motor cortex and
is a devastating neurodegenerative disorder (1). Approximately 10% of ALS cases have a
family history and the other 90% of cases are sporadic amyotrophic
lateral sclerosis (SALS) (2,3). To date, >150 genetic mutations and
>25 different genes have been identified to possibly lead to the
same clinical disease of FALS in patients, and it is characterized
to some extent (4). However, the
understanding for the more common SALS is still poor and there is
no effective treatment or definitive diagnostic test for SALS
(5). Identification of genetic
factors may provide some insight into the underlying mechanisms of
this motor neuron degeneration disease (6). Recently, the mutations of PFN1
(7), CAMTA1 (8), and MATR3 (9) have been identified to be associated
with SALS cases. Moreover, the whole gene composition of the SALS
has been identified (10). Even
though researchers have tried their best to overcome this
complicated and refractory disease, the pathological mechanism of
SALS is still unclear.
During the past several years, high-throughput
experimental and the second generation sequencing technologies have
produced large amounts of gene expression profile data, and make it
possible to study the pathological mechanism of a certain disease
systematically (11). It is well
known that the genes that are functionally related to the disease
are always highly co-expressed across organisms (12). In other words, they are active in
modules (13). Fortunately, several
module approaches have been proposed to determine the differential
expression of the modules under differential cell types, and
systemic module inference method (14) and attract method (15) is the most frequently used methods to
conducted analysis on the differential expressed modules. The
systemic module inference method can reveal the interesting
patterns between gene composition and expression correlation,
especially those affecting modules for genomic stability (14), and the attract method can best
discriminate the differences between different cell phenotypes, and
is not restricted to the annotated genes (15).
Therefore, to understand the mechanism of SALS, we
integrated the systemic module inference method and the
attract method to conduct analysis on the gene expression of
SALS, so as to identify the differentially expressed modules, which
we called attractor modules for SALS. The results might provide
insight into potential biomarkers for early diagnosis and therapy
of SALS, or even give a hand for clinical treatment of this
complicated and refractory disease and other related diseases.
Materials and methods
Gene expression data recruiting and
preprocessing
Data recruitment of SALS, with accession number
E-MTAB-2325, was conducted from ArrayExpress database (http://www.ebi.ac.uk/arrayexpress/). E-MTAB-2325
exists on A-AGIL-28 - Agilent Whole Human Genome Microarray 4×44K
014850 G4112F (85 cols × 532 rows) Platform, and consist of 41
samples (10 normal control samples and 31 SALC patients).
Prior to analysis, the robust multichip average
(RMA) method (16) was used to
perform background correction and quantile based algorithm
(17) and invited to carry out
normalization to debride the effect of nonspecific hybridization.
Besides, Micro Array Suite 5.0 (MAS 5.0) algorithm was used to
amend perfect match and mismatch value (18). Moreover, the median polish was
utilized to conduct the calculation of the gene expression value
analysis (19). Finally, all the
genes in the probe level were converted into gene symbols, and
18,411 gene symbols were procured.
PPI network construction
To construct the PPI network, data were firstly
recruited from the database Search Tool for the Retrieval of
Interacting Genes/Proteins (STRING, http://string-db.org/). The data comprised of
1,048,576 interactions with combine-scores obtained from STRING in
order to build PPI network. Following the removing of self-loops
and proteins without expression value, a PPI network containing
7,279 nodes and 43,786 highly correlated interactions (with
combine-score ≥0.7) was constructed. Taking the intersection of the
12,493 genes in E-MTAB-2325 and the nodes in the PPI network, we
established a novel PPI network with 7,033 nodes (43,786
interactions).
PPI network re-weighting
The score of an interaction could represent the
reliability of PPI network, and the re-weighted interaction could
better reflect the practical network interaction than the original
one (20). In the present study, PPI
networks under two conditions were separately re-weighted by the
parameter of Spearman's correlation coefficient (SCC) to reflect
the actual relationship between these interactions. First of all,
the SCC of each interaction in the novel PPI network was calculated
according to the gene expression profile value, and the absolute
values of the SCC were separately considered as the combine-score
value of each interaction. Then, a two-tailed t-test with
Benjamini-Hochberg false discovery rate (FDR) adjustment was used
to identify the P-values of differential gene expression between
SALC and control conditions (21),
and the interactions with P-value <0.05 were established to
build the destination networks for normal control and SALS groups,
respectively. In the circumstances, two PPI networks separately
with each of the edges were assigned a combined score were built
for normal control and the SALS groups, respectively.
Identifying maximal cliques from the
PPI networks
A maximal clique is a maximal independent set of
sub-graph in a graph, and any two vertices in the clique are
adjacent (22). The maximal cliques
are always one of the fundamental problems in a certain network,
and identifying maximal cliques has been widely used in
bioinformatics and clustering (23).
Here, for identifying the maximal cliques from the PPI networks, we
invited the fast depth-first method to perform the analysis. All of
the maximal cliques were ranked according to the number of nodes.
The cliques with too small amount of nodes might be too simple and
insufficient to describe the correlation of the biomarkers and the
disease while the cliques with too large numbers of genes were not
easy enough to be understood by human experts. Hence, we only
retained the maximal cliques whose number of nodes was not less
than 6 and not larger than 20 for further analysis in this
study.
Identifying modules
Furthermore, to identify modules for normal control
and the SALC groups, clique-merging were utilized to perform
module-identification algorithm in this study (24). First of all, the weighted interaction
density (WID) was separately calculated for each maximal cliques
that we identified above, and all of the maximal cliques were
ranked in descending order on the basis of their values of WID.
Moreover, there might be thousands of maximal cliques in a PPI
network and most of them overlapped with one another, and the
highly overlapped cliques should be removed to reduce the result
size. Moreover, merging highly overlapped cliques to form bigger
sub-graphs was also desirable since complexes were not necessarily
fully connected and PPI data might be incomplete. Hence, the
inter-connectivity between any two cliques was calculated according
to the WID values, and the inter-connectivity values were used to
determine whether two overlapped cliques should be merged together
or not. In the present study, the inter-connectivity value >0.5
was used as the cut off value whether to merge or not merge these
two maximal cliques.
Comparison of the genes in the modules
under different conditions
In order to better compare the differential
expression of the modules between normal control and the SALS
conditions, the modules that were with same or similar genetic
make-up in the two groups were determined. The Jaccard similarity
of the module in the case and control condition were identified,
which was calculated according to J (Sa,
Tb) = |Sa ∩ Tb|
/ |Sa ∪ Tb| (25). The modules J (Sa,
Tb) ≥0.7 were considered as similar modules in gene
composition. In the present study, all of the modules in similar
gene composition were considered as candidate attractors in the
following analysis.
Identification of attractor
modules
Further to determine the differential attractor
modules between the normal control and the SALS groups, the
attract method was utilized to perform analysis on the
candidate attractor. In the present study, GSEA-ANOVA, a gene set
enrichment algorithm was used to indentify the differential
expression on the attractor level data.
First of all, take gene m as an example, an
ANOVA model was fit to it as its gene expression was modeled by a
single factor. Suppose that there was u (u = 1, …, u) samples and v
(v = 1, …, v) cell phenotypes, the gene expression profile of gene
m was modeled in light of the following formula:
yuv(m)=β+βv+δuv
β represented the overall mean, β
denoted the u-th cell type group's effect on the expression
of the gene m, and δuv reflected the random normal
residual error term.
Then, an F-statistic value was assigned to gene
m, which was calculated in light of the following
formula:
F(m)=MSSmRSSm
MSSa represents the mean treatment
sum of squares, which was determined by the amount of variation
according to the cell type group-specific effects, and
RSSa denotes the residual sum of squares.
In this case, we could identify which genes were
informative for a particular set of cell types by integrating the
ANOVA model with the F-statistics. As it was indicated that the
F-statistic could capture the strength of association of a gene's
expression over the different cell types, and the larger the
F-statistic values were, the larger the cell type-specific
expression changes (26). Therefore,
in the present study, to test the relationship between the
F-statistic values and cell type-specific expression changes, we
used t-test and Welch modification to perform further analysis. For
increasing the sensitivity of the differences between the global
distribution of F-statistics and the module distribution, we
performed a multiple-testing by using the Benjamini-Hochberg
FDR-based method to adjust the resulting P-values (27). Finally, these candidate attractors
with adjusted P-values <0.05 were regarded as attractor
modules.
Pathway enrichment analysis of the
attractor modules
To determine the functional enrichment of these
attractor modules, pathway enrichment analysis was grounded in
Kyoto Encyclopedia of Genes and Genomes (KEGG) pathway database in
Genelibs (http://www.genelibs.com/gb/index.jsp). To determine
the P-values of the enrichment condition, the Fisher's exact test
was performed. Moreover, Benjamini-Hochberg method was utilized to
go on multiple testing on the P-values. The pathways with adjusted
P-value <0.05 were considered as the pathways where certain
attractor module was enriched. Additionally, the pathway with the
minimum adjusted P-value was considered as the significant pathway
that the attractor module was enriched in.
Results
PPI network re-weighting
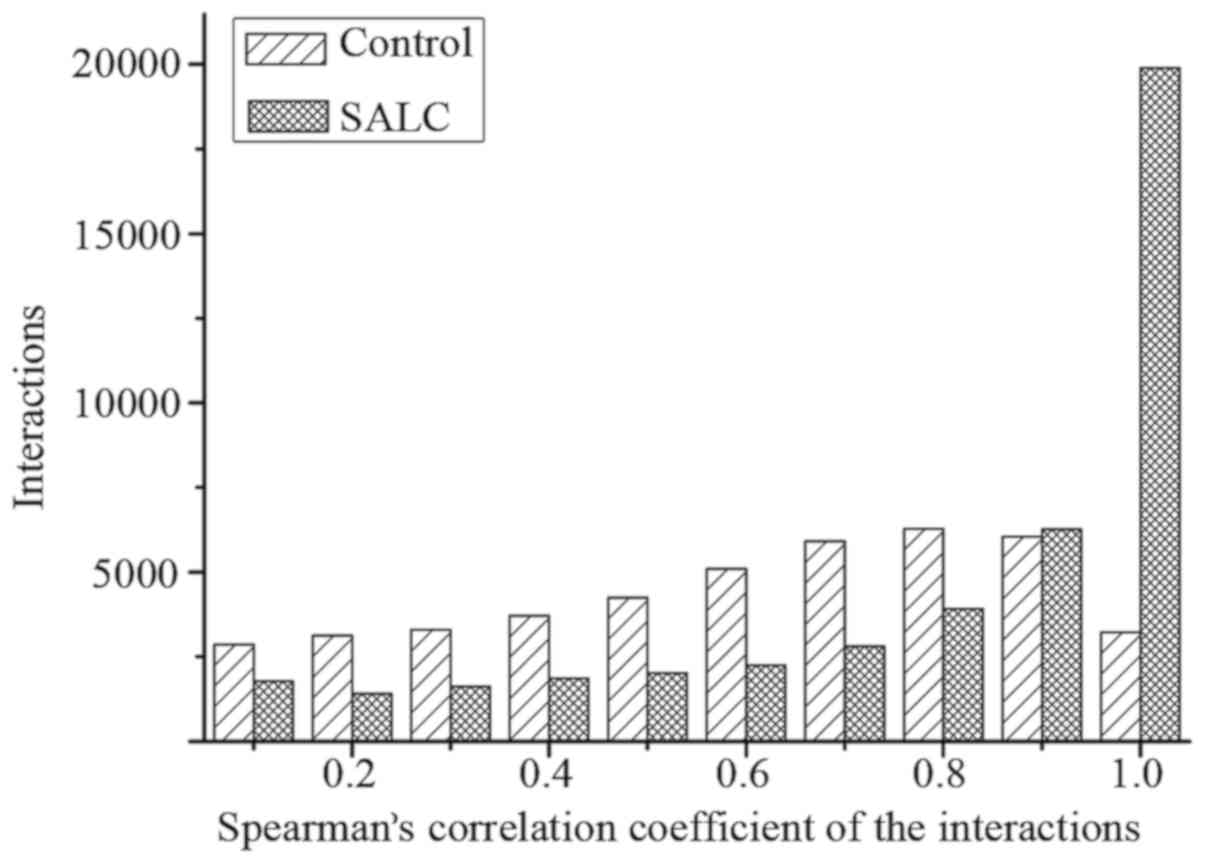
To present the reliability of the network, the
interactions were all re-weighted to reflect an actual interaction
network based on SCC. As statistical analysis was conducted on the
distributions of the absolute value of SCC in the normal control
and the SALS groups, we found that the distributions were different
from each other (Fig. 1). To
increase the comparability of these two groups, a two-tailed t-test
with Benjamini & Hochberg FDR adjustment was utilized to
determine the P-values of differential gene expression between the
normal control and the SALS conditions, and under the cut-off value
of P-value <0.05, two PPI networks separately with each of the
edges were assigned a combined-score built for the normal control
and the SALS groups, respectively. However, there were some nodes
out of the main networks, and these nodes with lower degree were
not associated with the biological process of a certain disease.
Hence, to conduct the following analysis more conveniently, the
nodes out of the main networks were removed, and only the main
networks remained to perform a further analysis. There were 870
nodes (979 interactions) in the normal control group and 601 nodes
(777 interactions) in the SALS group of the main PPI networks,
respectively.
Identifying maximal cliques from the
PPI networks
Maximal cliques were one of the fundamental problems
in a certain network, hence in the present work, we identified the
maximal cliques to perform analysis on the reweighted network. The
fast depth-first method identified the maximal cliques from the PPI
networks, and we gained 12,849 and 22,605 maximal cliques,
respectively, for the normal control and the SALS groups. Finally,
under the threshold value of node number larger than 6 and less
than 20, 1,474 and 4,224 maximal cliques, respectively, were
obtained for the normal control and the SALS groups for further
analysis.
Identifying modules
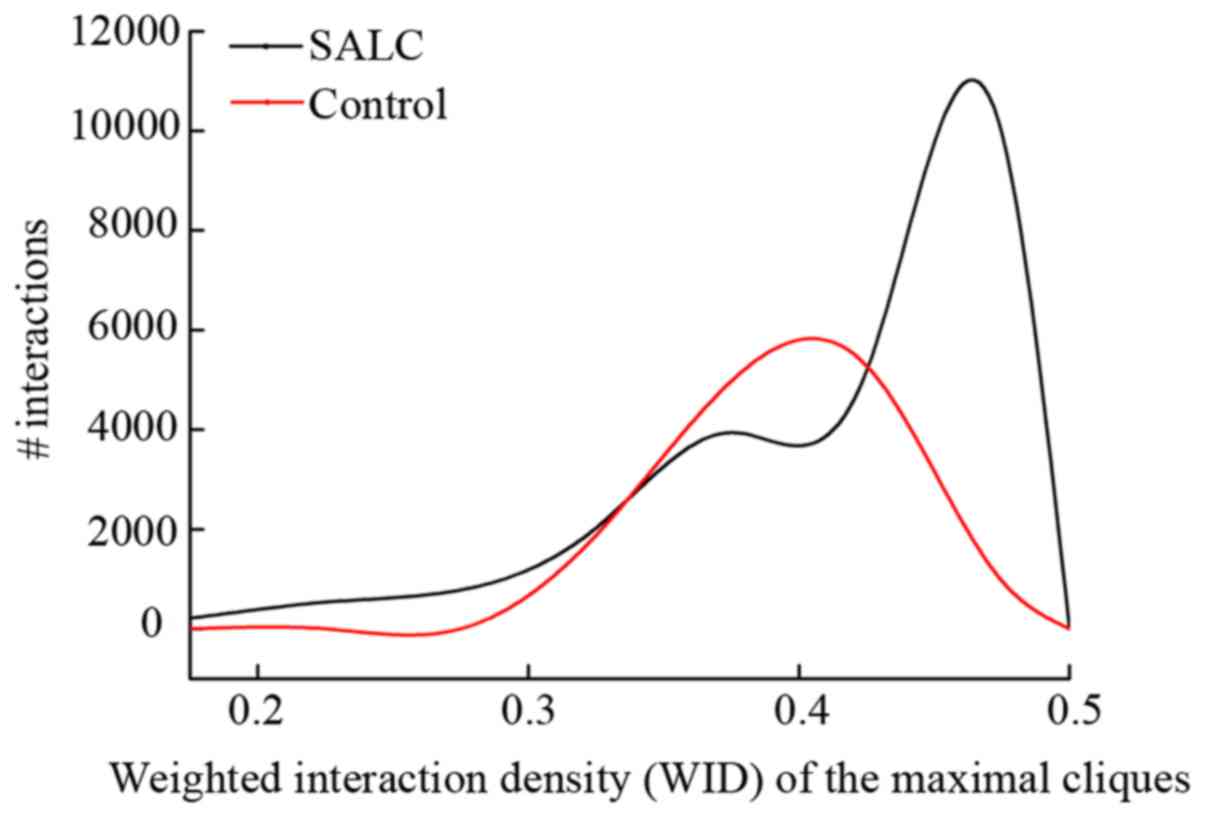
To further refine the maximal cliques, modules were
identified based on the clique-merging. After the WID values in
both groups were calculated and ranked in descending order, we
found that the WID values were ranged from 0.316 to 0.498 in the
normal control group, and in the SALS group they ranged from 0.178
to 0.499 (Fig. 2). Thus, the cliques
in the normal control group were more likely to have more common
neighbours than the cliques in the SALS group. Moreover, the
inter-connectivity between two cliques was defined based on the
connectivity between the non-overlapping parts of the two cliques.
Under the threshold value of the inter-connectivity value >0.5,
44 and 118 modules were confirmed as the normal control and the
SALS groups, respectively.
Comparison of the genes in the modules
under different condition
Having identified modules for both groups, for
better comparing the differential modules between normal control
and the SALS conditions, we performed analysis to determine the
modules that were with same or similar genetic make-up in the two
groups. Under the cut-off value of J (Sa,
Tb) ≥0.7, 6 candidate attractors, which we named as
module 1 - module 6 were selected for further analysis.
Identification of attractor
modules
To determine the differential expression normal
control and the SALS groups, the attract method was
conducted for analysis on the attractor level. After having used
the t-test and Welch modification to determine the F-statistic
values and cell type-specific expression changes, the resulting
P-values were adjusted by using Benjamini-Hochberg FDR-based
method, 6 attractor modules were identified under the threshold
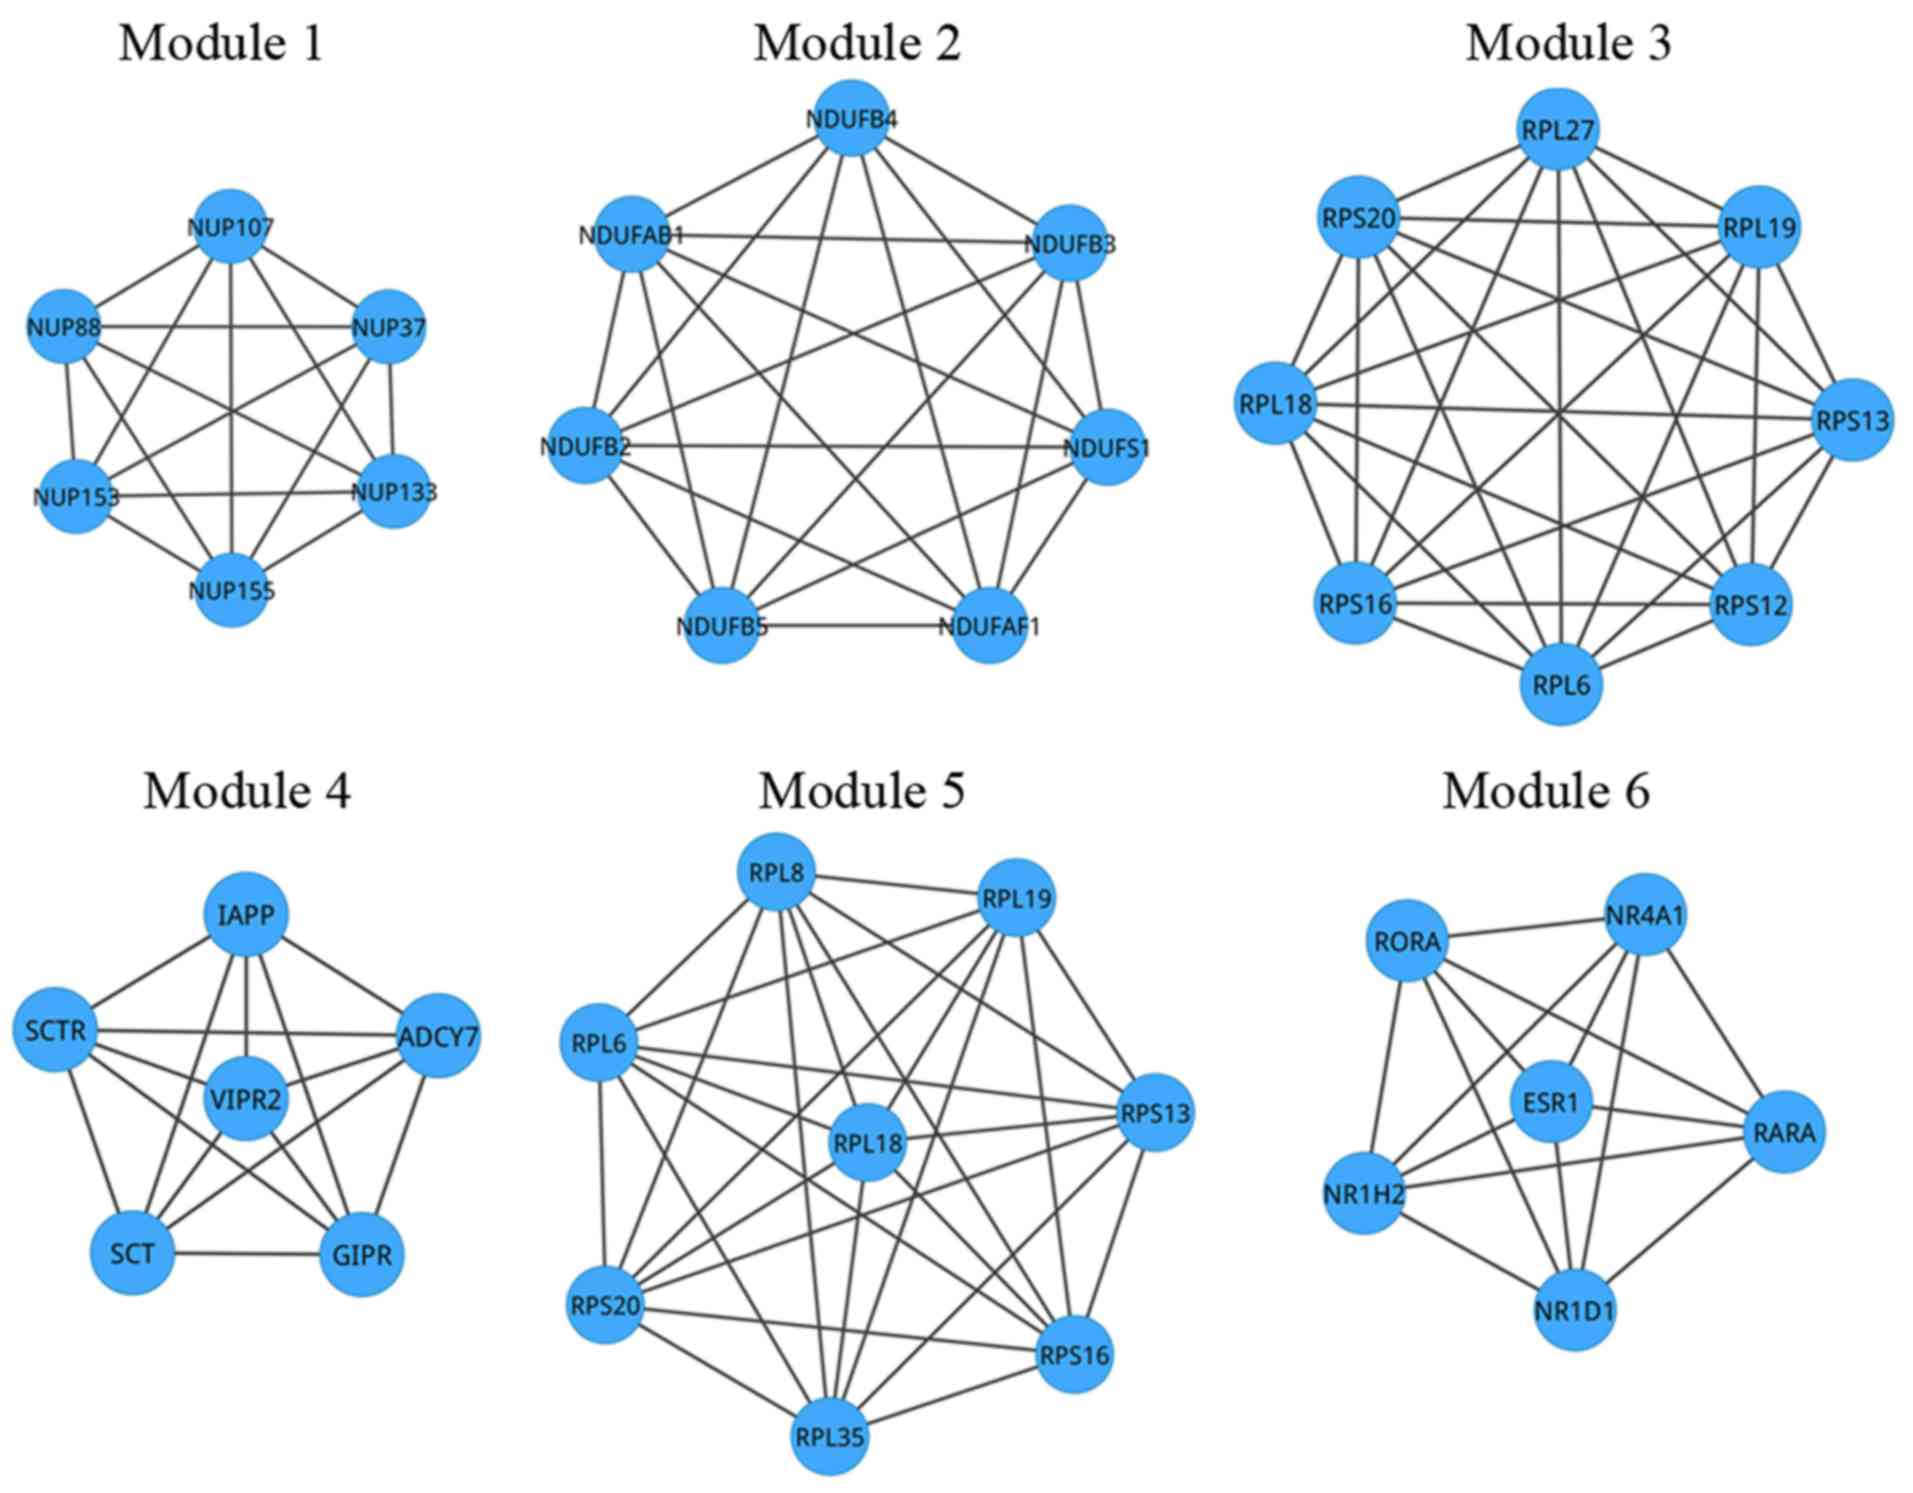
value of adjusted P-values <0.05. As shown in Fig. 3, in module 1 to module 6, there were,
respectively, 6 nodes (15 interactions), 7 nodes (21 interactions),
8 nodes (28 interactions), 6 nodes (15 interactions), 8 nodes (28
interactions) and 6 nodes (15 interactions). The details of the
P-values and nodes are listed in Table
I.
 | Table I.Details of the attractor modules and
the pathway. |
Table I.
Details of the attractor modules and
the pathway.
| Module | P-value | Gene number | Gene | Enriched pathway
(P-value) |
|---|
| Module 1 | 0.3130570 | 6 | NUP88, NUP107,
NUP37, NUP153, NUP133, NUP155 | NA |
| Module 2 | 0.2126378 | 7 | NDUFAB1, NDUFB2,
NDUFB4, NDUFB5, NDUFB3, NDUFS1, NDUFAF1 | Oxidative
phosphorylation (P=1.63×10⁻¹⁰) |
| Module 3 | 0.4126378 | 8 | RPS20, RPL18,
RPS16, RPL6, RPS13, RPL27, RPS12, RPL19 | EIF2 signaling
(P=3.67×10⁻¹²) |
| Module 4 | 0.4126378 | 6 | SCTR, SCT, IAPP,
ADCY7, GIPR, VIPR2 | Neuroactive
ligand-receptor interaction (P=1.11×10⁻³) |
| Module 5 | 0.5841532 | 8 | RPS20, RPL35,
RPL18, RPS16, RPL6, RPS13, RPL8, RPL19 | NA |
| Module 6 | 0.5841532 | 6 | ESR1, NR4A1,
RARA, NR1H2, NR1D1, RORA | Circadian rhythm
(P=0.2.31×10−3) |
Pathway enrichment analysis of the
attractor modules
Further to disclose the functional enrichment of
these attractor modules, pathway enrichment analysis was performed.
Under the adjusted P-value <0.05, we found that there was no
pathway enriched in module 1 and module 5. While module 2 was
enriched in oxidative phosphorylation (P=1.63×10⁻¹⁰),
module 3 was enriched in EIF2 signaling (P=3.67×10⁻¹²),
module 4 was enriched in neuroactive ligand-receptor interaction
(P=1.11×10⁻³) and module 6 was enriched in circadian
rhythm (P=0.2.31×10−3). We predicted that these
attractor modules mainly influenced the pathway functions during
the occurrence and development of SALS.
Discussion
In the present study, we combined the systemic
module inference method with the attract method to perform
analysis on the gene expression of SALS to identify the attractor
modules for SALS, expecting to gain further clarification. By
performing this integrated approach, we successfully identified 6
attractor modules, where module 2 was enriched in oxidative
phosphorylation pathway, module 3 was enriched in EIF2 signaling
pathway, module 4 was enriched in neuroactive ligand-receptor
interaction pathway and module 6 was enriched in circadian rhythm
pathway.
ALS is one of the most destructive neurological
diseases. Worse, most of ALS patients can survival only 3–4 years
after symptom onset (28).
Fortunately, there are still around 10% of patients that can live
beyond 10 years after symptom onset, which is mainly related to
younger age of onset, pure lower motor neuron involvement, or pure
upper neuron involvement (29).
Researchers have focused on studying the oxidative stress in
clinical or patient-oriented SALS during the last several years.
Analyses of post-mortem neuronal tissue in SALS patients
consistently showed that oxidation did result in damage to
proteins, lipids or DNA (30). The
study of the effects of oxidative stress on molecular targets and
the identification of reliable biomarkers involved in oxidative
stress are two major challenges in SALS (31). Although the evidence for oxidative
damage in the pathogenesis of SALS is extensive, the ultimate
triggers of increased levels of reactive oxygen species remain
unknown, leading to speculation that oxidative stress is a major
cause of the disease or is only a secondary consequence (32). In the present study, oxidative
phosphorylation pathway was a pathway that one of the attractor
modules identified, which exposed the close connection between the
SALS and the oxidative stress.
In addition, the pathway of neuroactive
ligand-receptor interaction was also shown great importance during
the progress of SALS in the present study, and the module genes of
SCTR, SCT, IAPP, ADCY7, GIPR and VIPR2 were enriched in this
pathway. It is well known that ALS is a devastating neurological
disease, hence, there may be no dispute or divergent idea that
there is a close connection between the pathway of neuroactive
ligand-receptor interaction with SALS. Moreover, it was indicated
that gene ADCY7 presented an important role in the central
nervous system, hence, ADCY7 may have properties related to
cell viability and may potentially be ALS pathology (33). In addition, the pituitary adenylyl
cyclase activating polypeptide (PACAP) originally isolated from the
hypothalamus is a member of the vasoactive intestinal polypeptide
(VIP)/mycin/glucagon superfamily (34). VPAC1 and VPAC2 bind PACAP and related
neuropeptide VIPs with similar affinities are expressed by various
cell types including neurons, glial cells, endothelial cells,
lymphocytes, and macrophages (35).
Therefore, endogenous PACAP may promote microglial destruction, and
these functions are thought to drive progression of ALS disease
(36). VAPC2 is produced by VIPR2
gene during the generation of gene-specific ribonucleic probes for
RNA in situ hybridization experiments (36). In this case, there might be some
relationship between the VIPR2 and SALS. Verification
experiments will be conducted to confirm the roles of these
attractor modules on the SALS pathology.
Therefore, the approach of integrating the systemic
module inference method with the attract method to perform
analysis on the gene expression of SALS to identify the attractor
modules for SALS was suitable. Six attractor modules (module 1 -
module 6) were identified for SALS, where module 2 was enriched in
oxidative phosphorylation, module 3 was enriched in EIF2 signaling,
module 4 was enriched in neuroactive ligand-receptor interaction
and module 6 was enriched in circadian rhythm. We predicted that
these attractor modules mainly influenced these pathways to
function during the occurrence and development of SALS, and these
attractor modules might be potential biomarkers for early diagnosis
and therapy of SALS, which could provide insight into the disease
biology and suggest possible directions for drug screening
programs, or even provide a hand for future study of related
disease research.
Acknowledgements
Not applicable.
Funding
No funding was received.
Availability of data and materials
The datasets used and/or analyzed during the current
study are available from the corresponding author on reasonable
request.
Authors' contributions
FZ conceived the study and drafted the manuscript.
ML and QL acquired the data. QL and FXS analyzed the data and
revised the manuscript. All authors read and approved the final
manuscript.
Ethics approval and consent to
participate
Not applicable.
Patient consent for publication
Not applicable.
Competing interests
The authors declare that they have no competing
interests.
References
|
1
|
Carvalho TL, de Almeida LM, Lorega CM,
Barata MF, Ferreira ML, de Brito-Marques PR and Correia Cda C:
Depression and anxiety in individuals with amyotrophic lateral
sclerosis: A systematic review. Trends Psychiatry Psychother.
38:1–5. 2016. View Article : Google Scholar : PubMed/NCBI
|
|
2
|
Leblond CS, Gan-Or Z, Spiegelman D,
Laurent SB, Szuto A, Hodgkinson A, Dionne-Laporte A, Provencher P,
de Carvalho M, Orrù S, et al: Replication study of MATR3 in
familial and sporadic amyotrophic lateral sclerosis. Neurobiol
Aging. 37:209.e17–209.e21. 2016. View Article : Google Scholar
|
|
3
|
Basu S, Baghel NS, Puri A, Shet T and
Merchant NH: 18 F-FDG avid lesion due to coexistent fibrous
dysplasia in a child of embryonal rhabdomyosarcoma: Source of false
positive FDG-PET. J Cancer Res Ther. 6:92–94. 2010. View Article : Google Scholar : PubMed/NCBI
|
|
4
|
Renton AE, Chiò A and Traynor BJ: State of
play in amyotrophic lateral sclerosis genetics. Nat Neurosci.
17:17–23. 2014. View
Article : Google Scholar : PubMed/NCBI
|
|
5
|
Poppe L, Rué L, Robberecht W and Van Den
Bosch L: Translating biological findings into new treatment
strategies for amyotrophic lateral sclerosis (ALS). Exp Neurol.
262:138–151. 2014. View Article : Google Scholar : PubMed/NCBI
|
|
6
|
Ahmed RM, Irish M, Piguet O, Halliday GM,
Ittner LM, Farooqi S, Hodges JR and Kiernan MC: Amyotrophic lateral
sclerosis and frontotemporal dementia: Distinct and overlapping
changes in eating behaviour and metabolism. Lancet Neurol.
15:332–342. 2016. View Article : Google Scholar : PubMed/NCBI
|
|
7
|
Tiloca C, Ticozzi N, Pensato V, Corrado L,
Del Bo R, Bertolin C, Fenoglio C, Gagliardi S, Calini D, Lauria G,
et al: SLAGEN Consortium: Screening of the PFN1 gene in sporadic
amyotrophic lateral sclerosis and in frontotemporal dementia.
Neurobiol Aging. 34:1517.e9–1517.e10. 2013. View Article : Google Scholar
|
|
8
|
Fogh I, Lin K, Tiloca C, Rooney J, Gellera
C, Diekstra FP, Ratti A, Shatunov A, van Es MA, Proitsi P, et al:
Association of a locus in the CAMTA1 gene with survival in patients
with sporadic amyotrophic lateral sclerosis. JAMA Neurol.
73:812–820. 2016. View Article : Google Scholar : PubMed/NCBI
|
|
9
|
Lin KP, Tsai PC, Liao YC, Chen WT, Tsai
CP, Soong BW and Lee YC: Mutational analysis of MATR3 in Taiwanese
patients with amyotrophic lateral sclerosis. Neurobiol Aging.
36:2005.e1–4. 2015. View Article : Google Scholar
|
|
10
|
Aronica E, Baas F, Iyer A, ten Asbroek AL,
Morello G and Cavallaro S: Molecular classification of amyotrophic
lateral sclerosis by unsupervised clustering of gene expression in
motor cortex. Neurobiol Dis. 74:359–376. 2015. View Article : Google Scholar : PubMed/NCBI
|
|
11
|
Jordán F, Nguyen T-P and Liu WC: Studying
protein-protein interaction networks: A systems view on diseases.
Brief Funct Genomics. 11:497–504. 2012. View Article : Google Scholar : PubMed/NCBI
|
|
12
|
Choi JK, Yu U, Yoo OJ and Kim S:
Differential coexpression analysis using microarray data and its
application to human cancer. Bioinformatics. 21:4348–4355. 2005.
View Article : Google Scholar : PubMed/NCBI
|
|
13
|
Ravasz E, Somera AL, Mongru DA, Oltvai ZN
and Barabási AL: Hierarchical organization of modularity in
metabolic networks. Science. 297:1551–1555. 2002. View Article : Google Scholar : PubMed/NCBI
|
|
14
|
Srihari S and Ragan MA: Systematic
tracking of dysregulated modules identifies novel genes in cancer.
Bioinformatics. 29:1553–1561. 2013. View Article : Google Scholar : PubMed/NCBI
|
|
15
|
Mar JC, Matigian NA, Quackenbush J and
Wells CA: attract: A method for identifying core pathways that
define cellular phenotypes. PLoS One. 6:e254452011. View Article : Google Scholar : PubMed/NCBI
|
|
16
|
Ma L, Robinson LN and Towle HC: ChREBP*Mlx
is the principal mediator of glucose-induced gene expression in the
liver. J Biol Chem. 281:28721–28730. 2006. View Article : Google Scholar : PubMed/NCBI
|
|
17
|
Rifai N and Ridker PM: Proposed
cardiovascular risk assessment algorithm using high-sensitivity
C-reactive protein and lipid screening. Clin Chem. 47:28–30.
2001.PubMed/NCBI
|
|
18
|
Pepper SD, Saunders EK, Edwards LE, Wilson
CL and Miller CJ: The utility of MAS5 expression summary and
detection call algorithms. BMC Bioinformatics. 8:2732007.
View Article : Google Scholar : PubMed/NCBI
|
|
19
|
Giorgi FM, Bolger AM, Lohse M and Usadel
B: Algorithm-driven artifacts in median polish summarization of
microarray data. BMC Bioinformatics. 11:5532010. View Article : Google Scholar : PubMed/NCBI
|
|
20
|
Liu G, Wong L and Chua HN: Complex
discovery from weighted PPI networks. Bioinformatics. 25:1891–1897.
2009. View Article : Google Scholar : PubMed/NCBI
|
|
21
|
Tavazoie SF, Alarcón C, Oskarsson T, Padua
D, Wang Q, Bos PD, Gerald WL and Massagué J: Endogenous human
microRNAs that suppress breast cancer metastasis. Nature.
451:147–152. 2008. View Article : Google Scholar : PubMed/NCBI
|
|
22
|
Tomita E, Tanaka A and Takahashi H: The
worst-case time complexity for generating all maximal cliques and
computational experiments. Theor Comput Sci. 363:28–42. 2006.
View Article : Google Scholar
|
|
23
|
Mohseni-Zadeh S, Brézellec P and Risler
J-L: Cluster-C: an algorithm for the large-scale clustering of
protein sequences based on the extraction of maximal cliques.
Comput Biol Chem. 28:211–208. 2004. View Article : Google Scholar : PubMed/NCBI
|
|
24
|
Srihari S and Leong HW: A survey of
computational methods for protein complex prediction from protein
interaction networks. J Bioinform Comput Biol. 11:12300022013.
View Article : Google Scholar : PubMed/NCBI
|
|
25
|
Seifoddini H and Djassemi M: The
production data-based similarity coefficient versus Jaccard's
similarity coefficient. Comput Ind Eng. 21:263–266. 1991.
View Article : Google Scholar
|
|
26
|
Tian L, Greenberg SA, Kong SW, Altschuler
J, Kohane IS and Park PJ: Discovering statistically significant
pathways in expression profiling studies. Proc Natl Acad Sci USA.
102:13544–13549. 2005. View Article : Google Scholar : PubMed/NCBI
|
|
27
|
Benjamini Y and Hochberg Y: Controlling
The false discovery rate - A practical and powerful approach to
multiple testing. J R Stat Soc Ser A Stat Soc. 57:289–300.
1995.
|
|
28
|
Yokoi D, Atsuta N, Watanabe H, Nakamura R,
Hirakawa A, Ito M, Watanabe H, Katsuno M, Izumi Y, Morita M, et al:
JaCALS: Age of onset differentially influences the progression of
regional dysfunction in sporadic amyotrophic lateral sclerosis. J
Neurol. 263:1129–1136. 2016. View Article : Google Scholar : PubMed/NCBI
|
|
29
|
Allen SP, Rajan S, Duffy L, Mortiboys H,
Higginbottom A, Grierson AJ and Shaw PJ: Superoxide dismutase 1
mutation in a cellular model of amyotrophic lateral sclerosis
shifts energy generation from oxidative phosphorylation to
glycolysis. Neurobiol Aging. 35:1499–1509. 2014. View Article : Google Scholar : PubMed/NCBI
|
|
30
|
Calingasan NY, Chen J, Kiaei M and Beal
MF: Beta-amyloid 42 accumulation in the lumbar spinal cord motor
neurons of amyotrophic lateral sclerosis patients. Neurobiol Dis.
19:340–347. 2005. View Article : Google Scholar : PubMed/NCBI
|
|
31
|
Bogdanov M, Brown RH Jr, Matson W, Smart
R, Hayden D, O'Donnell H, Flint Beal M and Cudkowicz M: Increased
oxidative damage to DNA in ALS patients. Free Radic Biol Med.
29:652–658. 2000. View Article : Google Scholar : PubMed/NCBI
|
|
32
|
D'Amico E, Factor-Litvak P, Santella RM
and Mitsumoto H: Clinical perspective on oxidative stress in
sporadic amyotrophic lateral sclerosis. Free Radic Biol Med.
65:509–527. 2013. View Article : Google Scholar : PubMed/NCBI
|
|
33
|
Abalkhail H, Mitchell J, Habgood J, Orrell
R and de Belleroche J: A new familial amyotrophic lateral sclerosis
locus on chromosome 16q12.1-16q12.2. Am J Hum Genet. 73:383–389.
2003. View
Article : Google Scholar : PubMed/NCBI
|
|
34
|
Miyata A, Arimura A, Dahl RR, Minamino N,
Uehara A, Jiang L, Culler MD and Coy DH: Isolation of a novel 38
residue-hypothalamic polypeptide which stimulates adenylate cyclase
in pituitary cells. Biochem Biophys Res Commun. 164:567–574. 1989.
View Article : Google Scholar : PubMed/NCBI
|
|
35
|
Dickson L and Finlayson K: VPAC and PAC
receptors: From ligands to function. Pharmacol Ther. 121:294–316.
2009. View Article : Google Scholar : PubMed/NCBI
|
|
36
|
Ringer C, Büning LS, Schäfer MKH, Eiden
LE, Weihe E and Schütz B: PACAP signaling exerts opposing effects
on neuroprotection and neuroinflammation during disease progression
in the SOD1(G93A) mouse model of amyotrophic lateral sclerosis.
Neurobiol Dis. 54:32–42. 2013. View Article : Google Scholar : PubMed/NCBI
|