Introduction
Postmenopausal osteoporosis (PO), one type of
osteoporosis, is believed to result directly from the decreased
endogenous estrogen in menopausal women (1,2). The
measurement of bone mineral density (BMD) has been regarded as the
‘gold standard’ in osteoporosis diagnosis (3). Therefore, extraction of genes
predisposing to BMD will be beneficial for the understanding of
genetic mechanisms and aid in developing novel treatment of PO and
PO-related fractures.
An increasing number of genes has been identified to
have independent effects on BMD in osteoporosis in recent years.
For example, POSTN, a regulator of osteoblast differentiation and
bone formation, has been demonstrated to influence the
susceptibility to low BMD and osteoporosis (4). Moreover, genes VDR, ESR1, NRIP1 in B
cells have been reported to be closely associated with BMD in
patients with osteoporosis (5).
Furthermore, Jemtland et al (6) measured the changes in 84 bone biopsies
related to BMD variations in postmenopausal women to extract
osteoporosis-associated candidate genes and detected that SOX4,
MMP13, and MEPE were all under-expressed. Nevertheless, these
studies paid main attention on the gene levels related to the BMD,
not an intensive analysis of the metabolites in PO.
In 2008, Xiao et al (7) provided the gene profile data of
E-GEOD-7429, analyzing the gene expression profile in B cells of PO
patients and identified that downregulation of ESR1 and MAPK3 in B
cells led to the increased osteoclastogenesis or decreased
osteoblastogenesis. Moreover, in 2016, Ma et al (8) used this microarray data (E-GEOD-7429)
to identify several crucial genes related to PO, and found that the
interactions, for example, CSTA/TYROBP, CCNE1/REL and TUBA1B/ESR1
may play an important role in the development of PO. However, these
analyses are mainly focused on identifying altered genes between
disease and control groups, and do not perform the corresponding
analysis for identifying metabolites. Metabolites, the end products
of biological regulatory process, are regarded as the final
response of biological systems to the changes of environment or
inheritance (9). Significantly,
detecting and prioritizing disease-associated metabolites is
crucial for our understanding of metabolite processes to improve
medicine (10). As reported,
metabolites rarely play an important role in isolation, but they
exert a key function in the connection of phenotypes as well as
genotypes, which are frequently influenced by genome and phenome
(11). With the development of
various ‘omics’ information, genomic, metabolic, as well as
phenomic data, offer valuable information for disease risk
candidate metabolites prioritization. Fortunately, Yao et al
have prioritized several candidate metabolites using multi-omics
composite network (12).
Complementarily, we used multi-omics composite network to screen
the metabolite in PO. Our efforts aimed to characterize new
metabolite biomarkers as tools allowing for better diagnosis and
preventing the progression of PO in the future.
Materials and methods
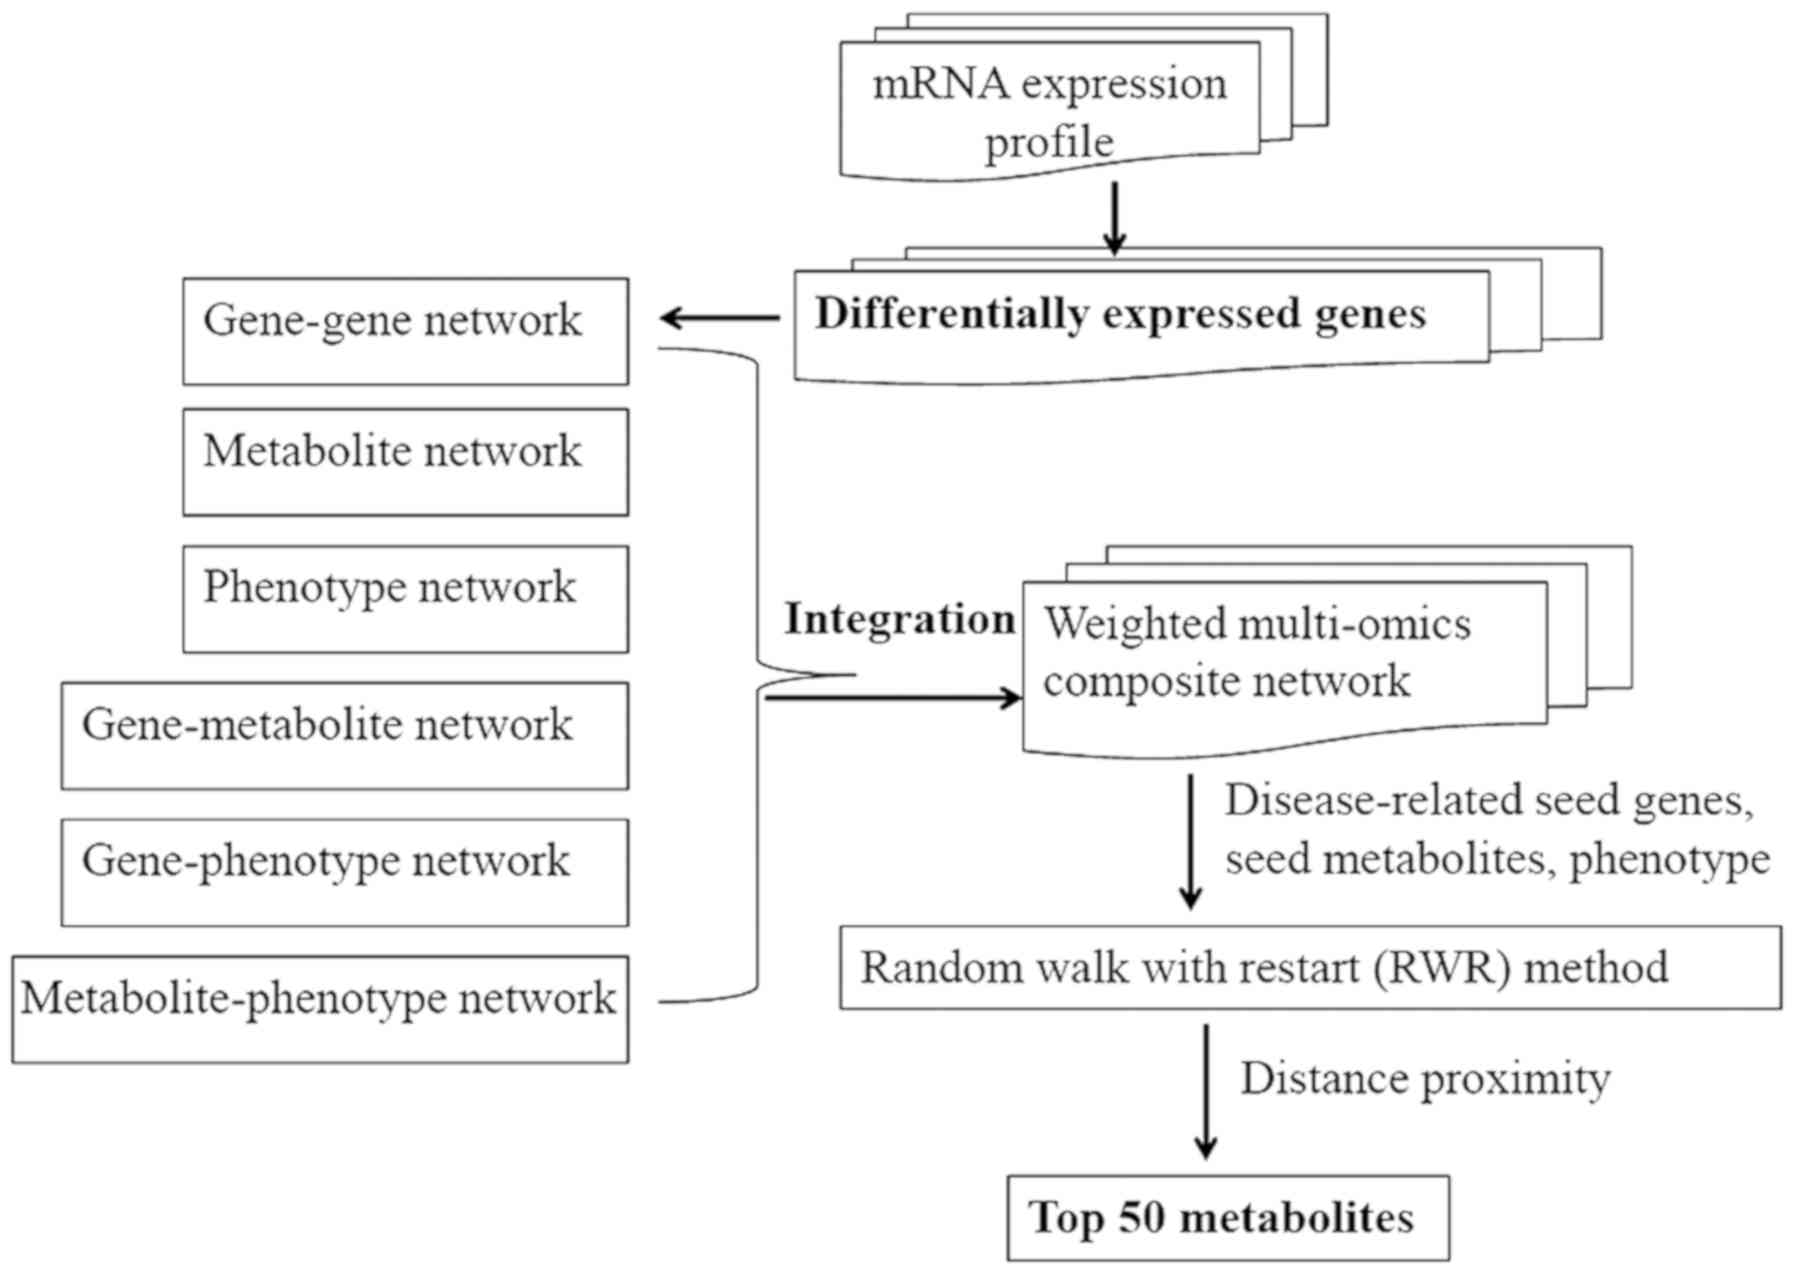
The present analysis was comprised of the following
steps: microarray data selection (E-GEOD-7429) and identification
of differentially expressed genes (DEGs), construction of a
weighted composite network through integrating six data sets, and
prioritization of candidate metabolites. The detailed information
of each step is described in Fig.
1.
Data set
With the goal of revealing the molecular mechanisms
of PO, microarray analyses of monocytes were performed using
microarray data (accession number: E-GEOD-7429) (7) which were downloaded from the
ArrayExpress database. A total of 20 samples were available. B
cells were isolated from the whole blood of 20 unrelated
postmenopausal women 54–60 years of age, including 10 with high BMD
and 10 with low BMD. The platform of E-GEOD-7429 was
A-AFFY-33-Affymetrix GeneChip Human Genome HG-U133A [HG-U133A].
Data pretreatment and DEGs
identification
Probe IDs having concentrated expression level were
transformed into human gene symbols. Duplicated genes of expression
value in matrix were then eliminated. Overall, 12,437 genes were
obtained. As known, the difference of gene expression levels
reflected the disease characteristics. In our study, LIMMA package
and t-test were used to identify DEGs between the two groups,
following by the multiple correction test using Benjamini &
Hochberg (13) method based on false
discovery rate (FDR). DEGs were subsequently extracted using the
criteria of FDR <0.05. These identified DEGs were used to build
a gene network.
Establishment of multi-omics composite
network
Six data sets (denoted by six networks) were
combined to build a composite network, and six networks were called
gene, phenotype, phenotype-gene, metabolite, gene-metabolite, and
phenotype-metabolite networks.
Construction of gene network
In our study, all human protein-protein interactions
(PPIs) having combine-scores (1,048,576 interactions) were obtained
from STRING to establish the background PPI network. After we
removed the duplicated PPIs, and transformed proteins into human
gene symbols, 1,515,370 highly correlated gene-gene interactions
covering 16,785 genes were extracted to construct a seed PPI
network (combine-score not less than 0.8 was used herein). Next, we
took the intersection between the 16,785 genes in the seed PPI
network and DEGs to establish the informative gene-gene
network.
Construction of metabolite
network
To begin with, there were 4,994 human metabolites
obtained from the KEGG, HMDB, Reactome, MSEA (14), as well as SMPDB (15). Afterwards, the metabolite-metabolite
interactions of human as well as their corresponding confidence
scores were extracted from STITCH (16). At the end, overall 3,764 human
metabolites as well as 74,667 human metabolite-metabolite
interactions were acquired.
Establishment of phenotype
network
A total of 5,080 phenotypes as well as the scores
exist in the phenotype-phenotype similarity associations (17). Relying on the phenotype-phenotype
similarity associations, a phenotype network was constructed.
Construction of gene-metabolite
association network
In order to obtain gene-metabolite interactions, the
chemical and gene associations of human and the corresponding
confidence scores were first extracted from the STITCH. After that,
based on the 4,994 human metabolites, we gained human metabolite
and gene associations. When removing the metabolites not included
in the metabolite network mentioned above and eliminating the genes
not covered in the gene network described above, a total of 192,763
gene-metabolite interactions involving in 12,342 genes as well as
3,278 metabolites were gained.
Construction of phenotype-gene
association network
Phenotype-gene associations were picked out relying
on the curated Morbid Map file of the OMIM database. After
discarding the phenotypes that were not included in the phenotype
network and the genes that were not involved in the gene network,
there were 2,603 gene-phenotype associations (covering 1,715 genes
as well as 1,886 phenotypes). The weighted score was determined as
1 for each phenotype-gene association.
Establishment of phenotype-metabolite
association network
After filtration, there were 664 associations
between 388 metabolites and 149 phenotypes. In addition, we defined
the weighted value as 1 for each phenotype-metabolite
interaction.
Establishment of a weighted composite
network
To extract the potential metabolites, we merged the
six networks mentioned above into a weighted composite network.
Specific steps were described in Yao et al (12).
Prioritizing candidate metabolites on
the basis of the weighted multi-omics composite network
The known PO-related metabolites (CID: 5460164, and
123986) were extracted from the Human Metabolome Database (HMDB)
(18) which gathers specific
information of small-molecule metabolites of human as well as the
disease phenotype data. The known PO-related genes were collected
from the Morbid Map file of Online Mendelian Inheritance in Man
(OMIM) (19). The corresponding seed
genes of PO were CALCR, LRP5, VDR, COL1A1, ESR1, NPPB, CNR1, CNR2,
COL1A2, which were deposited in the database of OMIM. The phenotype
of PO was 166710 in OMIN. Next, we mapped these seed genes, the
phenotype, and the known metabolites to the weighted multi-omics
composite network.
In an attempt to obtain the candidate metabolite
prioritization from the weighted composite network involved in the
seed genes, the phenotype, and the known metabolites, RWR method
was expanded to the multi-omics composite network (20). Based on the distance proximity of
every candidate metabolite, candidate metabolites were scored and
ranked. According to the interaction score, the top 50 metabolites
were identified which were determined as the PO-prioritized
metabolites.
Subsequently, co-expressed genes interacting with
the top 50 metabolites were identified, and then, we ranked these
co-expressed genes relying on the score distribution. Finally, we
extracted the top 100 co-expressed genes.
The subnetwork of the top 50 metabolites obtained
from the composite network, and the co-expressed network between
the top 100 co-expressed genes and the top 50 metabolites were
constructed. Significantly, degree analyses were performed for
these two networks to further identify several important AF-related
metabolites.
Results
Identification of DEGs and
establishment of multi-omics composite network
In the present study, we applied DEGs to construct
the gene network, hence, DEGs between the two groups were first
extracted. Using the criteria of the FDR <0.05, overall 601
genes were extracted as differential expression. The top 40 DEGs
are listed in Table I. In this
study, the PO-related metabolites were identified and prioritized
by combining multi-omics data. Thus, in our study, a multi-omics
composite network was first established through combining the
information of genome, metabolome, and phenome. A total of 6 kinds
of interactions were included in the multi-omics composite network.
In this network, there were 9,360 nodes and 10,224,741 edges
(Table II).
 | Table I.The top 40 (DEGs). |
Table I.
The top 40 (DEGs).
| Gene symbols | FDR | Gene symbols | FDR |
|---|
| MAPK3 | 8.52E-09 | UBQLN4 | 9.85E-05 |
| HAO2 | 8.21E-09 | KIRREL | 9.73E-05 |
| TMEM8B | 7.38E-08 | POMT1 | 9.04E-05 |
| PSTPIP1 | 5.52E-08 | SNAI2 | 8.78E-05 |
| HGD | 5.37E-08 | CYB5R4 | 7.92E-05 |
| STK11 | 4.55E-08 | ODF2 | 7.22E-05 |
| ARMCX4 | 1.61E-08 | LOC728392 | 7.21E-05 |
| SETD3 | 7.71E-07 | ZNHIT3 | 8.36E-04 |
| NEO1 | 7.39E-07 | XDH | 8.12E-04 |
| ACKR1 | 7.12E-07 | GALR1 | 7.49E-04 |
| PRG3 | 6.53E-07 | PIGK | 7.12E-04 |
| BEGAIN | 5.69E-07 | PRX | 7.05E-04 |
| NRXN1 | 4.27E-07 | PTOV1-AS2 | 7.01E-04 |
| ZNF446 | 3.95E-07 | SULT1A2 | 6.82E-04 |
| C7 | 3.20E-07 | ABT1 | 7.31E-04 |
| NBR2 | 3.18E-07 | PAQR4 | 7.19E-04 |
| ISYNA1 | 4.39E-06 | PAM16 | 6.97E-04 |
| RGSL1 | 4.15E-06 | TMEM92-AS1 | 6.02E-04 |
| ODF1 | 1.85E-06 | EVX1 | 3.18E-04 |
| SLC26A3 | 1.56E-06 | CD1A | 1.71E-04 |
| Table II.Statistical information of the
composite network. |
Table II.
Statistical information of the
composite network.
| Statistics of the
composite network | Nodes | Edges |
|---|
| Gene-gene
network | 516 | 3325 |
|
Metabolite-metabolite network | 3764 | 74,667 |
| Phenotype-phenotype
network | 5080 | 10,140,046 |
| Gene-metabolite
association network | 516 | 3023 |
| Phenotype-gene
association network | 5080 | 2510 |
|
Phenotype-metabolite association
network | 537 | 664 |
| Total | 9360 | 10,224,741 |
Prioritization of the PO-related
metabolites
A total of 10 disease-related genes of PO are
deposited in OMIM database, including CALCR, LRP5, VDR, COL1A1,
ESR1, NPPB, CNR1, CNR2, and COL1A2, which were downloaded and
determined as seed genes. There were 2 known disease metabolites
(5460164, and 123986) data on PO in HMDB, which were defined as the
seed metabolites. In our analysis, the 2 seed metabolites, and the
10 seed genes were utilized as seeds to identify the candidate
metabolites of PO. To illustrate the intrinsic mode of this
computational approach, the metabolites of the composite network
were ranked in descending order on the basis of the interaction
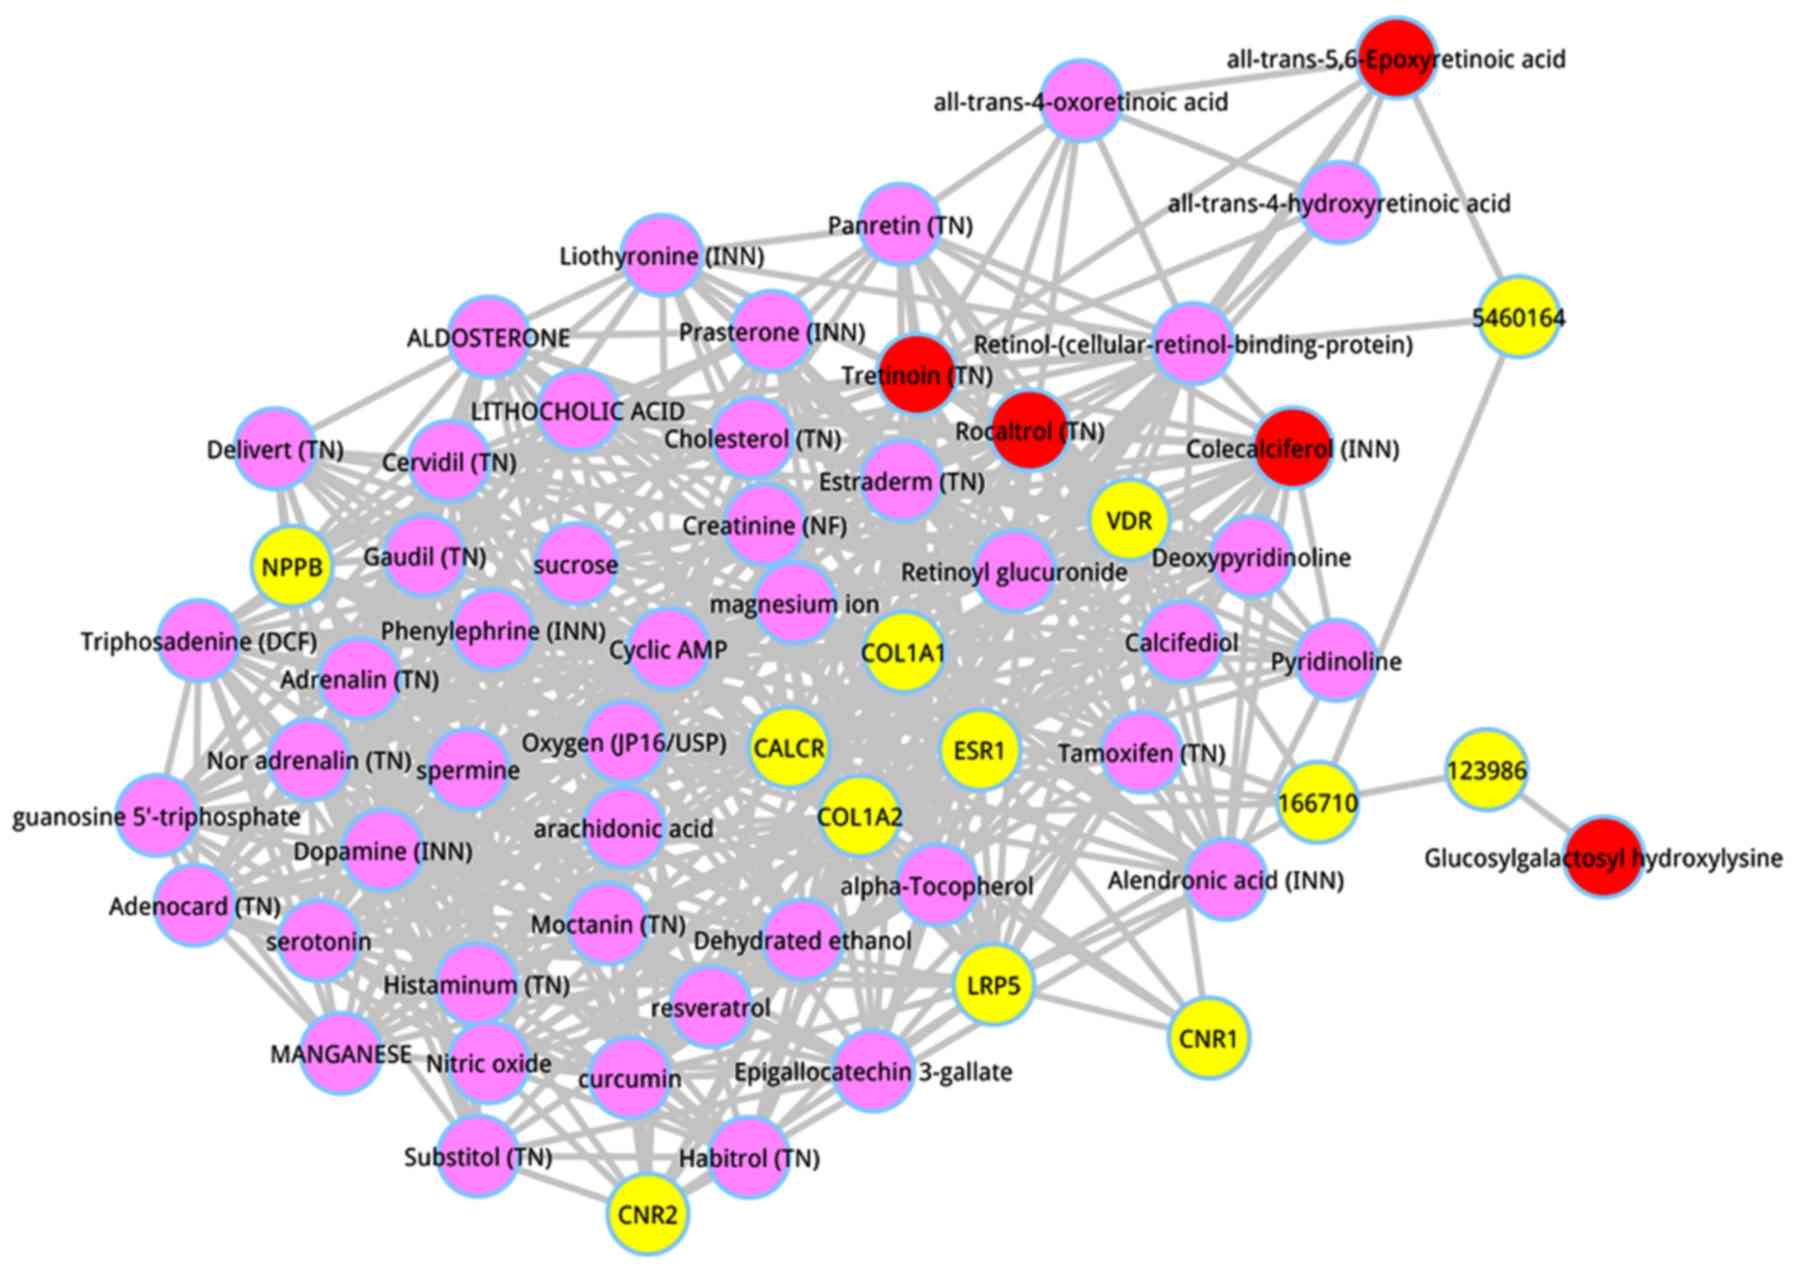
scores. The top 50 metabolites were dissected, and shown in
Table III. The top 5 metabolites
were respectively glucosylgalactosyl hydroxylysine (score =
0.027662), all-trans-5,6-Epoxyretinoic acid (score = 0.008912),
tretinoin (TN) (score = 0.004934), colecalciferol (INN) (score =
0.000686), and rocaltrol (TN) (score = 0.000675). A subnetwork of
the top 50 metabolites was extracted from the whole composite
network, as shown in Fig. 2.
| Table III.The top 50 metabolites. |
Table III.
The top 50 metabolites.
| Metabolite ID | Metabolite
name | Score |
|---|
| 122304 | Glucosylgalactosyl
hydroxylysine | 0.027662 |
| 5363137 |
All-trans-5,6-Epoxyretinoic acid | 0.008912 |
| 444795 | Tretinoin (TN) | 0.004934 |
| 5280795 | Colecalciferol
(INN) | 0.000686 |
| 5280453 | Rocaltrol (TN) | 0.000675 |
| 445354 |
Retinol-(cellular-retinol-binding-protein) | 0.000487 |
| 5757 | Estraderm (TN) | 0.000473 |
| 6076 | Cyclic AMP | 0.000439 |
| 5283731 | Calcifediol | 0.000407 |
| 5280360 | Cervidil (TN) | 0.0004 |
| 439260 | Nor adrenalin
(TN) | 0.000369 |
| 774 | Histaminum
(TN) | 0.000357 |
| 945 | Nitric oxide | 0.000347 |
| 5988 | sucrose | 0.000323 |
| 5839 | Aldosterone | 0.00032 |
| 6437063 |
all-trans-4-oxoretinoic acid | 0.000311 |
| 9903 | Lithocholic
acid | 0.000305 |
| 105071 |
Deoxypyridinoline | 0.000304 |
| 5288826 | Substitol (TN) | 0.000299 |
| 2088 | Alendronic acid
(INN) | 0.000298 |
| 172198 | Delivert (TN) | 0.000296 |
| 702 | Dehydrated
ethanol | 0.000277 |
| 588 | Creatinine
(NF) | 0.000257 |
| 888 | magnesium ion | 0.000256 |
| 6438629 |
all-trans-4-hydroxyretinoic acid | 0.000255 |
| 5202 | serotonin | 0.000254 |
| 65064 | Epigallocatechin
3-gallate | 0.000252 |
| 681 | Dopamine (INN) | 0.00025 |
| 5281877 | Retinoyl
glucuronide | 0.000246 |
| 969516 | curcumin | 0.00024 |
| 449171 | Panretin (TN) | 0.000232 |
| 5957 | Triphosadenine
(DCF) | 0.000231 |
| 105068 | Pyridinoline | 0.000227 |
| 5881 | Prasterone
(INN) | 0.000225 |
| 753 | Moctanin (TN) | 0.000224 |
| 445154 | resveratrol | 0.000222 |
| 14985 | α-Tocopherol | 0.000221 |
| 2733526 | Tamoxifen (TN) | 0.00022 |
| 5816 | Adrenalin (TN) | 0.000218 |
| 977 | Oxygen
(JP16/USP) | 0.000213 |
| 60961 | Adenocard (TN) | 0.00021 |
| 89594 | Habitrol (TN) | 0.000209 |
| 23930 | Manganese | 0.000203 |
| 444899 | arachidonic
acid | 0.000202 |
| 5997 | Cholesterol
(TN) | 0.000201 |
| 77999 | Gaudil (TN) | 0.0002 |
| 1103 | spermine | 0.000198 |
| 6830 | guanosine
5′-triphosphate | 0.000195 |
| 6041 | Phenylephrine
(INN) | 0.000195 |
| 5920 | Liothyronine
(INN) | 0.000192 |
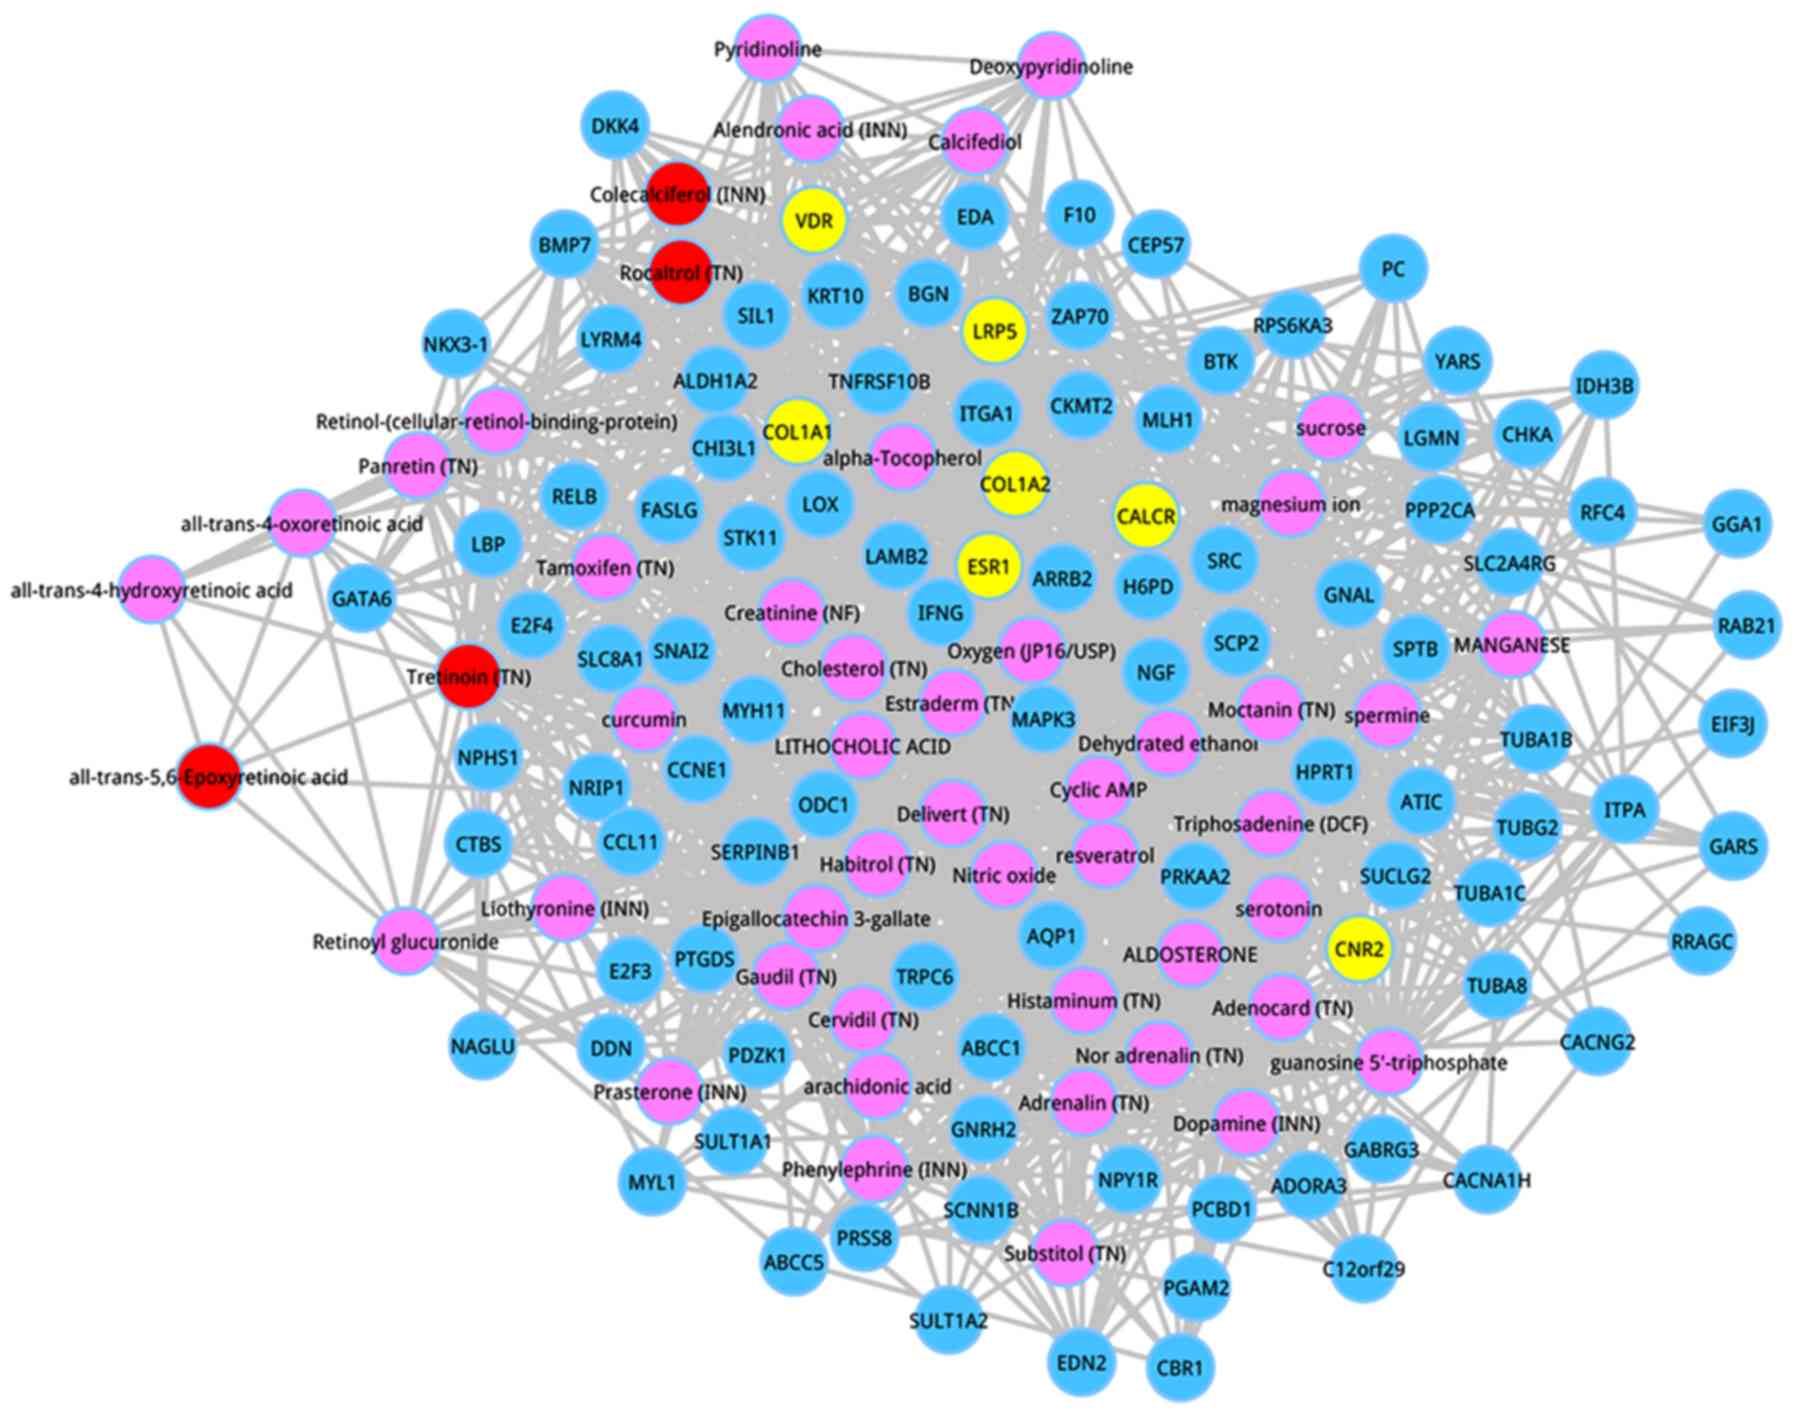
Afterwards, the co-expressed genes were extracted,
which had interactions with the top 50 metabolites according to the
score ranking. On the basis of the pre-defined criteria, the top
100 co-expressed genes were identified, and the co-expressed
network of the top 100 genes are shown in Fig. 3. Following degree analysis for the
co-expressed network, 3 metabolites had a degree >50, including
estraderm (degree = 64), triphosadenine (DCF) (degree = 57), and
tretinoin (TN) (degree = 55). Significantly, tretinoin (TN) was the
member of the top 5 metabolites, and estraderm was a metabolite
with the seventh interaction score.
Discussion
Postmenopausal women have a high incidence of
osteoporosis because of simultaneous existence of many independent
predisposing factors, including estrogen deficiency, calcium loss,
as well as aging (21). Osteoporosis
is a main public health concern globally, particularly in countries
with large aging populations, for example, China (22). Thus, it is urgently needed to seek
for novel effective therapy strategy as well as etiologic
explanations for PO. For a better understanding of the potential
molecular mechanisms of PO, we used a computational method to
extract metabolites signatures in PO by integrating the information
among genes, metabolites, and phenotype related to pathogenesis.
Our study identified several important metabolites between PO and
normal samples, including tretinoin (TN) and estraderm.
Ahmed et al (23) demonstrated that tretinoin can
suppress osteoblast proliferation, and inhibit the production of
alkaline phosphatase, osteocalcin and IL-6 in normal human
osteoblasts. In addition, suppression of IL-6 generation in normal
osteoblasts might contribute to bone abnormalities. Moreover, in
another study, tretinoin has been implicated to be able to activate
the differentiation and proliferation of osteoclasts, thereby
enhancing bone absorption (24). The
imbalance in bone resorption and formation results in bone loss
during aging and osteoporosis (25).
Furthermore, many studies have used tretinoin to construct the
model of osteoporosis (26–28). Thus, we infer that tretinoin is
important for bone absorption and may be a target to suppress bone
loss related to PO.
PO is believed to result directly from the decreased
endogenous estrogen in menopausal women (2). Estraderm is a kind of steroid hormone
that is mainly secreted by ovaries, placenta or testicles, and it
is the most biologically active estrogen. Low concentration
estraderm has been implicated to influence the proliferation and
differentiation of osteoblast in a positive way (29). Estrogens may enhance fractional
gastrointestinal calcium absorption, and an increased calcium
intake might play a role in promoting bone mass (30). Recently, researchers have
demonstrated that the combination of calcium and estrogen results
in a significant increase in bone mass of the femoral neck,
relative to estrogen alone (31). In
addition, increased calcium intake decreases bone loss of
premenopausal women (32,33).
In conclusion, we successfully extracted several
important metabolites in PO on the basis of the combination of
multi-omics data. Significantly, our identified metabolites
(tretinoin and estraderm) are available as biomarkers to diagnose
PO, and our study has established available therapeutic options
(tretinoin and estraderm) for the treatment of PO. However, we must
take several limitations into consideration. Firstly, there are
many gene expression profiles on PO, but we only used E-GEOD-7429
dataset in our analysis. Hence, we will utilize other datasets on
this disease to confirm our results. In addition, we used existing
data to extract candidate metabolite biomarkers based on the
bioinformatics method. Yet, our results have not been verified by
experiments and this remains the main weak point of the present
study. Consequently, future investigations are required to reveal
the changes of these metabolites in the understanding of the
progression procedure in PO based on animal experiments or patient
tissues. Despite these disadvantages, we are satisfied as our
findings could offer some preliminary evidence to reveal the
potential candidate therapeutic strategies for PO. The application
of specific regulation-related metabolites in PO may provide new
insights for preventive and therapeutic strategies.
Acknowledgements
Not applicable.
Funding
No funding was received.
Availability of data and materials
The datasets used and/or analyzed during the present
study are available from the corresponding author on reasonable
request.
Authors' contributions
CZ conceived the study and drafted the manuscript.
YW and CLZ acquired and analyzed the data. HRW conceived the study
and revised the manuscript. All authors read and approved the final
manuscript.
Ethics approval and consent to
participate
Not applicable.
Patient consent for publication
Not applicable.
Competing interests
The authors declare that they have no competing
interests.
References
|
1
|
Marcus R: Post-menopausal osteoporosis.
Best Pract Res Clin Obstet Gynaecol. 16:309–327. 2002. View Article : Google Scholar : PubMed/NCBI
|
|
2
|
Seibel MJ, Dunstan CR, Zhou H, Allan CM
and Handelsman DJ: Sex steroids, not FSH, influence bone mass.
Cell. 127(1079): author reply. 1080–1081. 2006.
|
|
3
|
Kiel DP, Demissie S, Dupuis J, Lunetta KL,
Murabito JM and Karasik D: Genome-wide association with bone mass
and geometry in the Framingham Heart Study. BMC Med Genet. 8 (Suppl
1):S142007. View Article : Google Scholar : PubMed/NCBI
|
|
4
|
Xiao SM, Gao Y, Cheung CL, Bow CH, Lau KS,
Sham PC, Tan KCB and Kung AWC: Association of CDX1 binding site of
periostin gene with bone mineral density and vertebral fracture
risk. Osteoporos Int. 23:1877–1887. 2012. View Article : Google Scholar : PubMed/NCBI
|
|
5
|
Chen Y and Xia RG: Screening and
functional microarray analysis of differentially expressed genes
related to osteoporosis. Genet Mol Res. 13:3228–3236. 2014.
View Article : Google Scholar : PubMed/NCBI
|
|
6
|
Jemtland R, Holden M, Reppe S, Olstad OK,
Reinholt FP, Gautvik VT, Refvem H, Frigessi A, Houston B and
Gautvik KM: Molecular disease map of bone characterizing the
postmenopausal osteoporosis phenotype. J Bone Miner Res.
26:1793–1801. 2011. View
Article : Google Scholar : PubMed/NCBI
|
|
7
|
Xiao P, Chen Y, Jiang H, Liu YZ, Pan F,
Yang TL, Tang ZH, Larsen JA, Lappe JM, Recker RR, et al: In vivo
genome-wide expression study on human circulating B cells suggests
a novel ESR1 and MAPK3 network for postmenopausal osteoporosis. J
Bone Miner Res. 23:644–654. 2008. View Article : Google Scholar : PubMed/NCBI
|
|
8
|
Ma M, Chen X, Lu L, Yuan F, Zeng W, Luo S,
Yin F and Cai J: Identification of crucial genes related to
postmenopausal osteoporosis using gene expression profiling. Aging
Clin Exp Res. 28:1067–1074. 2016. View Article : Google Scholar : PubMed/NCBI
|
|
9
|
Fiehn O: Metabolomics - the link between
genotypes and phenotypes. Plant Mol Biol. 48:155–171. 2002.
View Article : Google Scholar : PubMed/NCBI
|
|
10
|
Nicholson JK and Lindon JC: Systems
biology: Metabonomics. Nature. 455:1054–1056. 2008. View Article : Google Scholar : PubMed/NCBI
|
|
11
|
Nicholson JK and Wilson ID: Opinion:
understanding ‘global’ systems biology: metabonomics and the
continuum of metabolism. Nat Rev Drug Discov. 2:668–676. 2003.
View Article : Google Scholar : PubMed/NCBI
|
|
12
|
Yao Q, Xu Y, Yang H, Shang D, Zhang C,
Zhang Y, Sun Z, Shi X, Feng L, Han J, et al: Global prioritization
of disease candidate metabolites based on a multi-omics composite
network. Sci Rep. 5:172012015. View Article : Google Scholar : PubMed/NCBI
|
|
13
|
Benjamini Y, Drai D, Elmer G, Kafkafi N
and Golani I: Controlling the false discovery rate in behavior
genetics research. Behav Brain Res. 125:279–284. 2001. View Article : Google Scholar : PubMed/NCBI
|
|
14
|
Xia J and Wishart DS: MSEA: A web-based
tool to identify biologically meaningful patterns in quantitative
metabolomic data. Nucleic Acids Res 38 (Web Server). W71–7. 2010.
View Article : Google Scholar
|
|
15
|
Jewison T, Su Y, Disfany FM, Liang Y, Knox
C, Maciejewski A, Poelzer J, Huynh J, Zhou Y, Arndt D, et al: SMPDB
2.0: Big improvements to the Small Molecule Pathway Database.
Nucleic Acids Res. 42(D1): D478–D484. 2014. View Article : Google Scholar : PubMed/NCBI
|
|
16
|
Kuhn M, Szklarczyk D, Franceschini A,
Campillos M, von Mering C, Jensen LJ, Beyer A and Bork P: STITCH 2:
An interaction network database for small molecules and proteins.
Nucleic Acids Res. 38 (Suppl_1):D552–D556. 2010. View Article : Google Scholar : PubMed/NCBI
|
|
17
|
van Driel MA, Bruggeman J, Vriend G,
Brunner HG and Leunissen JA: A text-mining analysis of the human
phenome. Eur J Hum Genet. 14:535–542. 2006. View Article : Google Scholar : PubMed/NCBI
|
|
18
|
Wishart DS, Knox C, Guo AC, Eisner R,
Young N, Gautam B, Hau DD, Psychogios N, Dong E, Bouatra S, et al:
HMDB: A knowledgebase for the human metabolome. Nucleic Acids Res
37 (Database). D603–D610. 2009. View Article : Google Scholar
|
|
19
|
Amberger JS, Bocchini CA, Schiettecatte F,
Scott AF and Hamosh A: OMIM.org: Online Mendelian Inheritance in
Man (OMIM®), an online catalog of human genes and
genetic disorders. Nucleic Acids Res. 43(D1): D789–D798. 2015.
View Article : Google Scholar : PubMed/NCBI
|
|
20
|
Wu X, Jiang R, Zhang MQ and Li S:
Network-based global inference of human disease genes. Mol Syst
Biol. 4:1892008. View Article : Google Scholar : PubMed/NCBI
|
|
21
|
Paul TV, Thomas N, Seshadri MS, Oommen R,
Jose A and Mahendri NV: Prevalence of osteoporosis in ambulatory
postmenopausal women from a semiurban region in Southern India:
relationship to calcium nutrition and vitamin D status. Endocr
Pract. 14:665–671. 2008. View Article : Google Scholar : PubMed/NCBI
|
|
22
|
Feng Z, Liu C, Guan X and Mor V: China's
rapidly aging population creates policy challenges in shaping a
viable long-term care system. Health Aff (Millwood). 31:2764–2773.
2012. View Article : Google Scholar : PubMed/NCBI
|
|
23
|
Ahmed N, Sammons J, Khokher MA and Hassan
HT: Retinoic acid suppresses interleukin 6 production in normal
human osteoblasts. Cytokine. 12:289–293. 2000. View Article : Google Scholar : PubMed/NCBI
|
|
24
|
Xu P, Guo X, Yao JF, Cai QK and Li YF: The
effect and the mechanism of osteoporotic model female rats induced
by retinoic acid. Orthopedic J China. 10:995–998. 2001.(In
Chinese).
|
|
25
|
Shiraishi A, Takeda S, Masaki T, Higuchi
Y, Uchiyama Y, Kubodera N, Sato K, Ikeda K, Nakamura T, Matsumoto
T, et al: Alfacalcidol inhibits bone resorption and stimulates
formation in an ovariectomized rat model of osteoporosis: Distinct
actions from estrogen. J Bone Miner Res. 15:770–779. 2000.
View Article : Google Scholar : PubMed/NCBI
|
|
26
|
Ma Y, Xu Y and Qian Z: The changes of
hepcidin in tretinoin-induced osteoporosis in rats. Jiangsu Med J.
8:0272008.
|
|
27
|
Chen Q, Xiong Y, Wang Z, Xue L and Wang L:
Osteoporosis model of rats caused by tretinoin acid and
experimental study on effects of gallium salts on apoptosis,
contents of DNA, molecular weight of DNA and lipid peroxidation.
Zhong Guo Di Fang Bing Fang Zhi Za Zhi. 19:68–70. 2003.(In
Chinese).
|
|
28
|
Dai X, Xiong Y, Wang Z, Lei Y, Zuo H and
Xue L: Experimental study on effect of gallium salt and estradiol
on bone metabolism in tretinoin-induced osteoporosis of rats. J
Xi'an Med University. 3:215–217. 2001.(In Chinese).
|
|
29
|
Yu S-J, Huang XY, Wang CH, Shan WL, Zhu GX
and Liu HC: Effect of low-concentration estradiol on proliferation
and differentiation of osteoblasts from jaws of osteoporotic rats.
Chin J Prosthodontics. 1:17–21. 2016.(In Chinese).
|
|
30
|
Lindsay R, Bush TL, Grady D, Speroff L and
Lobo RA: Therapeutic controversy: Estrogen replacement in
menopause. J Clin Endocrinol Metab. 81:3829–3838. 1996. View Article : Google Scholar : PubMed/NCBI
|
|
31
|
Haines CJ, Chung TK, Leung PC, Hsu SY and
Leung DH: Calcium supplementation and bone mineral density in
postmenopausal women using estrogen replacement therapy. Bone.
16:529–531. 1995. View Article : Google Scholar : PubMed/NCBI
|
|
32
|
Nowson CA, Green RM, Hopper JL, Sherwin
AJ, Young D, Kaymakci B, Guest CS, Smid M, Larkins RG and Wark JD:
A co-twin study of the effect of calcium supplementation on bone
density during adolescence. Osteoporos Int. 7:219–225. 1997.
View Article : Google Scholar : PubMed/NCBI
|
|
33
|
Nieves JW, Golden AL, Siris E, Kelsey JL
and Lindsay R: Teenage and current calcium intake are related to
bone mineral density of the hip and forearm in women aged 30–39
years. Am J Epidemiol. 141:342–351. 1995. View Article : Google Scholar : PubMed/NCBI
|