Introduction
Cardiovascular disease (CVD) causes ~17.3 million
deaths per year globally and remains the main cause of mortality in
the world (1). Acute coronary
syndromes (ACSs) range from unstable angina (UA) to myocardial
infarction (MI). UA is a common clinical symptom of atherosclerosis
without myocardial necrosis, is related to the increased risk of
cardiac death, and leads to MI (2).
However, the diagnostic accuracy for UA is unsatisfactory in
clinical practice. The mortality of MI in the USA has decreased,
partly because of the earlier diagnosis and the reliable
revascularization therapy (3). For
instance, troponin, a biomarker of myocardial damage, maximizes the
benefits of revascularization therapy. Nevertheless, because of the
relative ‘delayed’ release time of troponin, earlier biochemical
signatures having high sensitivity as well as specificity are
urgently needed to reduce the MI mortality (4). Thus, new thoughts are warranted to
develop efficient diagnosis and optimal therapeutics for UA/MI.
Traditionally, one method is the identification of
differentially expressed genes (DEGs). However, this approach only
offers limited information on the progression of the disease. There
is little concordance among different microarray studies, due to
the heterogeneity of the tissue samples or insufficient power
(5). Significantly, a gene can be
connected to other genes which share similar expression profiles.
Systems biology concentrates on complicated interactions in
biological systems by means of a holistic approach to biological
research (6,7). Network biology, a branch of the systems
biology, is a new way of analyzing biological processing, which
regards life as a network. Differential co-expression network (DCN)
has been demonstrated to be a new holistic approach for analyzing
microarrays (8,9). For instance, Stuart et al
(10) established a gene
co-expression network which linked to genes whose microarray data
were similar among different organisms. Lee et al (8) analyzed a human network based on
functional grouping as well as cluster analysis.
Importantly, pathway-based analysis plays key roles
in capturing the biological interaction among genes, and improving
power and robustness (11,12). Thus, exploring the biological
pathways relying on systems biology techniques can provide
extensive insights into the components of pathways, thereby aiding
in developing novel targets for diseases. However, previous studies
have mainly focused on the single dysregulated pathways based on
the pre-defined threshold (13,14).
Pathways having significant P-values did not have biological
meaning, but several pathways possessing non-significant P-values
are statistically significant and biological meaningful (15). Based on the variants of
‘guilt-by-association (GBA)’, gene pathway predictions can be made
with very high statistical confidence (16,17).
Thus, in our analysis, we downloaded the gene
expression profile of the blood samples of patients with MI or UA
to identify the optimal pathways which can provide comprehensive
information for UA/MI development. DEGs between UA and MI were
extracted using LIMMA package, and pathway enrichment analysis was
conducted for the DEGs, based on the DAVID tool, to detect the
significant pathways. Then, DCN and sub-DCN for the DEGs were
constructed. KEGG pathways were extracted based on the known
pathway database and DEGs. Subsequently, we predicted informative
pathways using the GBA principle, relying on the area under the
curve (AUC), and the pathway categories with AUC>0.8 were
defined as the informative pathways. Finally, we selected the
optimal pathways based on the traditional pathway analysis and
sub-DCN-based-GBA pathway prediction method.
Materials and methods
Gene expression profile and data
pretreatment
Gene expression profiles of the whole blood of 26
patients with ACS, obtained at 7 and 30 days post-ACS, were
downloaded from Gene Expression Omnibus (GEO): GSE29111 (https://www.ncbi.nlm.nih.gov/geo/query/acc.cgi?acc=GSE29111).
GSE29111 dataset includes the data of 8 patients with UA and 18
with MI. The samples in GSE29111 were taken at two different
time-points: time-point 1 (7th day) and time-point 2 (30th
day).
Before the analysis, the microarray profiles of
GSE29111 data were first processed on the GPL570 platform of
Affymetrix Human Genome U133 Plus 2.0 Array (Affymetrix; Thermo
Fisher Scientific, Inc., Waltham, MA, USA).
Next, the data were normalized based on the Robust
Multi-array Average (RMA) method (18), and then the data in the CEL files
were converted into expression values. Probes were aligned to human
genes, and finally, 20,514 genes remained for subsequent
investigation.
Detection of DEGs
In our study, LIMMA package of R language
(http://bioconductor.org/biocLite.R)
as well as t-test were utilized to compare the gene expression
levels in time-point 1 and time-point 2 groups in order to further
identify the DEGs in MI samples comparing with UAs. logFC was used
for the differential expression degree. We processed the original
data based on log2 transformation using SPSS 17.0 (SPSS, Inc.,
Chicago, IL, USA). All expression scores were turned into
fold-changes (FC) with log2 base (logFC). The logFC for each gene
was defined as log(MI)-log(UA), and then the distribution of the
logFC value for each gene was obtained. The original P-values were
adjusted using the method of Benjamini et al (19), which relies on the false discovery
rate (FDR) concept. Genes were considered statistically
significantly expressed when FDR<0.01 and |logFC| >1.
Pathway analysis of DEGs using
DAVID
To investigate the potential biological functions of
DEGs, we used DAVID (http://david.abcc.ncifcrf.gov/) (20) to implement the traditional pathway
analysis based on KEGG pathway database (https://www.kegg.jp/) by means of the Expression
Analysis Systematic Explorer (EASE) test (21). The threshold of identifying
significant pathways was FDR=0.001.
Construction of DCN
The co-expression network approach, proposed by Ruan
et al (22), was utilized to
construct DCN by investigating the pairwise expression similarity
between DEGs. The co-expression network with 0 refers to no link
between two DEGs, and 1 corresponds to a connection between the
DEGs. Nodes in the DCN are genes and the edges stand for expression
similarities between any two genes. In our study, Spearman
correlation coefficient (SCC) was used to measure the similarity,
and to assess the co-expressed strength of each edge in the DCN. We
defined the SCC absolute value of an edge as the weight of the
corresponding interaction. If the correlation coefficient of the
two DEGs is >0.3, these two DEGs are regarded to be
co-expressed. In the present study, we only selected the edges with
weight value >0.8 to construct the sub-DCN, which was visualized
using Cytoscape tool (https://www.softpedia.com/get/Science-CAD/Cytoscape.shtml).
KEGG annotation for DEGs
KEGG is a reference knowledge database which can
provide better understanding of the biological processes. To begin
with, we downloaded a total of 300 background pathways (6,919
genes) from KEGG database. Next, the above identified DEGs were
mapped to 300 pathway terms to extract the DEG-related pathways. In
the end, the pathway set was obtained in time-point 1 and
time-point 2 groups, consisting of 203 DEGs and 81 pathways in
time-point 1 group, and 266 DEGs as well as 47 pathways in
time-point 2 group.
Informative pathways prediction using
the GBA principle
Subsequently, we used GBA principle for the sub-DCN
to further extract significant biological pathways in these two
time-point groups. For each gene within the sub-DCN, all neighbored
genes of this specific gene were aligned to each pathway category,
and the multifunctionality (MF) value for each gene involved in the
given pathway term was computed.
The AUC value for each pathway category was measured
using the Support Vector Machine (SVM), and then the mean AUC
across all pathway terms was obtained. Afterwards, we ranked all
the pathway terms based on the AUC values. In literature,
AUC>0.7 is good for gene function prediction (23). In the present study, we predicted the
informative pathway terms when AUC was set as >0.8.
Identifying the optimal pathways
The final optimal pathways were identified based on
the traditional pathway analysis and sub-DCN-based-GBA pathway
prediction method.
Results
Time-point 2 group influences more
DEGs compared to time-point 1 group
Our analyses were focused on the comparison of two
matched sets of blood samples (UA vs. MI) obtained at two different
time-points. Therefore, a total of 20,514 genes remained to be used
for the following comparisons after quality control.
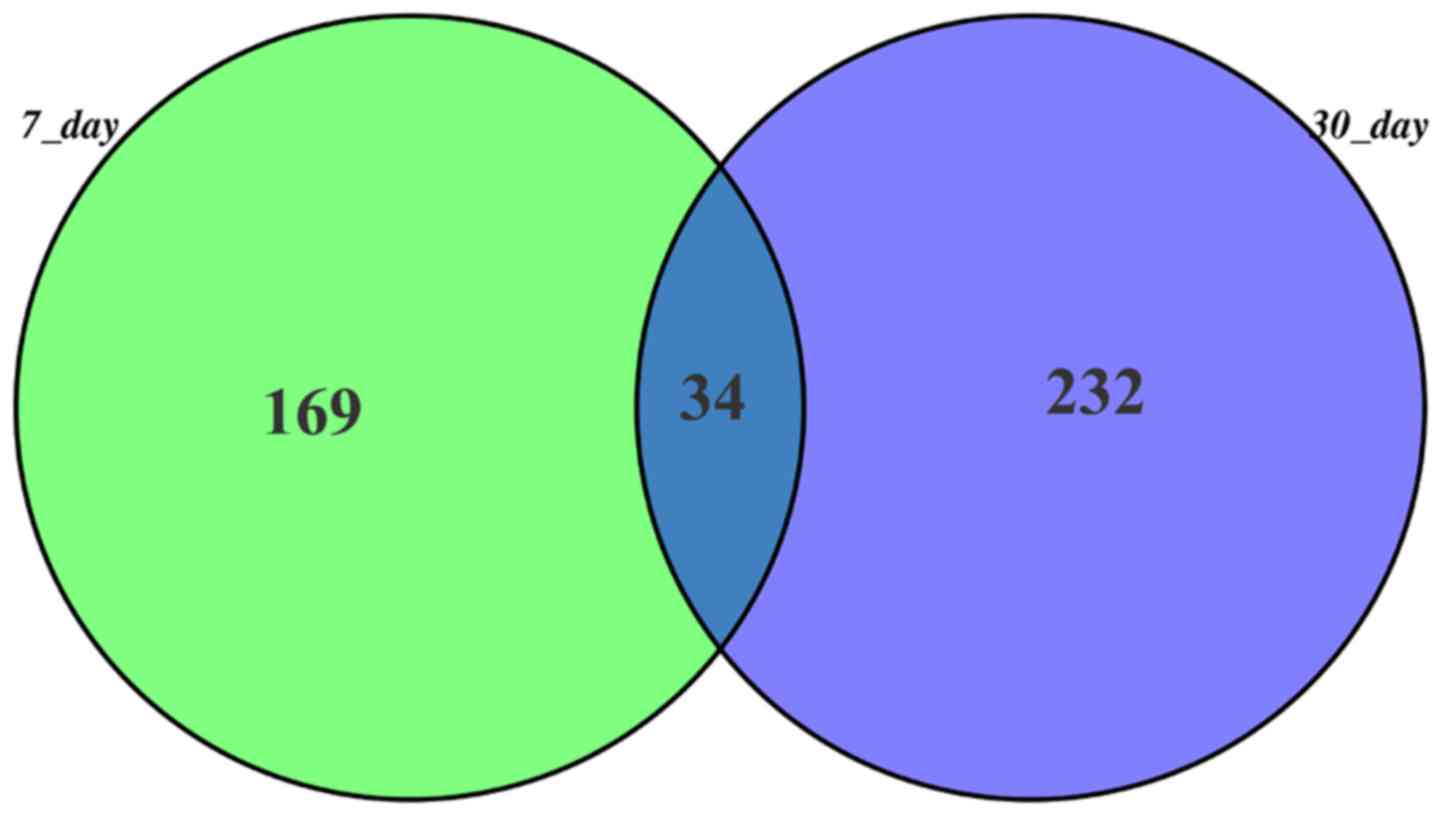
Based on the filtering criteria of FDR<0.01 and
|logFC| >1, there were 203 and 266 DEGs in the expression
profile of blood of MI samples comparing with UAs in time-point 1
and time-point 2 groups, respectively. Also, there were 34 common
genes in these two groups (Fig.
1).
Pathway enrichment analysis of DEGs
using DAVID
When FDR was set as <0.001, a total of 6
significant pathways were identified in the time-point 1 group, and
there were 8 significant pathways in the time-point 2 group. The
differential pathways in the two groups are shown in Table I. We found that there were 3 common
significant pathways in these two time groups, including
neuroactive ligand-receptor interaction, cytokine-cytokine receptor
interaction, and MAPK signaling pathway.
 | Table I.Significant pathways identified based
on traditional pathway analysis. |
Table I.
Significant pathways identified based
on traditional pathway analysis.
| Time-point 1
group | Time-point 2
group |
|---|
| Fructose and mannose
metabolism | Metabolic
pathways |
| Transcriptional
misregulation in cancer | Cytosolic DNA-sensing
pathway |
| MAPK signaling
pathway | Cytokine-cytokine
receptor interaction |
| Alanine, aspartate
and glutamate metabolism | Neuroactive
ligand-receptor interaction |
| Neuroactive
ligand-receptor interaction | Toll-like receptor
signaling pathway |
| Cytokine-cytokine
receptor interaction | MAPK signaling
pathway |
|
| Chemokine signaling
pathway |
|
| Calcium signaling
pathway |
Construction of DCN and sub-DCN
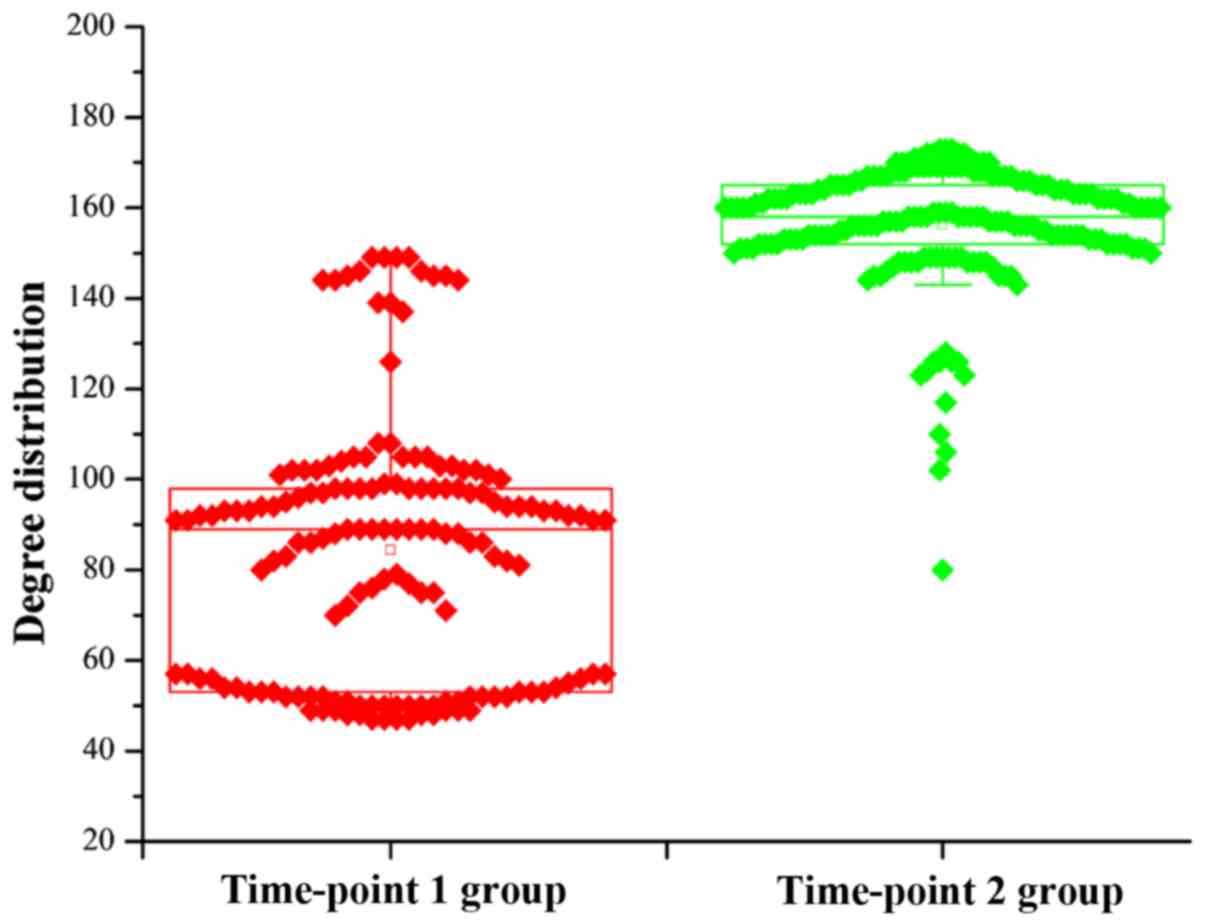
Two DCNs were established for time-point 1 and
time-point 2 groups by means of the DEGs identified above. In the
DCN of time-point 1 group, there were 153 nodes, and in the DCN of
the time-point 2 group there were 197 nodes. In the circumstance of
network, the degree can explain the network structure.
Consequently, the topological degree characteristics for each node
in the DCN was investigated, and the degree distribution of all
genes is shown in Fig. 2. It is
obvious that the degrees for the DCN in the time-point 2 group were
greater than those in the time-point 1 group. Aside from the degree
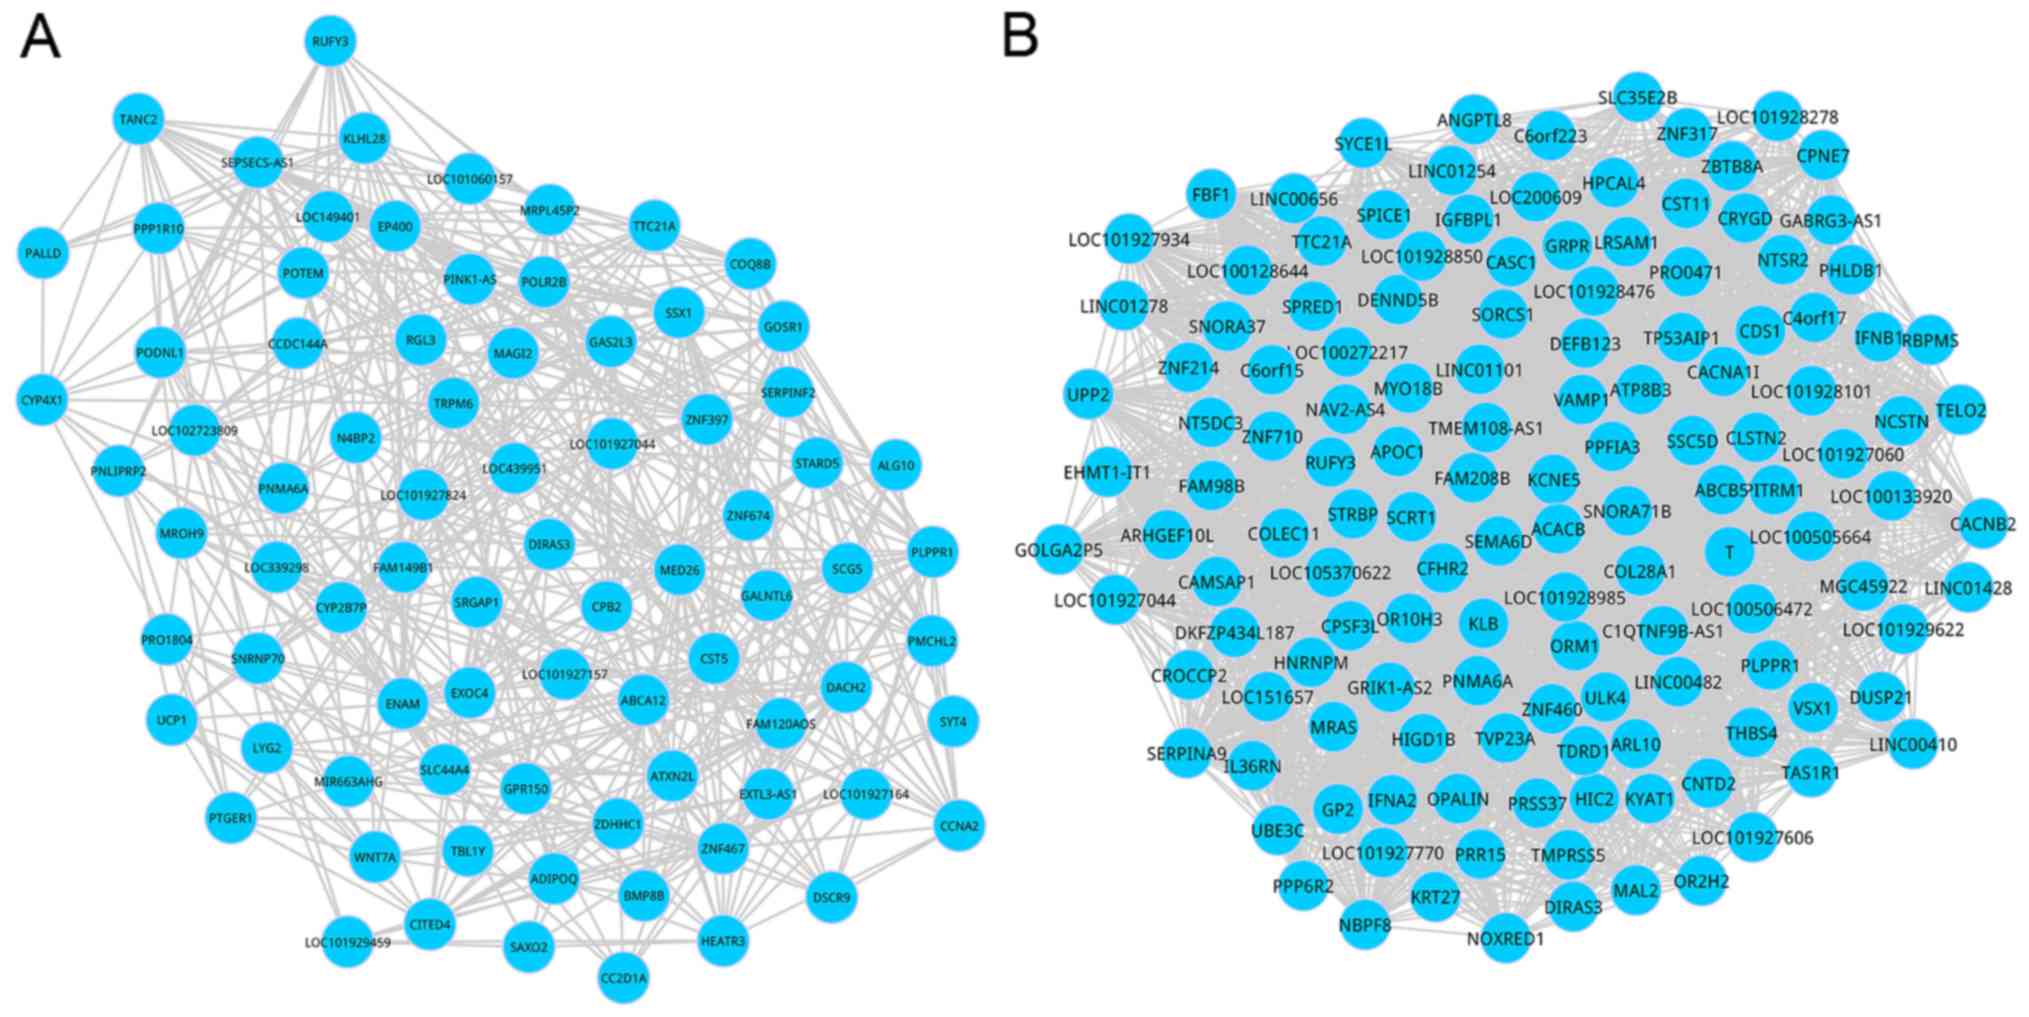
connectivity, another significant parameter was the interaction
strength which could be used to measure the interactions in the
DCN. Consequently, SCC was utilized to assign a weight value to
every edge of the DCN, and the interactions having weight values
>0.8 were extracted to build the sub-DCN. The composition of the
sub-DCNs is demonstrated in Fig. 3.
Within the sub-DCNs, 80 nodes and 705 interactions were involved in
the time-group 1, and there were 135 nodes and 2,836 interactions
in the time-group 2.
Informative pathways using GBA
prediction
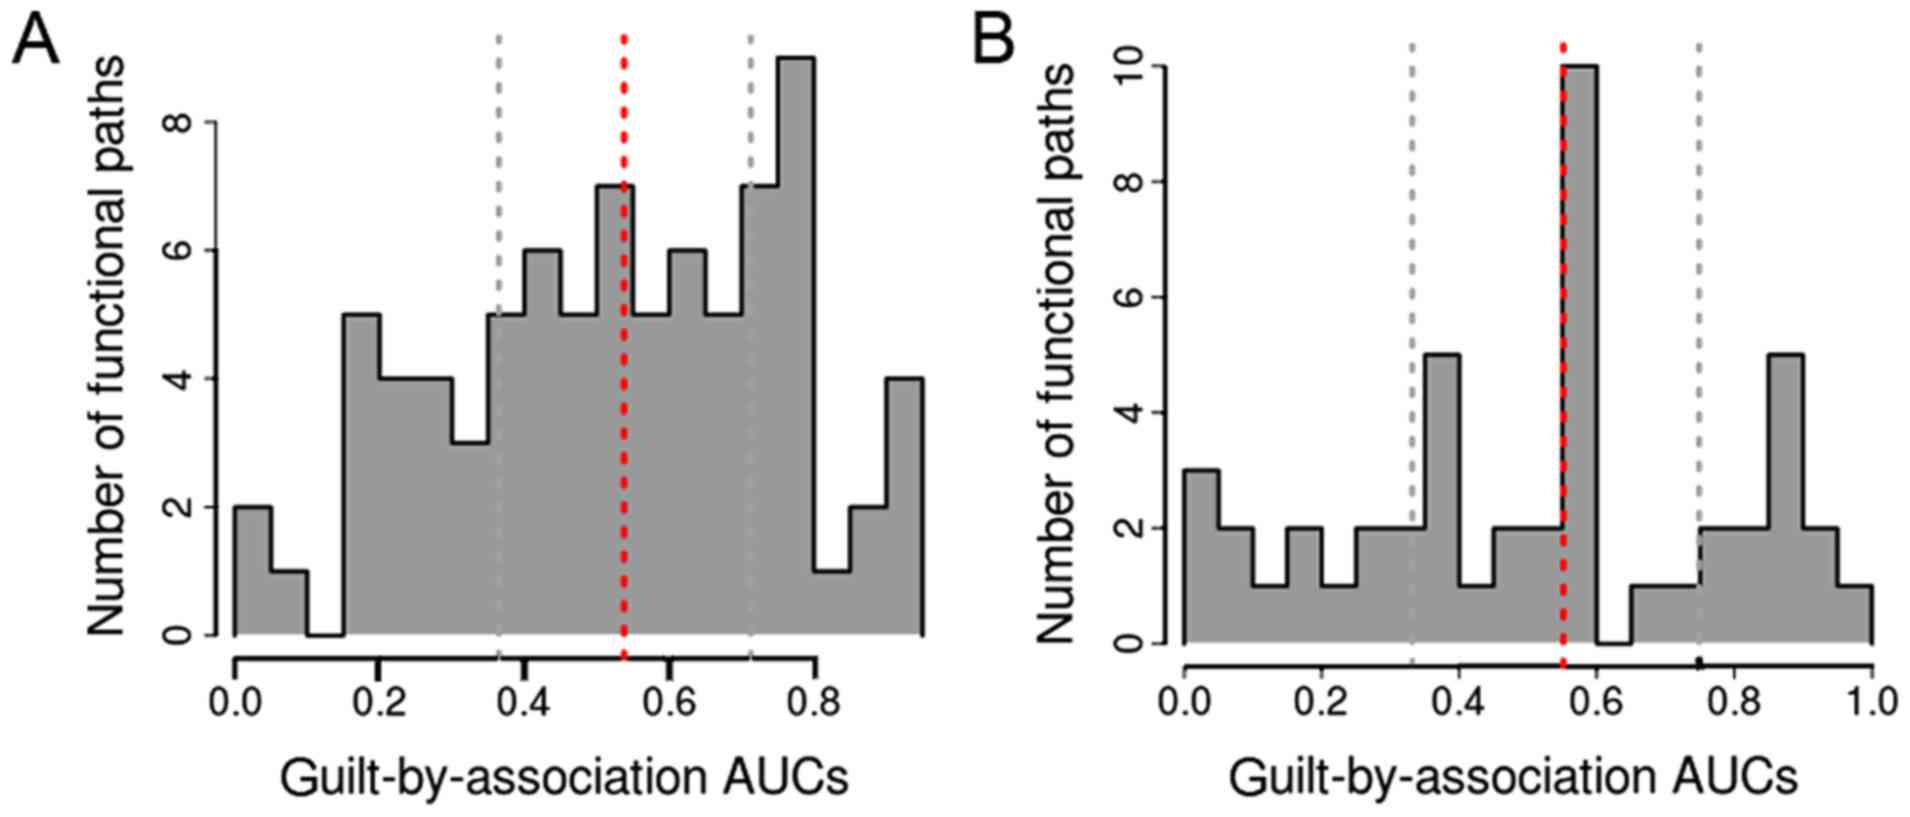
Fig. 4 shows the AUC
distribution for the pathway categories. There were 23 and 13
pathway terms in the time-point 1 and time-point 2 groups,
respectively, based on AUC>0.7. Among these pathway terms, there
were 7 and 10 pathway terms, respectively, with AUC>0.8, and
these pathways were determined as the informative pathways
(Table II).
| Table II.Pathway list based on AUC>0.8. |
Table II.
Pathway list based on AUC>0.8.
| Time-point 1
group | Time-point 2
group |
|---|
| Phosphatidylinositol
signaling system (AUC=0.941) | Arginine and proline
metabolism (AUC=0.972) |
| Cytosolic DNA-sensing
pathway (AUC=0.930) | MAPK signaling
pathway (AUC=0.924) |
| Cytokine-cytokine
receptor interaction (AUC=0.929) | Olfactory
transduction (AUC=0.900) |
| Adrenergic signaling
in cardiomyocytes (AUC=0.900) | Pancreatic secretion
(AUC=0.879) |
| MAPK signaling
pathway (AUC=0.885) | Purine metabolism
(AUC=0.860) |
| Regulation of actin
cytoskeleton (AUC=0.860) | Fructose and mannose
metabolism - Homo sapiens (AUC=0.854) |
| Wnt signaling
pathway (AUC=0.821) | Amino sugar and
nucleotide sugar metabolism (AUC=0.854) |
|
| Cytokine-cytokine
receptor interaction (AUC=0.853) |
|
| Phagosome
(AUC=0.823) |
|
| Calcium signaling
pathway (AUC=0.815) |
Identifying the optimal pathways
The ultimate optimal pathways were screened out
based on the traditional pathway analysis and sub-DCN-based-GBA
pathway prediction method. A total of 2 optimal pathways were
identified in the time-point 1 group, including cytokine-cytokine
receptor interaction, and MAPK signaling pathway. Also, there were
3 optimal pathways in the time-point 2 group, including MAPK
signaling pathway, calcium signaling pathway, and cytokine-cytokine
receptor interaction. Based on these results, we found that
cytokine-cytokine receptor interaction, as well as MAPK signaling
pathway were the common optimal ones in these two groups. Calcium
signaling pathway was unique to the whole blood of patients with
ACS obtained at 30 days post-ACS.
Discussion
In the present study, microarray data of whole blood
samples from ACS patients were analyzed using the integrated
strategy. A total of 203 and 266 DEGs were identified from the
expression profile of blood of MI samples comparing with UAs in the
time-point 1 and time-point 2 groups. Moreover, 7 and 10
informative pathway terms, respectively, were identified based on
AUC>0.8. Finally, cytokine-cytokine receptor interaction, as
well as MAPK signaling pathway were the common optimal pathways in
these two groups. Calcium signaling pathway was unique to the whole
blood of patients with ACS taken at 30 days post-ACS, and none was
unique to the whole blood of patients with ACS obtained at 7 days
post-ACS.
The pathway of MAPK signaling was common in the two
groups, which is associated with immune responses. The functions of
inflammation in ACS patients have been implicated previously
(24). Inflammation is able to cause
biochemical responses (25) and then
trigger MAPK, which plays important roles through phosphorylating
intracellular substrates, thereby mediating signal transduction, as
well as specific genetic responses to extracellular stimuli
(26). MAPK activation in UA to a
complete MAPK activation in MI, has been proved effective as a
diagnostic test to discern the difference between ACS conditions
(27). Accordingly, MAPK is a
valuable molecular biomarker serving as specific signature for the
diagnosis of UA/MI.
The pathway of cytokine-cytokine receptor
interaction was common in the two groups of our study. Cytokines
are extracellular molecules that transmit intercellular signals,
and they are broadly reported in cell differentiation, as well as
inflammatory response through binding to specific receptors on the
cell surface (28). Various
cytokines associated with inflammation, for example, tumor necrosis
factor, interleukin-8, adhesion molecules, and nuclear factor-κB
play crucial roles in the development process of ACS (29). Elevated level of interleukin-8 has
been demonstrated to be linked to an increased risk of coronary
artery disease (30). Accordingly,
the role of the pathway of cytokine-cytokine receptor interaction
is confirmed in the progression of ACS, partially through
regulating inflammatory response.
Interestingly, calcium signaling pathway appeared in
the whole blood of patients with ACS collected at 30 days post-ACS.
Calcium, a universal intracellular second messenger, participates
in regulating diverse functions including fertilization, secretion,
gene transcription, and cardiac myocytes. Several studies have
implicated that calcium rises during MI (31,32).
Nevertheless, decreased cell coupling would result in arrhythmias
(33). Garcia-Dorado et al
(34) have demonstrated that
developing available and reliable treatments to restrain
Ca2+-mediated cardiomyocyte death in patients with MI,
through regulating the Ca2+ influx, or intracellular
Ca2+ handling, is an important therapeutic implication.
Demonstrated here, our result suggests that calcium signaling
pathway is related to the development of ACS.
There were several limitations in this study.
Limited number of samples might lead to biased estimates. In
addition, only a bioinformatics strategy was utilized, and yet we
have not proven our conclusions using any lab experiments. Despite
these shortcomings, our analysis could provide key implications for
the molecular mechanisms of ACS, but further research is necessary
to validate our findings on the basis of lab techniques.
In conclusion, the identified optimal pathways might
be important for revealing the development progress of ACS. Further
research is needed to explore the underlying mechanisms for the ACS
progression using animal models.
Acknowledgements
Not applicable.
Funding
No funding was received.
Availability of data and materials
The datasets used and/or analyzed during the present
study are available from the corresponding author on reasonable
request.
Authors' contributions
SZG drafted the manuscript and analyzed the data;
WJL conceived the study and revised the manuscript. Both authors
read and approved the final manuscript.
Ethics approval and consent to
participate
Not applicable.
Patient consent for publication
Not applicable.
Competing interests
The authors declare that they have no competing
interests.
References
|
1
|
Mozaffarian D, Benjamin EJ, Go AS, Arnett
DK, Blaha MJ, Cushman M, de Ferranti SD, Després JP, Fullerton HJ,
Howard VJ, et al American Heart Association Statistics Committee
and Stroke Statistics Subcommittee, : Heart disease and stroke
statistics – 2015 update: A report from the American Heart
Association. Circulation. 131:e29–322. 2015. View Article : Google Scholar : PubMed/NCBI
|
|
2
|
Wright RS, Anderson JL, Adams CD, Bridges
CR, Casey DE Jr, Ettinger SM, Fesmire FM, Ganiats TG, Jneid H,
Lincoff AM, et al: 2011 ACCF/AHA focused update of the Guidelines
for the Management of Patients with Unstable
Angina/Non-ST-Elevation Myocardial Infarction (updating the 2007
guideline): A report of the American College of Cardiology
Foundation/American Heart Association Task Force on Practice
Guidelines developed in collaboration with the American College of
Emergency Physicians, Society for Cardiovascular Angiography and
Interventions, and Society of Thoracic Surgeons. J Am Coll Cardiol.
57:1920–1959. 2011. View Article : Google Scholar : PubMed/NCBI
|
|
3
|
Yeh RW, Sidney S, Chandra M, Sorel M,
Selby JV and Go AS: Population trends in the incidence and outcomes
of acute myocardial infarction. N Engl J Med. 362:2155–2165. 2010.
View Article : Google Scholar : PubMed/NCBI
|
|
4
|
Van de Werf F, Ardissino D, Betriu A,
Cokkinos DV, Falk E, Fox KA, Julian D, Lengyel M, Neumann FJ,
Ruzyllo W, et al Task Force on the Management of Acute Myocardial
Infarction of the European Society of Cardiology, : Management of
acute myocardial infarction in patients presenting with ST-segment
elevation. The Task Force on the Management of Acute Myocardial
Infarction of the European Society of Cardiology. Eur Heart J.
24:28–66. 2003. View Article : Google Scholar : PubMed/NCBI
|
|
5
|
Louwen F, Muschol-Steinmetz C, Reinhard J,
Reitter A and Yuan J: A lesson for cancer research: Placental
microarray gene analysis in preeclampsia. Oncotarget. 3:759–773.
2012. View Article : Google Scholar : PubMed/NCBI
|
|
6
|
Wang B, Huang DS and Jiang C: A new
strategy for protein interface identification using manifold
learning method. IEEE Trans Nanobioscience. 13:118–123. 2014.
View Article : Google Scholar : PubMed/NCBI
|
|
7
|
Xia JF, Zhao XM, Song J and Huang DS:
APIS: Accurate prediction of hot spots in protein interfaces by
combining protrusion index with solvent accessibility. BMC
Bioinformatics. 11:1742010. View Article : Google Scholar : PubMed/NCBI
|
|
8
|
Lee HK, Hsu AK, Sajdak J, Qin J and
Pavlidis P: Coexpression analysis of human genes across many
microarray data sets. Genome Res. 14:1085–1094. 2004. View Article : Google Scholar : PubMed/NCBI
|
|
9
|
van Noort V, Snel B and Huynen MA: The
yeast coexpression network has a small-world, scale-free
architecture and can be explained by a simple model. EMBO Rep.
5:280–284. 2004. View Article : Google Scholar : PubMed/NCBI
|
|
10
|
Stuart JM, Segal E, Koller D and Kim SK: A
gene-coexpression network for global discovery of conserved genetic
modules. Science. 302:249–255. 2003. View Article : Google Scholar : PubMed/NCBI
|
|
11
|
Tilford CA and Siemers NO: Gene set
enrichment analysis. Methods Mol Biol. 563:99–121. 2009. View Article : Google Scholar : PubMed/NCBI
|
|
12
|
Curtis RK, Oresic M and Vidal-Puig A:
Pathways to the analysis of microarray data. Trends Biotechnol.
23:429–435. 2005. View Article : Google Scholar : PubMed/NCBI
|
|
13
|
Zhang T, Zhao LL, Zhang ZR, Fu PD, Su ZD,
Qi LC, Li XQ and Dong YM: Interaction network analysis revealed
biomarkers in myocardial infarction. Mol Biol Rep. 41:4997–5003.
2014. View Article : Google Scholar : PubMed/NCBI
|
|
14
|
Bu X, Wang B, Wang Y, Wang Z, Gong C, Qi F
and Zhang C: Pathway-related modules involved in the application of
sevoflurane or propofol in off-pump coronary artery bypass graft
surgery. Exp Ther Med. 14:97–106. 2017. View Article : Google Scholar : PubMed/NCBI
|
|
15
|
Donato M, Xu Z, Tomoiaga A, Granneman JG,
Mackenzie RG, Bao R, Than NG, Westfall PH, Romero R and Draghici S:
Analysis and correction of crosstalk effects in pathway analysis.
Genome Res. 23:1885–1893. 2013. View Article : Google Scholar : PubMed/NCBI
|
|
16
|
Sharan R, Ulitsky I and Shamir R:
Network-based prediction of protein function. Mol Syst Biol. 3:88.
2007. View Article : Google Scholar : PubMed/NCBI
|
|
17
|
Zuberi K, Franz M, Rodriguez H, Montojo J,
Lopes CT, Bader GD and Morris Q: GeneMANIA prediction server 2013
update. Nucleic Acids Res. 41:W115–W122. 2013. View Article : Google Scholar : PubMed/NCBI
|
|
18
|
Gautier L, Cope L, Bolstad BM and Irizarry
RA: affy - analysis of Affymetrix GeneChip data at the probe level.
Bioinformatics. 20:307–315. 2004. View Article : Google Scholar : PubMed/NCBI
|
|
19
|
Benjamini Y, Drai D, Elmer G, Kafkafi N
and Golani I: Controlling the false discovery rate in behavior
genetics research. Behav Brain Res. 125:279–284. 2001. View Article : Google Scholar : PubMed/NCBI
|
|
20
|
Huang W, Sherman BT and Lempicki RA:
Systematic and integrative analysis of large gene lists using DAVID
bioinformatics resources. Nat Protoc. 4:44–57. 2009. View Article : Google Scholar : PubMed/NCBI
|
|
21
|
Ford G, Xu Z, Gates A, Jiang J and Ford
BD: Expression Analysis Systematic Explorer (EASE) analysis reveals
differential gene expression in permanent and transient focal
stroke rat models. Brain Res. 1071:226–236. 2006. View Article : Google Scholar : PubMed/NCBI
|
|
22
|
Ruan J, Dean AK and Zhang W: A general
co-expression network- based approach to gene expression analysis:
Comparison and applications. BMC Syst Biol. 4:82010. View Article : Google Scholar : PubMed/NCBI
|
|
23
|
Gillis J and Pavlidis P: The role of
indirect connections in gene networks in predicting function.
Bioinformatics. 27:1860–1866. 2011. View Article : Google Scholar : PubMed/NCBI
|
|
24
|
Mulvihill NT, Foley JB, Murphy R, Crean P
and Walsh M: Evidence of prolonged inflammation in unstable angina
and non-Q wave myocardial infarction. J Am Coll Cardiol.
36:1210–1216. 2000. View Article : Google Scholar : PubMed/NCBI
|
|
25
|
Wang Y: Mitogen-activated protein kinases
in heart development and diseases. Circulation. 116:1413–1423.
2007. View Article : Google Scholar : PubMed/NCBI
|
|
26
|
Indolfi C, Avvedimento EV, Di Lorenzo E,
Esposito G, Rapacciuolo A, Giuliano P, Grieco D, Cavuto L, Stingone
AM, Ciullo I, et al: Activation of cAMP-PKA signaling in vivo
inhibits smooth muscle cell proliferation induced by vascular
injury. Nat Med. 3:775–779. 1997. View Article : Google Scholar : PubMed/NCBI
|
|
27
|
Indolfi C, Gasparri C, Vicinanza C, De
Serio D, Boncompagni D, Mongiardo A, Spaccarotella C, Agosti V,
Torella D and Curcio A: Mitogen-activated protein kinases
activation in T lymphocytes of patients with acute coronary
syndromes. Basic Res Cardiol. 106:667–679. 2011. View Article : Google Scholar : PubMed/NCBI
|
|
28
|
Ozaki K and Leonard WJ: Cytokine and
cytokine receptor pleiotropy and redundancy. J Biol Chem.
277:29355–29358. 2002. View Article : Google Scholar : PubMed/NCBI
|
|
29
|
Bernard GR, Artigas A, Brigham KL, Carlet
J, Falke K, Hudson L, Lamy M, Legall JR, Morris A and Spragg R:
Report of the American-European Consensus conference on acute
respiratory distress syndrome: definitions, mechanisms, relevant
outcomes, and clinical trial coordination. Consensus Committee. J
Crit Care. 9:72–81. 1994. View Article : Google Scholar : PubMed/NCBI
|
|
30
|
Boekholdt SM, Peters RJ, Hack CE, Day NE,
Luben R, Bingham SA, Wareham NJ, Reitsma PH and Khaw KT: IL-8
plasma concentrations and the risk of future coronary artery
disease in apparently healthy men and women: The EPIC-Norfolk
prospective population study. Arterioscler Thromb Vasc Biol.
24:1503–1508. 2004. View Article : Google Scholar : PubMed/NCBI
|
|
31
|
Ruiz-Meana M, Garcia-Dorado D, Juliá M,
Inserte J, Siegmund B, Ladilov Y, Piper M, Tritto FP, González MA
and Soler-Soler J: Protective effect of HOE642, a selective blocker
of Na+-H+ exchange, against the development
of rigor contracture in rat ventricular myocytes. Exp Physiol.
85:17–25. 2000. View Article : Google Scholar : PubMed/NCBI
|
|
32
|
Siegmund B, Ladilov YV and Piper HM:
Importance of sodium for recovery of calcium control in
reoxygenated cardiomyocytes. Am J Physiol. 267:H506–H513.
1994.PubMed/NCBI
|
|
33
|
Sánchez JA, Rodríguez-Sinovas A,
Fernández-Sanz C, Ruiz-Meana M and García-Dorado D: Effects of a
reduction in the number of gap junction channels or in their
conductance on ischemia-reperfusion arrhythmias in isolated mouse
hearts. Am J Physiol Heart Circ Physiol. 301:H2442–H2453. 2011.
View Article : Google Scholar : PubMed/NCBI
|
|
34
|
Garcia-Dorado D, Ruiz-Meana M, Inserte J,
Rodriguez-Sinovas A and Piper HM: Calcium-mediated cell death
during myocardial reperfusion. Cardiovasc Res. 94:168–180. 2012.
View Article : Google Scholar : PubMed/NCBI
|