Introduction
Breast cancer, a malignant tumor type derived from
the epithelium of terminal ductal lobules of the breast, is a
disease that seriously threatens the health of women (1,2). An
estimated 1.2 million women suffer from breast cancer worldwide,
and 500,000 women die from the disease each year (3,4). In
recent years, the incidence of breast cancer has increased in China
(5,6). The development of methods for the
precise diagnosis, selection of a suitable treatment and prediction
of the outcome, as well as studies on the mechanism of
carcinogenesis, have become major research topics in the field of
breast cancer (7,8).
Neoadjuvant chemotherapy (NAC) is a systemic
cytotoxic drug treatment method targeting the local malignant tumor
prior to surgery and/or radiotherapy. NAC has now become an
important component of comprehensive breast cancer treatment
(9). While a large number of
clinical trials have proved that NAC is effective in treating
advanced breast cancer, studies have also indicated that 10–35% of
patients were insensitive to chemotherapy drugs. The effect of
chemotherapy is not significant in those patients, which allows the
disease to progress (10–12). Therefore, the effectiveness of NAC
should be more precisely evaluated in order to provide breast
cancer patients with an effective treatment plan.
Breast ultrasound is a low-cost and non-invasive
imaging method, and due to its advantages of high resolution and
ability to visualize impalpable lumps, it is superior to
mammography, computed tomography (CT) and magnetic resonance
imaging (MRI) (13–17). With the popularization of ultrasound
and the rapid development of novel ultrasonic technology,
high-frequency ultrasound, elastography and ultrasound contrast
have been frequently applied to patients with suspected breast
cancer in the past years, which is helpful for improving the
diagnostic accuracy (18–22). In the present study,
contrast-enhanced ultrasonography (CEUS) and ultrasound
elastography (UE) were used to evaluate the efficacy of NAC in
breast cancer patients.
Patients and methods
Patients
A total of 65 breast cancer patients who received
NAC at the First Affiliated Hospital of Zhejiang University
(Zhejiang, China) between February 2016 and August 2017 were
recruited for the present study. All patients were confirmed via
biopsy to have breast cancer prior to receiving NAC treatment and
they received no other treatment. This study was approved by the
ethics committee of the First Affiliated Hospital of Zhejiang
University (Zhejiang, China). All patients provided written
informed consent.
Chemotherapy regimen
Prior to surgery, all patients received 6 cycles of
NAC with the ‘TEC’ chemotherapy regimen (docetaxel, 75
mg/m2; epirubicin, 75 mg/m2;
cyclophosphamide, 500 mg/m2). Fluorescence in
situ hybridization indicated that the tumors of 6 patients were
positive for human epidermal growth factor receptor 2, and they
were given the targeted drug herceptin (8 mg/kg body mass for the
first time, followed by 6 mg/kg body mass). Drug treatment for 21
days was considered as 1 cycle and an interval of 20 days occurred
following. Image examinations were performed prior to the next NAC
cycle. Surgical excision was performed within 20 days after 6
cycles of drug treatment. A flow chart illustrating the
chemotherapeutic regimen is presented in Fig. 1.
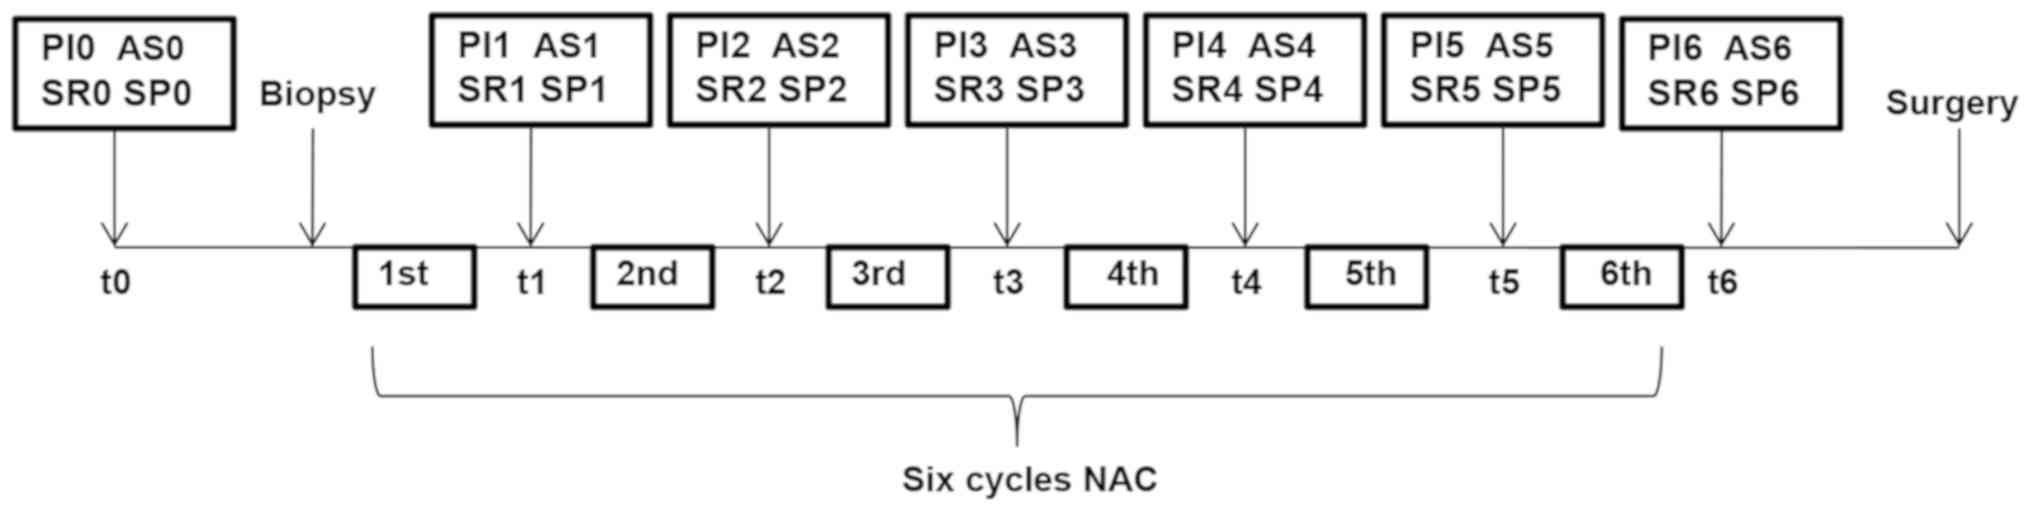 | Figure 1.Flow chart of NAC. Each cycle lasted
for 21 days and surgical excision was performed within 20 days
after 6 cycles. The parameters of CEUS and UE were recorded,
including PI, AS, SR and SP. NAC, neoadjuvant chemotherapy; PI,
peak intensity; AS, ascending slope; SR, strain ratio; SP, strain
pressure; CEUS, contrast-enhanced ultrasonography; UE, ultrasound
elastography. |
CEUS examination
CEUS was performed using an ESAOTE MyLabClassC
ultrasound diagnostic instrument (Esaote SpA, Genoa, Spain). The
ultrasound contrast agent SonoVue (59 µg; Bracco SpA, Milan, Italy)
was added to 5 ml saline and a milky microbubble suspension was
generated by vigorous agitation. The largest section of the nodule
was identified and its location was entered into a real-time
ultrasound contrast model (QontraXt, Version 3.06). A total of 4.8
ml SonoVue suspension was rapidly injected through an anterior
elbow vein and then 5 ml of saline was injected to flush the tube.
The dynamic image at 180 sec was stored in real-time. Contrast
observation continued until the lesion-enhanced image disappeared.
The ultrasound contrast image was then processed, and the
time-intensity curve was drawn for the region of interest (ROI).
The parameters of CEUS including rise time (RT), time to peak
(TTP), peak intensity (PI) and ascending slope (AS) were recorded.
The differences in the parameters at the end of NAC vs. baseline
(Δ) were calculated as follows: ΔAS=(AS0-AS6)/AS0×100% and
ΔPI=(PI0-PI6)/PI0×100%, where AS0 and AS6 or the PI0 and PI6 are
the AS or PI at baseline and after the 6th cycle of NAC,
respectively.
UE examination
For UE, the ESAOTE MyLabClass C ultrasound
diagnostic instrument was used (Esaote SpA, Genoa, Spain). First,
conventional ultrasound scanning was implemented to locate the
breast nodules, followed by switching to elastic mode, in which
breast elastography was performed. The number of the pressure
indicators of the display screen remained between 2 and 3, and the
ROI remained 2–3 times larger than the nodule. UE observation was
dynamically performed. According to the ‘5 Points Grading Method’
proposed by Itoh (23), the breast
nodules were evaluated by elastic scoring, with 1–3 points
indicating a benign, and 4 and 5 points suggesting a malignant
status. The parameters of UE, including the strain ratio (SR) and
strain point (SP), were recorded, and Δ values were calculated as
follows: ΔSP=(SP0-SP6)/SP0×100%; ΔSR=(SR0-SR6)/SR0×100%.
The differential diagnosis was established by two
senior physicians based on the results of CEUS and UE. To assess
whether the patient was responsive to NAC or not, the sensitivity,
specificity and accuracy of CEUS, UE and the combination of the two
were analyzed by comparison with the post-operative pathological
diagnosis, which was considered as the gold standard.
CEUS and UE evaluation
According to the response evaluation criteria in
solid tumors (24), changes in the
longest diameter of the lesion prior to and after chemotherapy were
compared. A total reduction of the maximum diameter of the lesion
of ≥30%, or disappearance of the lesion with no new lesion
appearing, was defined as a ‘response’ to NAC. A ‘non-response’ was
defined as the longest diameter of the original lesion being
decreased by <30% or increased after NAC, or the appearance of a
new focus.
Pathological evaluation
According to the tumor response grade proposed by
Eisenhauer et al (25), the
histopathology results of the lesion samples isolated in the
surgery were compared with those of the biopsy specimens obtained
prior to treatment to determine the response to NAC, based on which
the patients were stratified into two groups: A reduction in the
relative number of cancer cells by <30% was defined as
‘non-response’, while a ‘response’ was considered when cancer cells
were reduced by ≥30%.
Statistical analysis
The data were analyzed by SPSS version 20 statistics
software (IBM Corp., Armonk, NY, USA). The Chi square test was used
for evaluation of count data. The Kappa test was performed to
analyze the results of CEUS and UE to evaluate the outcome of NAC
as well as the consistency with the results of the post-operative
pathological evaluation. Parameter changes of CEUS and UE were
assessed by Student's t-test. The prediction rate was calculated
using univariate logistic regression analysis. Receiver operating
characteristic (ROC) curves and the area under the curve (AUC) were
obtained for CEUS and UE to evaluate NAC efficacy. P<0.05 was
considered to indicate a statistically significant difference.
Results
Characteristics of the patients and
their tumors
The baseline characteristics of the patients are
presented in Table I. No significant
differences in the clinicopathological characteristics at baseline
were identified between the response and no response groups.
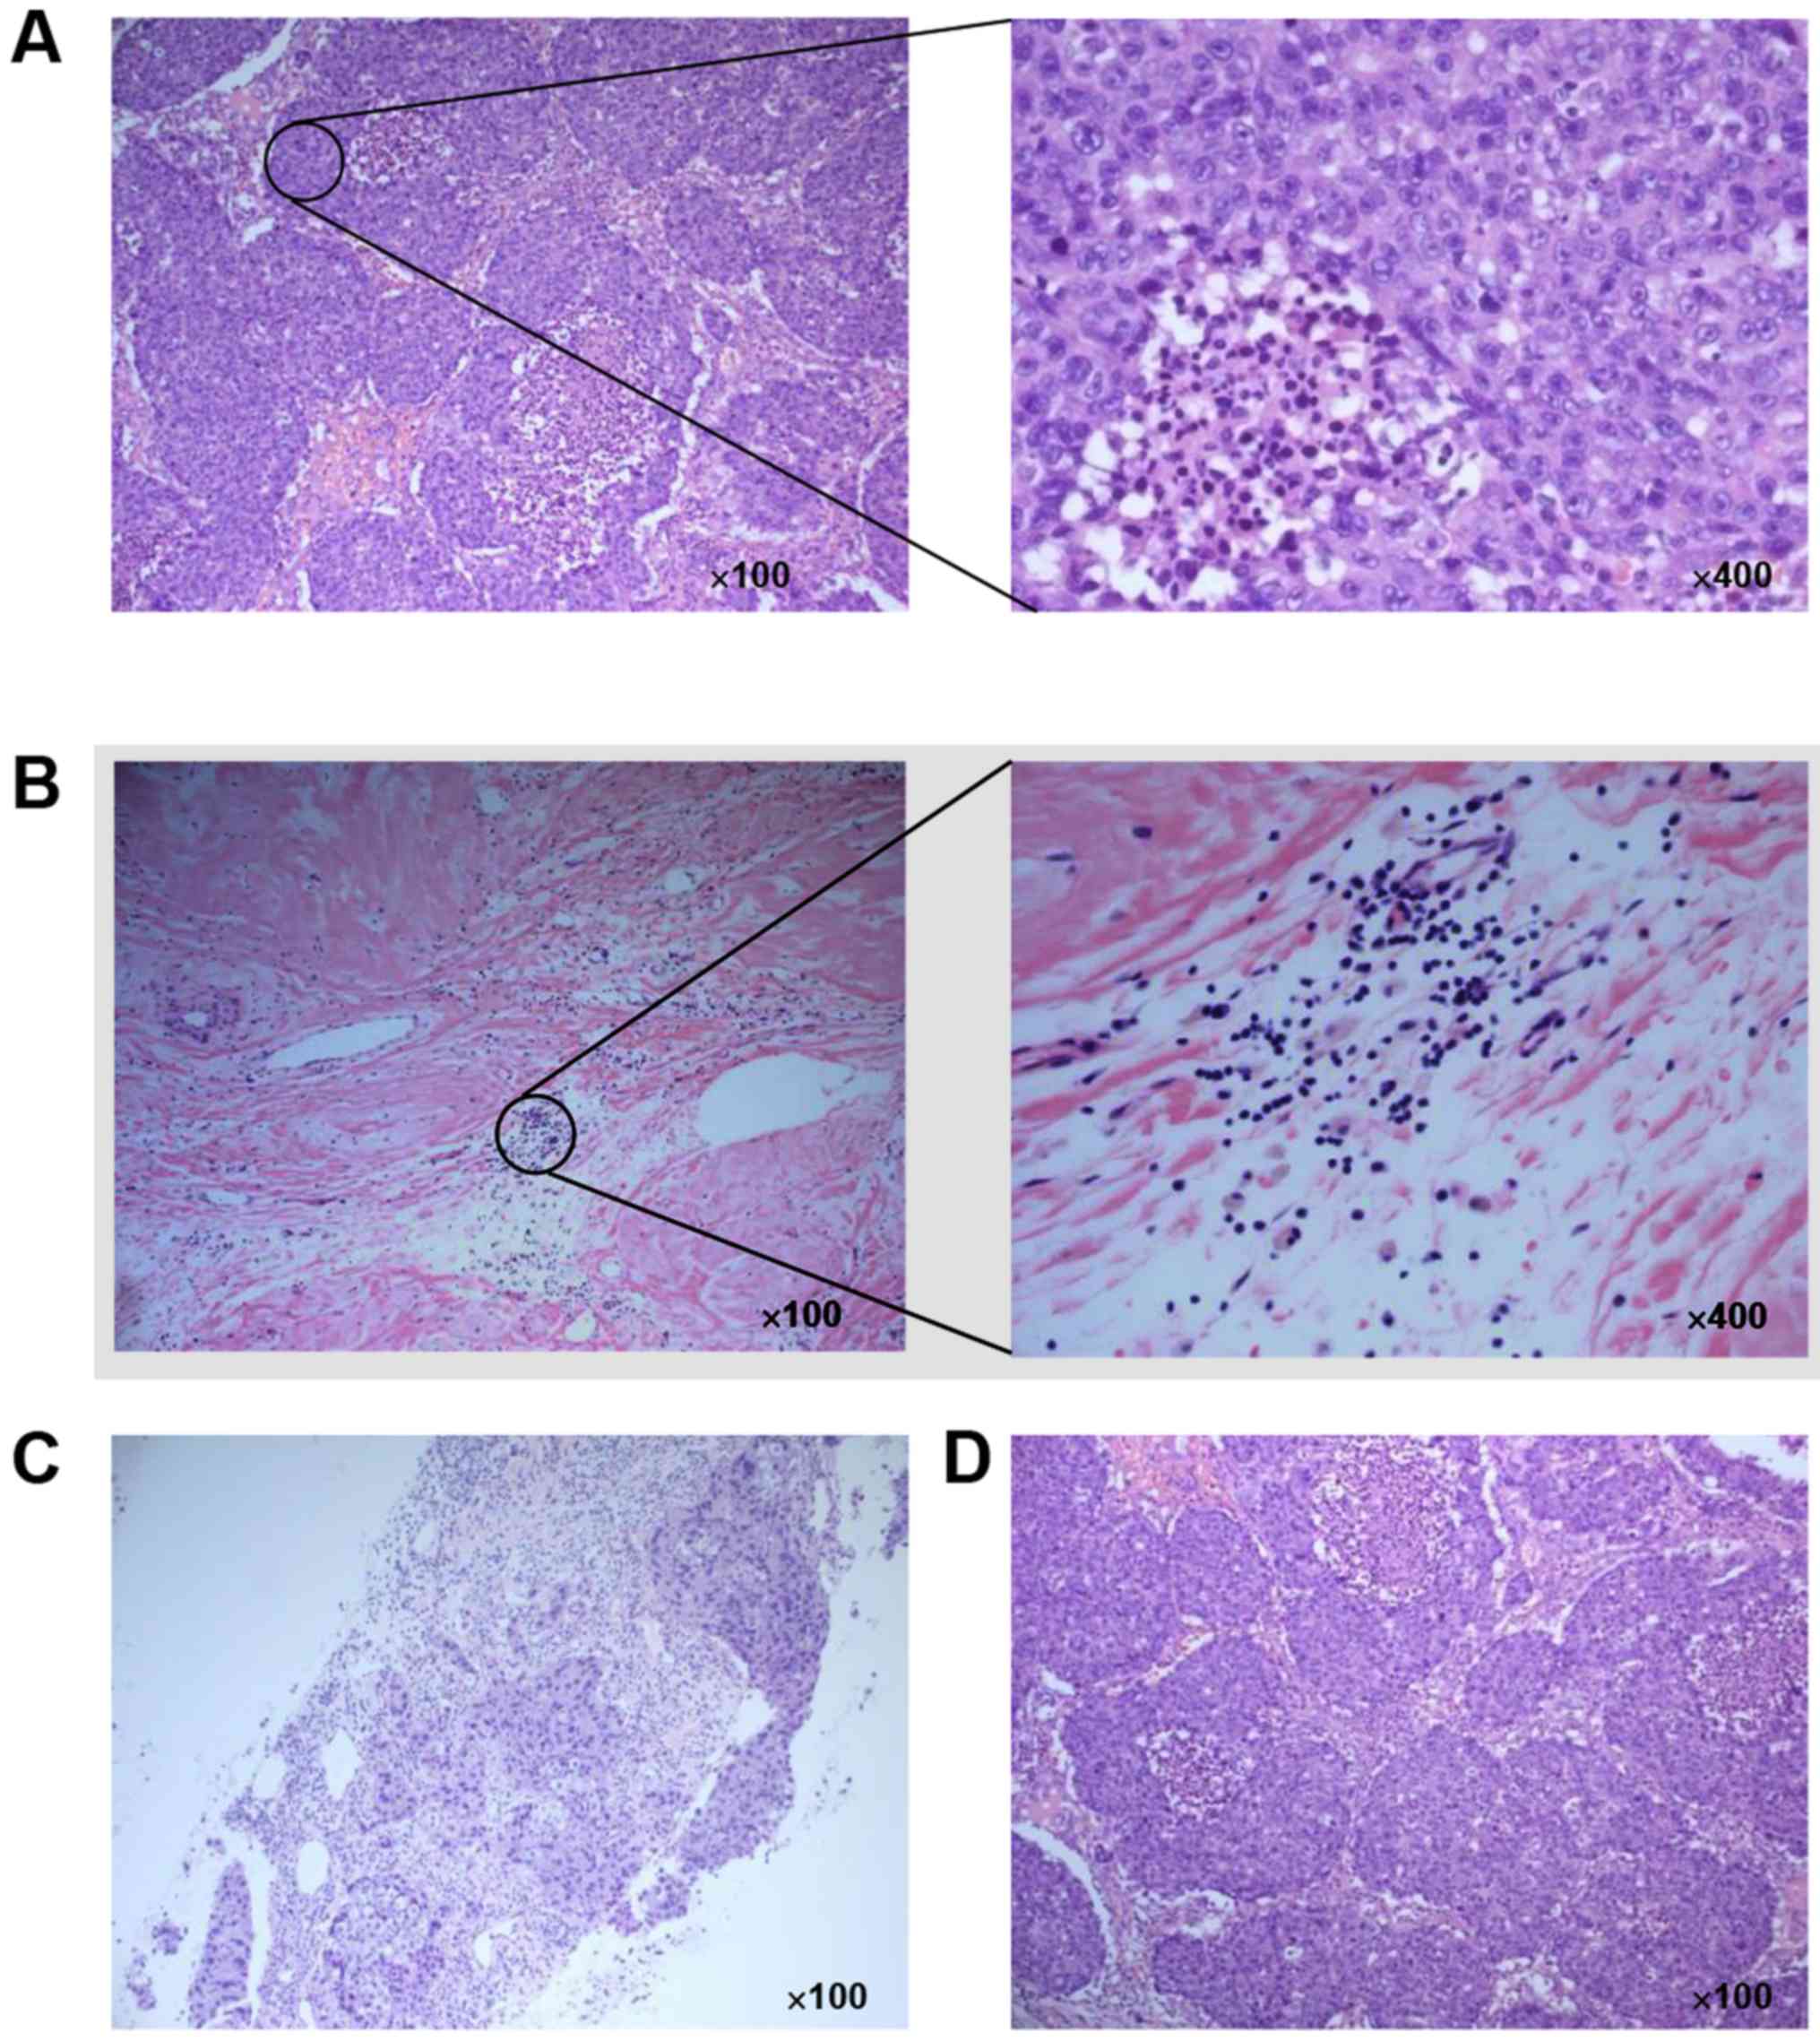
Post-operative histopathological analysis indicated that the
density of cancers cells was relatively high in the tumors from
non-response patients, while it was relatively low in the response
patients (Fig. 2A and B). Invasive
ductal carcinoma of the breast was confirmed through tissue coarse
needle biopsy prior to NAC (Fig.
2C). After NAC, the surgical specimen was confirmed as grade 4
(Fig. 2D).
 | Table I.Clinicopathological features of the
patients at baseline. |
Table I.
Clinicopathological features of the
patients at baseline.
| Characteristic | Response group
(n=41) | No response group
(n=24) | P-value |
|---|
| Age (years) | 48.3±5.7 | 50.2±4.9 | 0.170 |
| Menopausal
status |
|
| 0.608 |
|
Pre-menopause | 21 (51.21%) | 10 (41.67%) |
|
|
Post-menopause | 20 (18.79%) | 14 (58.33%) |
|
| Tumor size
(cm) |
|
| 1.000 |
|
>4 | 10 (24.39%) | 5
(20.83%) |
|
|
<4 | 31 (75.61%) | 19 (79.17%) |
|
| Histological
grade |
|
| 1.000 |
| 2 | 25 (60.98%) | 15 (62.50%) |
|
| 3 | 16 (39.02%) | 9
(37.50%) |
|
| Tumor subtype |
|
| 0.601 |
| Luminal
A | 14 (34.15%) | 10 (41.67%) |
|
| Luminal
B | 27 (65.85%) | 14 (58.33%) |
|
| Nodal status |
|
| 0.785 |
|
Negative | 29 (70.73%) | 16 (66.67%) |
|
|
Positive | 12 (29.27%) | 8
(33.33%) |
|
Performance of CEUS and UE in
evaluating the efficiency of NAC
The Kappa test was used to analyze the consistency
of the evaluation results of CEUS, US and their combination with
the results of the post-operative pathological evaluation. The
pathological results indicated that 41 cases exhibited a response
to NAC and 24 cases did not (Table
II). A Kappa value of >0.75 indicated good consistency,
0.75>Kappa>0.4 suggested moderate consistency and Kappa
<0.4 was considered to indicate poor consistency. This suggested
that combination of CEUS and UE have a good efficiency in
predicting the response to NAS based on histopathological
examinations. CEUS was also demonstrated to do this more
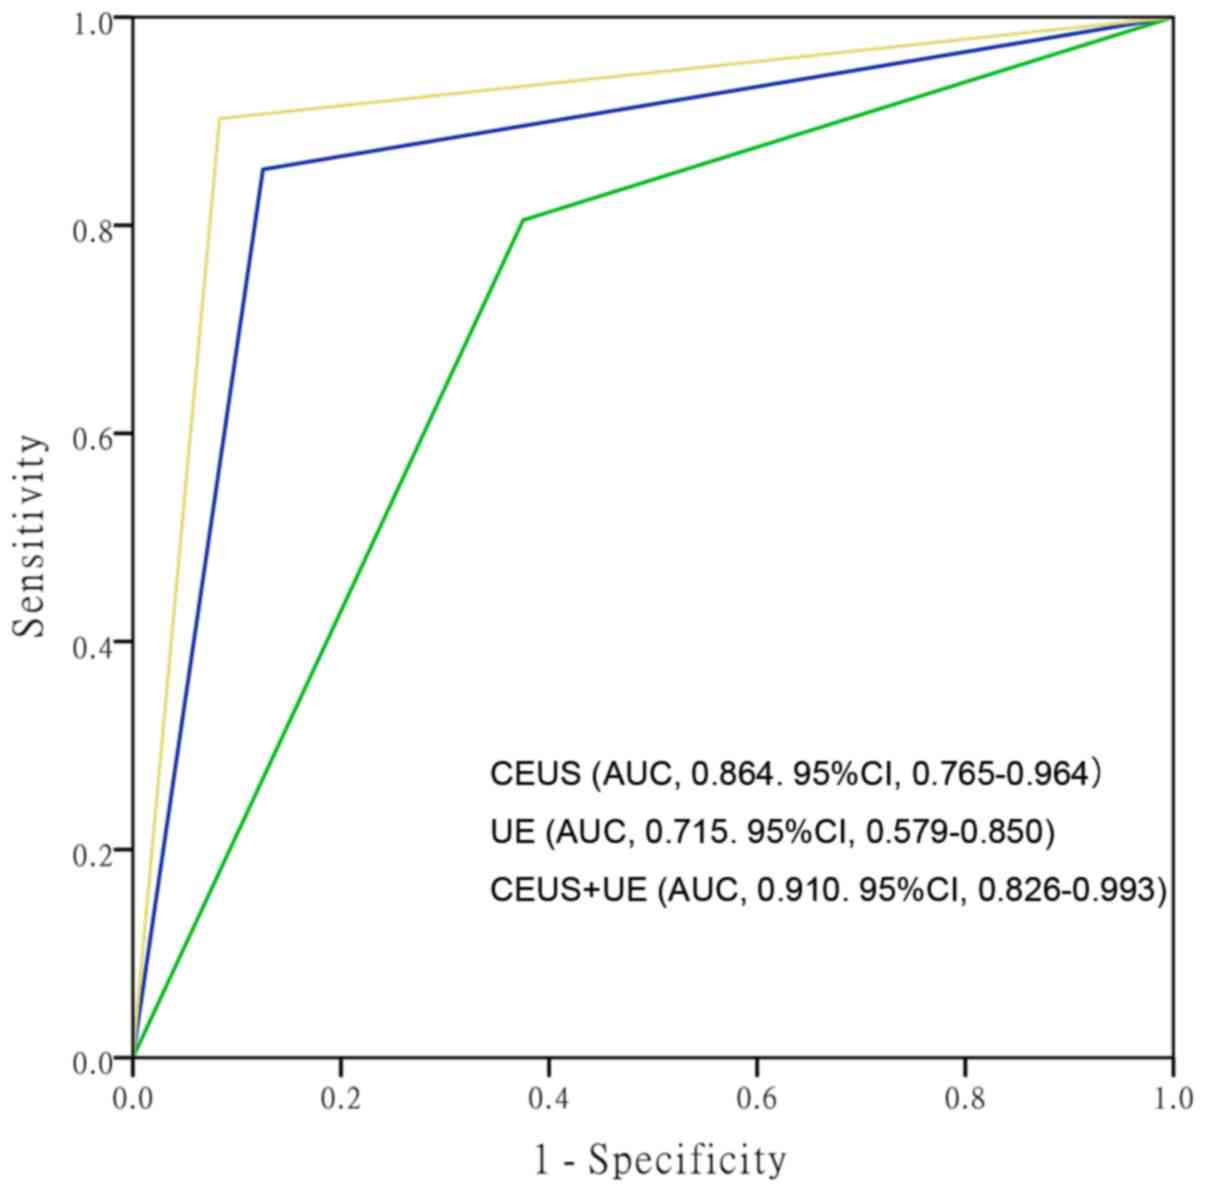
efficiently than UE. In addition, the sensitivity, specificity,
accuracy, positive predictive value (PPV) and negative predictive
value (NPV) of CEUS and UE were analyzed. The AUC of the ROC for
the prediction of a response by CEUS was 0.864 [95% confidence
interval (CI), 0.765–0.964]. Furthermore, the AUC for UE was 0.715
(95% CI, 0.579–0.850) and that of CEUS+UE was 0.910 (95% CI,
0.826–0.0.993; Fig. 3). The
sensitivity, specificity, accuracy, PPV and NPV of CUES and of UE
are presented in Table III. It was
observed that the AUC, sensitivity, specificity, accuracy and PPV
of CEUS+UE were higher than those of CEUS or UE alone.
| Table II.Comparison of evaluation of CEUS and
UE with pathological evaluation. |
Table II.
Comparison of evaluation of CEUS and
UE with pathological evaluation.
|
|
| Histology |
|
|
|---|
|
|
|
|
|
|
|---|
| Imaging
modality/result | Total n (%) | Response | No response | Kappa | P-value |
|---|
| CEUS |
|
|
|
|
|
|
Response | 38 (58.46%) | 35 (85.37%) | 3
(14.29%) | 0.710 | <0.001 |
| No
response | 27 (41.54%) | 6
(14.63%) | 21 (85.71%) |
|
|
|
Total | 65 | 41 | 24 |
|
|
| UE |
|
|
|
|
|
|
Response | 42 (64.62%) | 33 (80.49%) | 9
(37.50%) | 0.434 | <0.001 |
| No
response | 23 (35.38%) | 8
(19.51%) | 15 (62.50%) |
|
|
|
Total | 65 | 41 | 24 |
|
|
| CEUS+UE |
|
|
|
|
|
|
Response | 40 (61.54%) | 38 (92.68%) | 2 (4.88%) | 0.836 | <0.001 |
| No
response | 25 (38.45%) | 3 (7.32%) | 22 (95.12%) |
|
|
|
Total | 65 | 41 | 24 |
|
|
| Table III.Comparison of sensitivity,
specificity, accuracy, PPV and NPV (%) between CEUS, UE and their
combination. |
Table III.
Comparison of sensitivity,
specificity, accuracy, PPV and NPV (%) between CEUS, UE and their
combination.
| Parameter | CEUS | UE | CEUS+UE |
|---|
| Sensitivity | 85.36 | 80.49 | 92.68 |
| Specificity | 87.50 | 62.50 | 91.67 |
| Accuracy | 86.15 | 73.85 | 92.31 |
| PPV | 92.11 | 78.57 | 95.00 |
| NPV | 77.77 | 65.22 | 87.99 |
Image and parameter analysis of CEUS
and UE
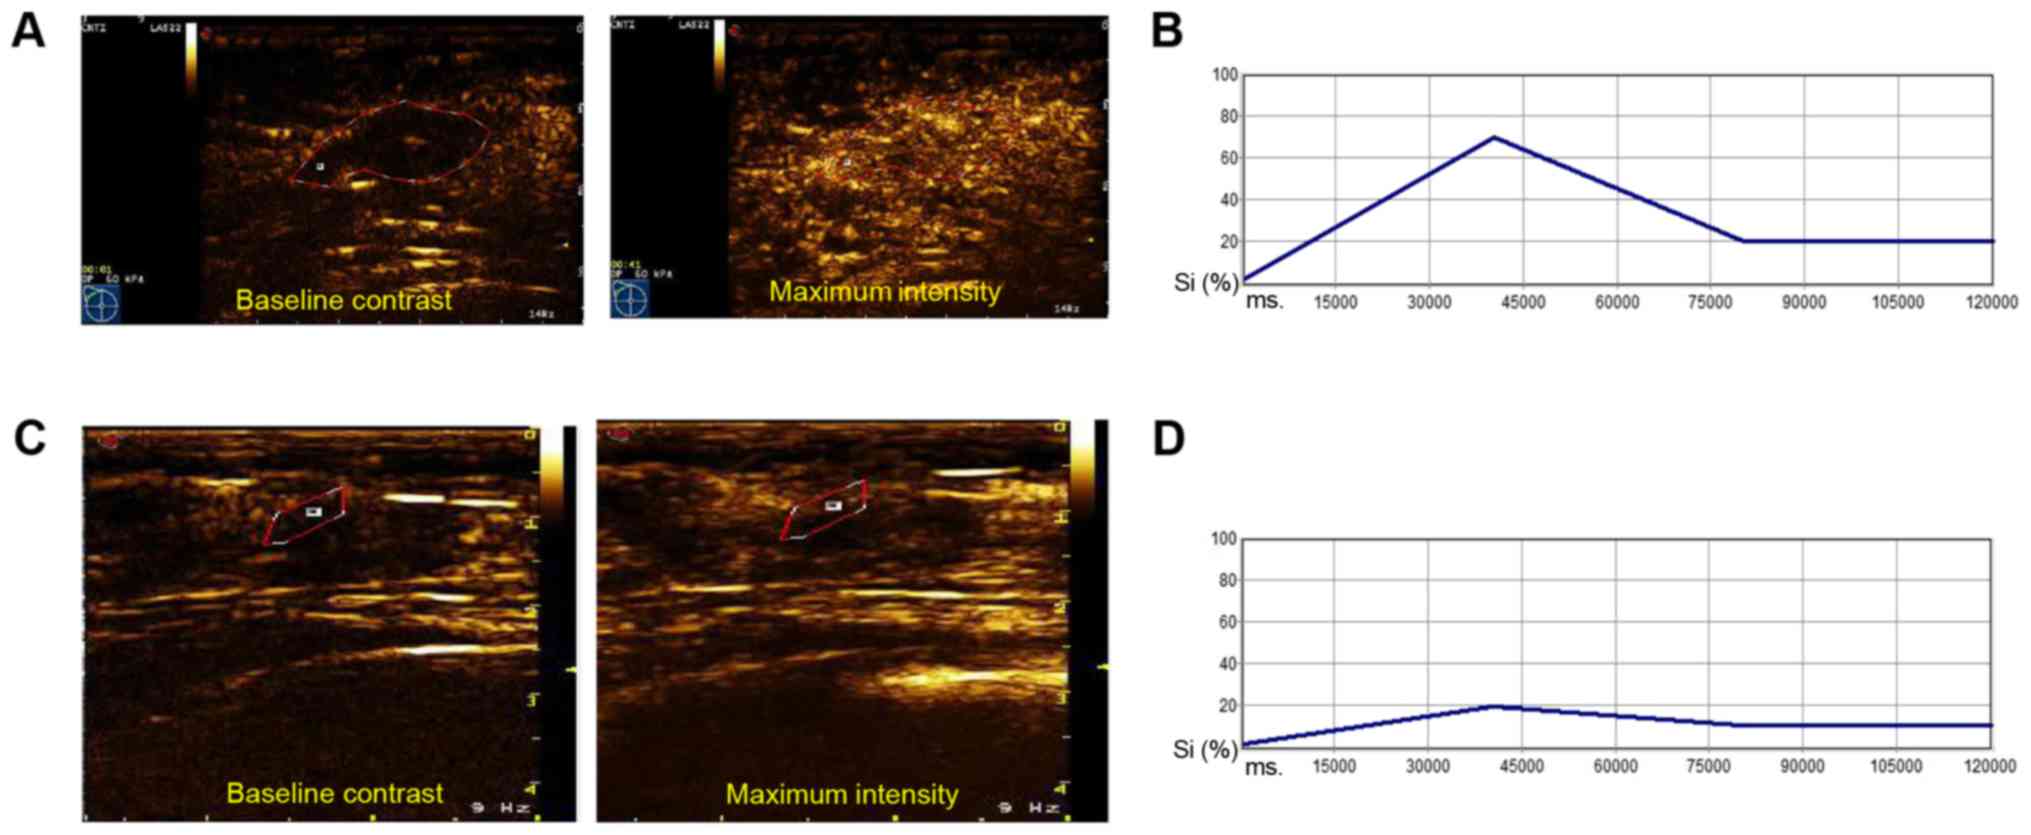
The CEUS images were analyzed using Philips QLAB
ultrasound contrast quantitative analysis software (Fig. 4). The maximum signal intensity in the
non-response group was identified to be stronger than that in the
response group (Fig. 4). The
corresponding time-signal intensity curve in the response group was
more stable than that in the non-response group (Fig. 4B and D). Subsequently, the parameters
of CEUS obtained from the images were analyzed. In comparison with
those in the non-response group, the PI and ascending slope AS were
significantly reduced in the response group, while the RT and TTP
remained relatively stable. Furthermore, it was identified that
compared with the baseline values, the PI and AS were obviously
decreased after NAC in the non-response and response groups
(Table IV).
| Table IV.Quantitative parameters of CEUS prior
to and after NAC. |
Table IV.
Quantitative parameters of CEUS prior
to and after NAC.
|
Parameter/time-point | Response
(n=41) | No response
(n=24) | P-value |
|---|
| RT after NAC |
9.43±2.61 |
8.25±2.67 |
0.086 |
| TTP after NAC | 19.05±4.17 | 21.10±4.37 |
0.065 |
| PI |
|
|
|
| Prior
to NAC | 26.18±3.82 | 25.32±4.11 |
0.398 |
| After
NAC |
13.87±3.77a |
22.34±4.05b | <0.001 |
| AS |
|
|
|
| Prior
to NAC |
1.65±0.50 |
1.41±0.42 |
0.052 |
| After
NAC |
0.78±0.29a |
1.06±0.24a | <0.001 |
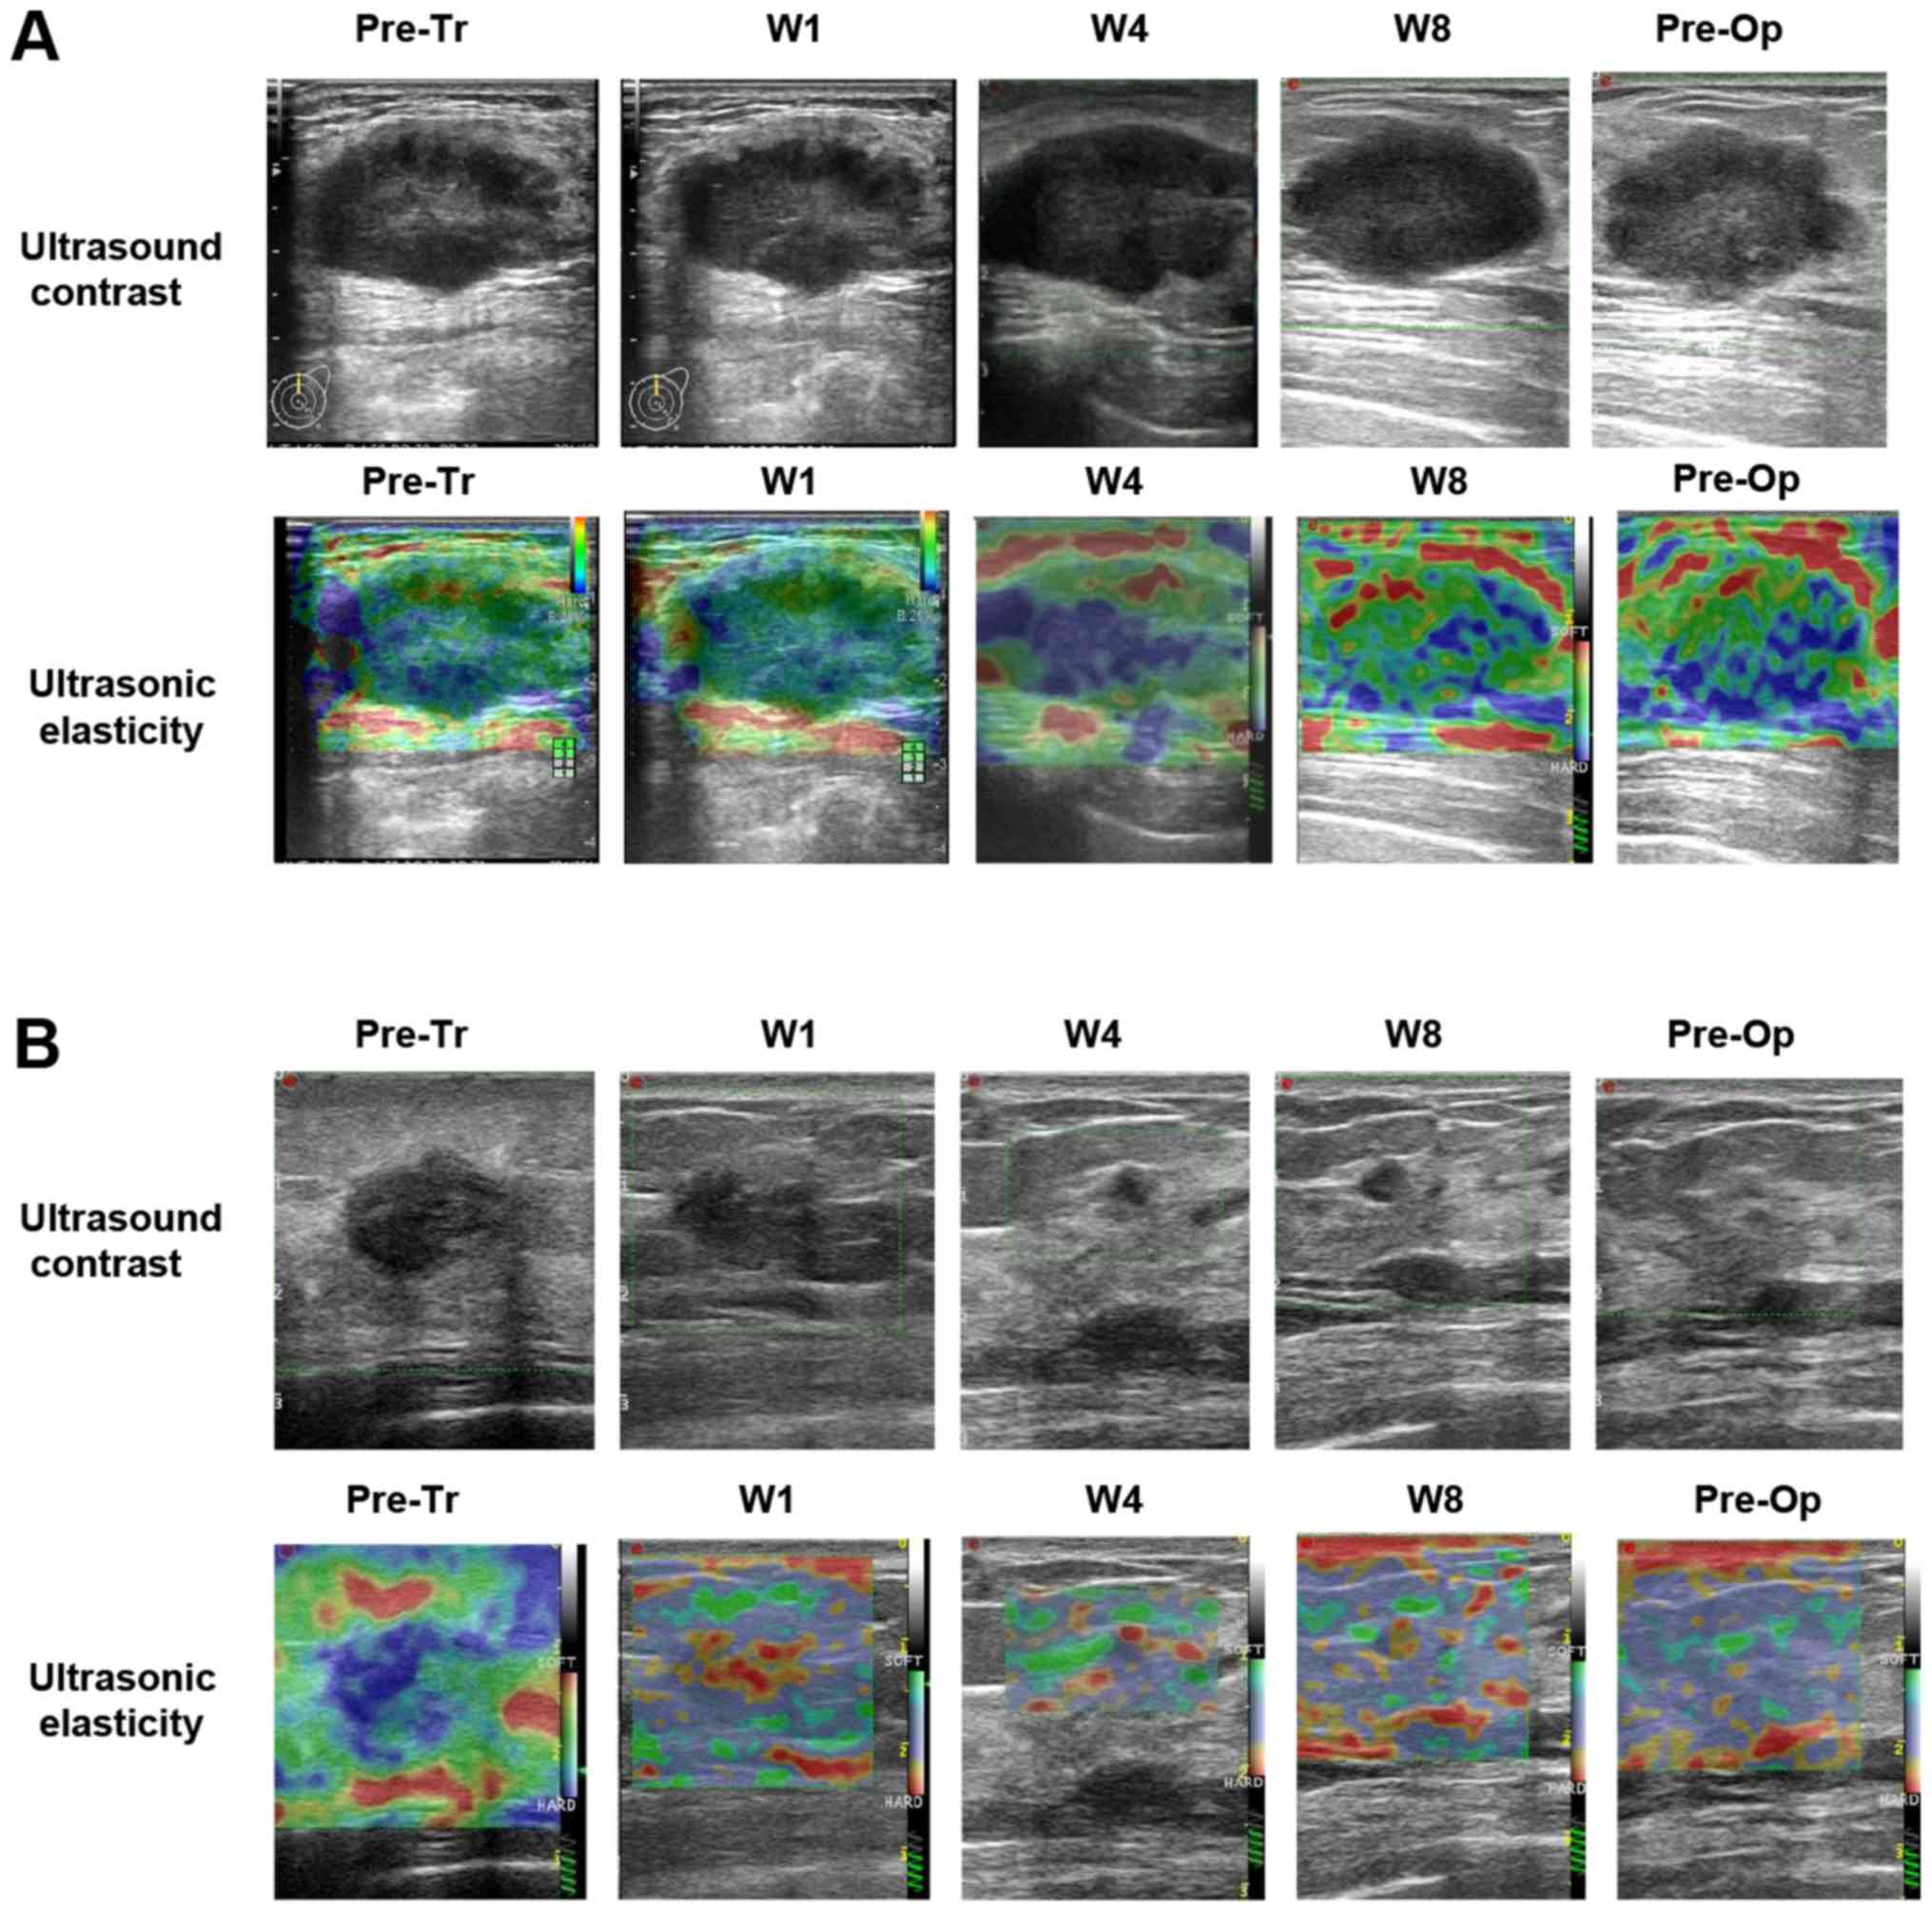
CEUS and UE imaging was performed prior to the next
NAC cycle, and prior to the operation. The images revealed that
compared with the non-response group, the residual tumor in the
response group was markedly reduced (Fig. 5). Subsequently, the parameters of UE
were determined based on the images. The results indicated that the
percentage of cases with 1–3 points according to the ‘5 Points
Grading Method’ in the response group was higher than that in the
non-response group. However, the percentage of cases with 4 or 5
points in the response group was lower than that in the
non-response group (Table V).
Furthermore, the strain ratio (SR) after NAC was conspicuously
reduced in the response group compared with that the non-response
group (2.11±0.52 vs. 3.71±1.29), whereas no differences were
observed prior to NAC between them. In addition, in comparison with
the baseline, the number of the cases with 1–3 points was
significantly increased, while the SR and the number of the cases
with 4 and 5 points were markedly decreased in either group after
NAC (Table V).
| Table V.Comparison of points of UE evaluated
using the ‘5 Point Grading Method’ (23) prior to and following NAC. |
Table V.
Comparison of points of UE evaluated
using the ‘5 Point Grading Method’ (23) prior to and following NAC.
|
| Response
(n=41) | No response
(n=24) |
|---|
|
|
|
|
|---|
| Time-point | 1–3 points | 4/5 points | SR | 1–3 points | 4/5 points | SR |
|---|
| Prior to NAC | 10 | 31 | 6.70±1.46 | 5 | 19 | 5.89±1.33 |
| After NAC | 34 | 7 | 2.11±0.52 | 14 | 10 |
3.71±1.29a |
| P-value | <0.001 |
| <0.001 | 0.008 |
| <0.001 |
Accuracy of CEUS and UE in predicting
the efficiency of NAC
ROC curves, the optimal cutoff and the area under
the ROC (AUC) were obtained for the parameters of CEUS and UE,
namely ΔAS, ΔPI, ΔSP and ΔSR (Fig.
6). The optimal cutoff values for ΔAS, ΔPI, ΔSP and ΔSR were
>36.94, 21.15, 40 and 52.50%, respectively. ROC curve analysis
for ΔAS indicated that the sensitivity, specificity, accuracy, PPV
and NPV were 87.80, 95.83, 90.76, 97.29 and 82.14%, respectively,
while they were 90.24, 95.83, 92.30, 97.37 and 85.18% for ΔPI.
Furthermore, the sensitivity, specificity, accuracy, PPV and NPV
for ΔSP and ΔSR were 65.85 and 92.68%, 83.33 and 87.50%, 72.30 and
90.76%, 87.09 and 92.68%, and 58.82 and 87.50%, respectively
(Table VI). The prediction accuracy
rates of CEUS, UE and CEUS+UE were determined by a combination of
ΔPI, ΔAS, ΔSP or ΔSR using logistics analysis (Table VII). The CEUS prediction rate with
ΔPI and ΔAS as the influence factors was 89.2%, whereas the UE
prediction rate with ΔSP and ΔSR as the influence factors was
90.8%. The combination prediction rate of CEUS+UE with ΔSP, ΔSR and
ΔPI as the influence factors was 100%.
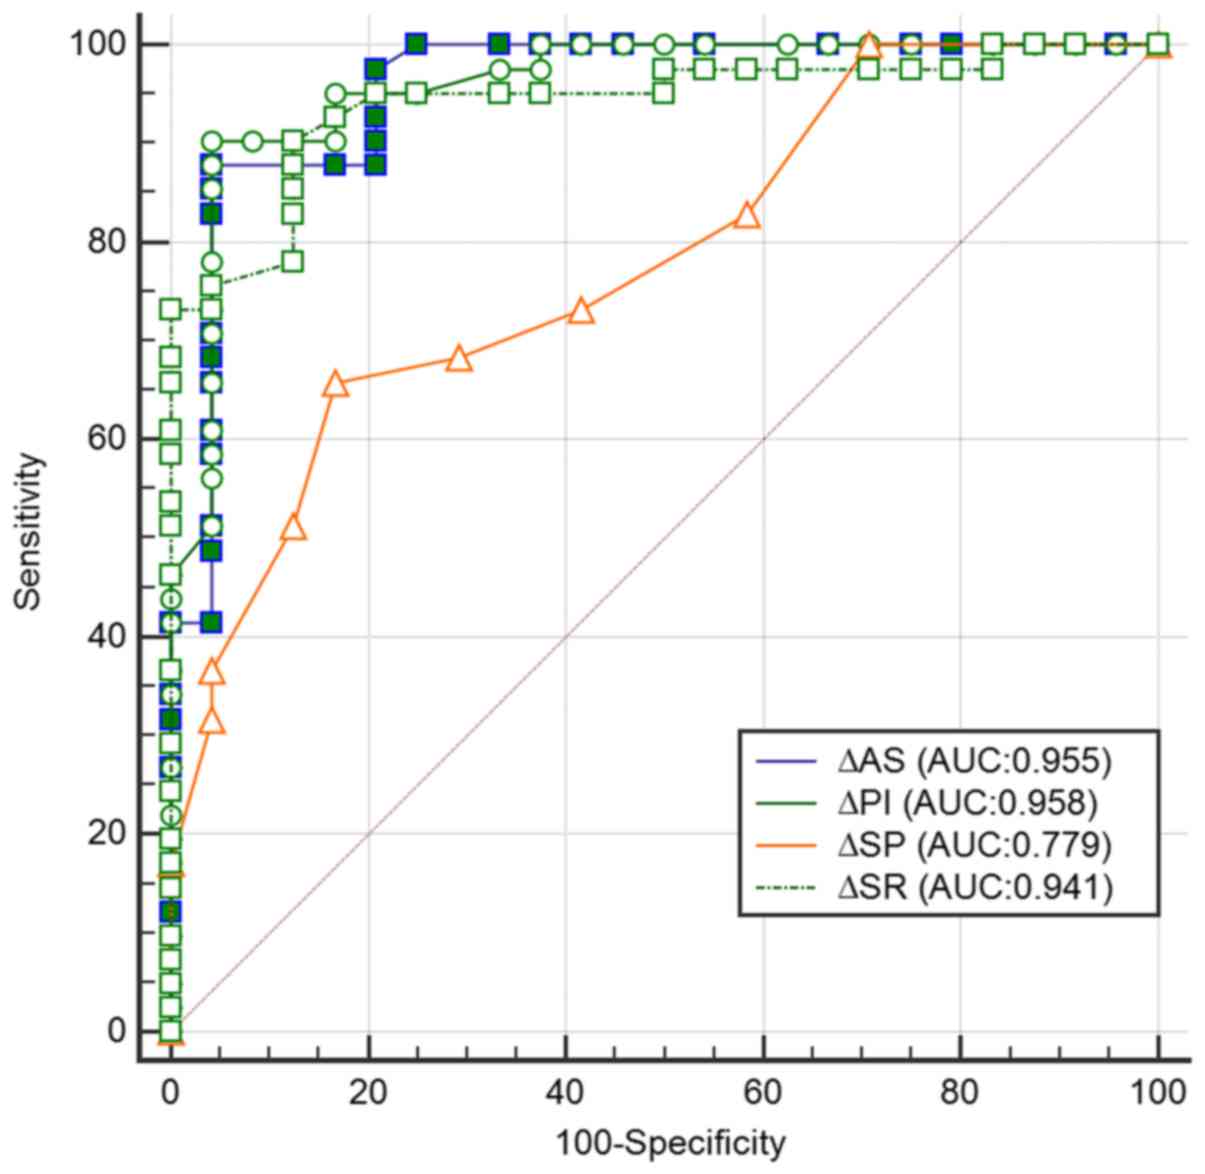 | Figure 6.Analysis of the ROC curves of CEUS
and UE in the prediction of the response to NAC in breast cancer
patients. The receiver operating characteristics curves of ΔAS,
ΔPI, ΔSP and ΔSR for prediction of the response to NAC. AUC, area
under the ROC curve; ROC, receiver operating characteristic; Δ,
difference between baseline and 6 cycles of NAC; AS, ascending
slope; PI, peak intensity; SP, strain point; SR, strain ratio; NAC,
neoadjuvant chemotherapy. |
| Table VI.Sensitivity, specificity, accuracy,
PPV and NPV of CEUS and UE in the prediction of response to
neoadjuvant chemotherapy (%). |
Table VI.
Sensitivity, specificity, accuracy,
PPV and NPV of CEUS and UE in the prediction of response to
neoadjuvant chemotherapy (%).
|
| CEUS | UE |
|---|
|
|
|
|
|---|
| Parameter | ΔAS | ΔPI | ΔSP | ΔSR |
|---|
| Sensitivity | 87.80 | 90.24 | 65.85 | 92.68 |
| Specificity | 95.83 | 95.83 | 83.33 | 87.50 |
| Accuracy | 90.76 | 92.30 | 72.30 | 90.76 |
| PPV | 97.29 | 97.37 | 87.09 | 92.68 |
| NPV | 82.14 | 85.18 | 58.82 | 87.50 |
| Table VII.Prediction rate of CEUS and UE
according to univariate logistic regression analysisa. |
Table VII.
Prediction rate of CEUS and UE
according to univariate logistic regression analysisa.
|
Modality/parameter | β | P-value | OR (95% CI) |
|---|
| CEUS |
|
|
|
|
ΔPI | −0.102 | 0.084 | 0.903
(0.804–1.014) |
|
ΔAS | −0.094 | 0.179 | 0.910
(0.793–1.044) |
|
Constant | 8.636 | 0.001 | – |
| UE |
|
|
|
|
ΔSP | 0.067 | 0.010 | 1.069
(1.016–1.125) |
|
ΔSR | 0.144 | <0.001 | 1.155
(1.074–1.242) |
|
Constant | −9.964 | <0.001 | – |
| CEUS+UE |
|
|
|
|
ΔSP | 0.786 | 0.996 | 2.194 |
|
ΔSR | 1.218 | 0.993 | 3.380 |
|
ΔPI | −2.058 | 0.993 | 0.128 |
|
Constant | −12.628 | 0.999 | – |
Discussion
Since the 1970s, NAC has been a critical part of the
comprehensive treatment of breast cancer. NAC may reduce tumor
cells and significantly increase the rate of breast-conserving and
surgical resection (26,27). Pathological examination is a gold
standard for evaluating tumor response after a patient received NAC
and it has a high diagnostic accuracy. However, in addition to the
post-operative examination, the efficiency of NAC should ideally be
determined at the end of/during NAC, as the pre-operative
prediction of the pathological response to NAC allows for
individualized breast cancer surgery timing (28,29).
Therefore, recent studies have encouraged the use of repeated,
non-invasive monitoring by imaging examinations so as to evaluate
the efficacy of NAC (17,30,31).
Imaging evaluation of the response of breast cancer
to NAC is required to be performed from two aspects of qualitative
and quantitative data. While a unified assessment system is
currently lacking, the evaluation standard regarding the size of
the lesion is unified. The standard is to compare the longest
diameter in images prior to and after NAC and to thereby evaluate
the response. After NAC, the regression of tumor cells mainly
manifests as necrosis and fibrosis of the lesions (32,33).
Conventional ultrasound cannot accurately distinguish between
necrosis, fibrous hyperplasia and residual cancer (34).
Breast cancer is a vasculature-derived disease and
with abundant neovascularization. The formation of
neovascularization is critically associated with the prognosis of
patients with breast cancer (35,36).
CEUS is able to detect microvessels of <40 µm in diameter and to
clearly display the shape and distribution of the lesion, as well
as the blood vessels (31,37). CEUS has proven effective in
evaluating the clinical response of various cancer types to NAC
(14,30,38,39). In
the present study, CEUS was identified to have a good performance
in evaluating the effect of NAC. The parameters of PI and AS were
significantly decreased in the responsive patients compared to
those in the patients that were unresponsive to NAC. Furthermore,
in comparison with the baseline, the PI and AS were also markedly
reduced after NAC in the response and non-response groups after
NAC. CEUS predicted the effectiveness of NAC with the rate of
correct prediction of the response to NAC being 89.2%. The above
results proved that CEUS may be used to efficiently predict the
pathological response of breast tumors to NAC.
UE is able to reflect the elastic characteristics of
various biological tissues, and may provide useful clues for
diagnosing breast diseases; therefore, it is regarded as a
beneficial supplementary method to conventional ultrasound
(19). The most commonly used UE
techniques are elastic scoring and the SR method (40,41).
Previous studies have indicated that by combination of the
two-dimensional grayscale image and the elastic scoring method, a
high accuracy in the diagnosis of benign and malignant breast
nodules was achieved (40). Hence,
in the present study, the methods of elastic scoring and SR were
also selected so as to explore the aptness of UE for evaluation of
the efficacy of NAC. The rate of correct prediction of the response
to NAC of UE with ΔSP and ΔSR as influence factors was 90.8%. These
results suggested that UE may be used to assess the pathological
response of breast tumors to NAC.
To the best of our knowledge, no previous study has
evaluated the combined use of CEUS and UE for evaluation of the
efficacy of NAC for breast cancer. It was hypothesized that CEUS in
combination with UE may predict NAC more accurately than CEUS
alone. As expected, the predictive accuracy of the combined
evaluation by CEUS or UE was higher than that of each imaging
modality implemented individually. When CEUS was combined with UE,
the sensitivity, specificity, accuracy, PPV and NPV were identified
to be higher than those of CEUS or UE applied individually.
Furthermore, the predictive accuracy rate of combined CEUS and UE
was 100%, proving that CEUS in combination with UE was highly
accurate in evaluating the efficacy of NAC for breast cancer.
The present clinical study demonstrated that CEUS
and UE have their individual advantages in evaluating the clinical
efficacy of NAC for breast cancer, and that the combination of the
two was more accurate. It is therefore recommended that this
combined method is widely implemented in the clinical assessment of
the efficacy of NAC for breast cancer patients. The present study
is of great clinical significance and paves the road for further
in-depth research on the combined use of CEUS and UE so as to
predict the pathological response of breast cancer after patients
have received NAC.
Acknowledgements
Not applicable.
Funding
The current study was supported by the Education
Agency of Zhejiang Province (grant no. Y201534607), the Health
Bureau of Zhejiang Province (grant no. 2017195594) and the Youth
Talent Project of the Zhejiang Province Medical and Health Program
(grant no. 2016148397).
Availability of data and materials
The data sets generated and analyzed during the
study are available from the corresponding author on reasonable
request.
Authors' contributions
BW, MH and JW were responsible for the collection
and screening of cases. BW, TJ, YC, LZ and SZ performed the
statistical analysis and analyzed the data. BW, TJ and JW wrote and
revised the manuscript. The final version of the manuscript has
been read and approved by all authors, and each author believes
that the manuscript represents honest work.
Ethical approval and consent to
participate
This study was approved by the ethics committee of
the First Affiliated Hospital of Zhejiang University (Zhejiang,
China). All patients provided written informed consent.
Patient consent for publication
Not applicable.
Competing interests
The authors declare that they have no competing
interests.
References
|
1
|
Calado A, Neves PM, Santos T and Ravasco
P: The effect of flaxseed in breast cancer: A literature review.
Front Nutr. 5:42018. View Article : Google Scholar : PubMed/NCBI
|
|
2
|
Nakayama T, Sagara Y, Takashima T,
Matsunami N, Masuda N, Miyoshi Y, Taguchi T, Aono T, Ito T,
Kagimura T and Noguchi S: Randomized phase II study of anastrozole
plus tegafur-uracil as neoadjuvant therapy for ER-positive breast
cancer in postmenopausal Japanese women (Neo-ACET BC). Cancer
Chemother Pharmacol. 81:755–762. 2018. View Article : Google Scholar : PubMed/NCBI
|
|
3
|
Oeffinger KC, Fontham ET, Etzioni R,
Herzig A, Michaelson JS, Shih YC, Walter LC, Church TR, Flowers CR,
LaMonte SJ, et al: Breast cancer screening for women at average
risk: 2015 guideline update from the American Cancer Society. JAMA.
314:1599–1614. 2015. View Article : Google Scholar : PubMed/NCBI
|
|
4
|
Vidula N and Rugo HS: Cyclin-dependent
kinase 4/6 inhibitors for the treatment of breast cancer: A review
of preclinical and clinical data. Clin Breast Cancer. 16:8–17.
2016. View Article : Google Scholar : PubMed/NCBI
|
|
5
|
Guo C, Sung H, Zheng S, Guida J, Li E, Li
J, Hu N, Deng J, Figueroa JD, Sherman ME, et al: Age-related
terminal duct lobular unit involution in benign tissues from
Chinese breast cancer patients with luminal and triple-negative
tumors. Breast Cancer Res. 19:612017. View Article : Google Scholar : PubMed/NCBI
|
|
6
|
Zuo TT, Zheng RS, Zeng HM, Zhang SW and
Chen WQ: Female breast cancer incidence and mortality in China,
2013. Thorac Cancer. 8:214–218. 2017. View Article : Google Scholar : PubMed/NCBI
|
|
7
|
McKevitt EC, Dingee CK, Leung SP, Brown
CJ, Van Laeken NY, Lee R and Kuusk U: Reduced time to breast cancer
diagnosis with coordination of radiological and clinical care.
Cureus. 9:e19192017.PubMed/NCBI
|
|
8
|
Nassar FJ, Nasr R and Talhouk R: MicroRNAs
as biomarkers for early breast cancer diagnosis, prognosis and
therapy prediction. Pharmacol Ther. 172:34–49. 2017. View Article : Google Scholar : PubMed/NCBI
|
|
9
|
Nagashima T, Sakakibara M, Sangai T,
Kazama T, Nakatani Y and Miyazaki M: Tumor reduction rate predicts
early recurrence in patients with breast cancer failing to achieve
complete response to primary chemotherapy. Breast Cancer.
17:125–130. 2010. View Article : Google Scholar : PubMed/NCBI
|
|
10
|
Chu W, Jin W, Liu D, Wang J, Geng C, Chen
L and Huang X: Diffusion-weighted imaging in identifying breast
cancer pathological response to neoadjuvant chemotherapy: A
meta-analysis. Oncotarget. 9:7088–7100. 2018. View Article : Google Scholar : PubMed/NCBI
|
|
11
|
Cunningham D, Allum WH, Stenning SP,
Thompson JN, Van de Velde CJ, Nicolson M, Scarffe JH, Lofts FJ,
Falk SJ, Iveson TJ, et al: Perioperative chemotherapy versus
surgery alone for resectable gastroesophageal cancer. N Engl J Med.
355:11–20. 2006. View Article : Google Scholar : PubMed/NCBI
|
|
12
|
Galli G, Bregni G, Cavalieri S, Porcu L,
Baili P, Hade A, Di Salvo F, Sant M, Agresti R, Gennaro M, et al:
Neoadjuvant chemotherapy exerts selection pressure towards luminal
phenotype breast cancer. Breast care (Basel). 12:391–394. 2017.
View Article : Google Scholar : PubMed/NCBI
|
|
13
|
Alekseev NP, Vladimir II and Nadezhda TE:
Pathological postpartum breast engorgement: Prediction, prevention,
and resolution. Breastfeed Med. 10:203–208. 2015. View Article : Google Scholar : PubMed/NCBI
|
|
14
|
Amioka A, Masumoto N, Gouda N, Kajitani K,
Shigematsu H, Emi A, Kadoya T and Okada M: Ability of
contrast-enhanced ultrasonography to determine clinical responses
of breast cancer to neoadjuvant chemotherapy. Jpn J Clin Oncol.
46:303–309. 2016. View Article : Google Scholar : PubMed/NCBI
|
|
15
|
Charehbili A, Wasser MN, Smit VT, Putter
H, van Leeuwen-Stok AE, Meershoek-Klein Kranenbarg WM, Liefers GJ,
van de Velde CJ, Nortier JW and Kroep JR: Accuracy of MRI for
treatment response assessment after taxane- and anthracycline-based
neoadjuvant chemotherapy in HER2-negative breast cancer. Eur J Surg
Oncol. 40:1216–1221. 2014. View Article : Google Scholar : PubMed/NCBI
|
|
16
|
Singh G, Kumar P, Parshad R, Seith A,
Thulkar S and Hosten N: Role of color Doppler indices in predicting
disease-free survival of breast cancer patients during neoadjuvant
chemotherapy. Eur J Radiol. 75:e158–e162. 2010. View Article : Google Scholar : PubMed/NCBI
|
|
17
|
Yang T, Zhang Z, Liu G, Mu D, Sun X, Chen
Z, Liu Y, Wang C, Sun X and Wang Y: Accuracy of MRI for estimating
residual tumor size after neoadjuvant chemotherapy in breast cancer
with three-dimensional reconstruction technique. Zhonghua Wai Ke Za
Zhi. 53:280–284. 2015.(In Chinese). PubMed/NCBI
|
|
18
|
Baghbani F, Chegeni M, Moztarzadeh F,
Mohandesi JA and Mokhtari-Dizaji M: Ultrasonic nanotherapy of
breast cancer using novel ultrasound-responsive alginate-shelled
perfluorohexane nanodroplets: In vitro and in vivo evaluation.
Mater Sci Eng C Mater Biol Appl. 77:698–707. 2017. View Article : Google Scholar : PubMed/NCBI
|
|
19
|
Falou O, Sadeghi-Naini A, Prematilake S,
Sofroni E, Papanicolau N, Iradji S, Jahedmotlagh Z, Lemon-Wong S,
Pignol JP, Rakovitch E, et al: Evaluation of neoadjuvant
chemotherapy response in women with locally advanced breast cancer
using ultrasound elastography. Transl Oncol. 6:17–24. 2013.
View Article : Google Scholar : PubMed/NCBI
|
|
20
|
Garnier M, Champeaux E, Laurent E, Boehm
A, Briard O, Wachter T, Vaillant L, Patat F, Bens G and Machet L:
High-frequency ultrasound quantification of acute radiation
dermatitis: Pilot study of patients undergoing radiotherapy for
breast cancer. Skin Res Technol. 23:602–606. 2017. View Article : Google Scholar : PubMed/NCBI
|
|
21
|
Keune JD, Jeffe DB, Schootman M, Hoffman
A, Gillanders WE and Aft RL: Accuracy of ultrasonography and
mammography in predicting pathologic response after neoadjuvant
chemotherapy for breast cancer. Am J Surg. 199:477–484. 2010.
View Article : Google Scholar : PubMed/NCBI
|
|
22
|
Ma Y, Zhang S, Li J, Li J, Kang Y and Ren
W: Comparison of strain and shear-wave ultrasounic elastography in
predicting the pathological response to neoadjuvant chemotherapy in
breast cancers. Eur Radiol. 27:2282–2291. 2017. View Article : Google Scholar : PubMed/NCBI
|
|
23
|
Itoh A, Ueno E, Tohno E, Kamma H,
Takahashi H, Shiina T, Yamakawa M and Matsumura T: Breast disease:
Clinical application of US elastography for diagnosis. Radiology.
239:341–350. 2006. View Article : Google Scholar : PubMed/NCBI
|
|
24
|
Duffaud F and Therasse P: New guidelines
to evaluate the response to treatment in solid tumors. Bull Cancer.
87:881–886. 2000.(In French). PubMed/NCBI
|
|
25
|
Eisenhauer EA, Therasse P, Bogaerts J,
Schwartz LH, Sargent D, Ford R, Dancey J, Arbuck S, Gwyther S,
Mooney M, et al: New response evaluation criteria in solid tumours:
Revised RECIST guideline (version 1.1). Eur J Cancer. 45:228–247.
2009. View Article : Google Scholar : PubMed/NCBI
|
|
26
|
Baulies S, Belin L, Mallon P, Senechal C,
Pierga JY, Cottu P, Sablin MP, Sastre X, Asselain B, Rouzier R and
Reyal F: Time-varying effect and long-term survival analysis in
breast cancer patients treated with neoadjuvant chemotherapy. Br J
Cancer. 113:30–36. 2015. View Article : Google Scholar : PubMed/NCBI
|
|
27
|
Kern P, Von Minckwitz G, Puetter C,
Pavlidou S, Flach A, Kimmig R and Rezai M: Prognostic impact of
residual disease after neoadjuvant chemotherapy in 648 patients
with triple-negative breast cancer. Anticancer Res. 35:5479–5484.
2015.PubMed/NCBI
|
|
28
|
Miyoshi T, Shiobara M, Wakatsuki K, Arai
S, Suda K, Miyazawa K, Aida T, Takahashi Y and Yoshioka S: Four
cases of occult breast cancer treated with breast conserving
therapy after neoadjuvant chemotherapy. Gan To Kagaku Ryoho.
44:1149–1151. 2017.(In Japanese). PubMed/NCBI
|
|
29
|
Ohno N, Ishida M, Ohnishi K, Sawai K,
Tabata S, Deguchi M, Kitajima T and Kaizaki Y: A case of
pathological complete response following neoadjuvant chemotherapy
with gemcitabine plus nab-paclitaxel in borderline resectable
pancreatic cancer. Gan To Kagaku Ryoho. 44:1735–1738. 2017.(In
Japanese). PubMed/NCBI
|
|
30
|
Lee SC, Grant E, Sheth P, Garcia AA, Desai
B, Ji L, Groshen S, Hwang D, Yamashita M and Hovanessian-Larsen L:
Accuracy of contrast-enhanced ultrasound compared with magnetic
resonance imaging in assessing the tumor response after neoadjuvant
chemotherapy for breast cancer. J Ultrasound Med. 36:901–911. 2017.
View Article : Google Scholar : PubMed/NCBI
|
|
31
|
Zhou J, Luo Y, Ma BY, Ling WW and Zhu XL:
Contrast-enhanced ultrasound diagnosis of hepatic metastasis of
concurrent medullary-papillary thyroid carcinoma: A case report.
Medicine (Baltimore). 96:e90652017. View Article : Google Scholar : PubMed/NCBI
|
|
32
|
Sasada S, Masumoto N, Goda N, Kajitani K,
Emi A, Kadoya T and Okada M: Dedicated breast PET for detecting
residual disease after neoadjuvant chemotherapy in operable breast
cancer: A prospective cohort study. Eur J Surg Oncol. 44:444–448.
2018. View Article : Google Scholar : PubMed/NCBI
|
|
33
|
Weber JJ, Jochelson MS, Eaton A, Zabor EC,
Barrio AV, Gemignani ML, Pilewskie M, Van Zee KJ, Morrow M and
El-Tamer M: MRI and prediction of pathologic complete response in
the breast and Axilla after neoadjuvant chemotherapy for breast
cancer. J Am Coll Surg. 225:740–746. 2017. View Article : Google Scholar : PubMed/NCBI
|
|
34
|
Girotra M, Soota K, Dhaliwal AS, Abraham
RR, Garcia-Saenz-de-Sicilia M and Tharian B: Utility of endoscopic
ultrasound and endoscopy in diagnosis and management of
hepatocellular carcinoma and its complications: What does
endoscopic ultrasonography offer above and beyond conventional
cross-sectional imaging? World J Gastrointest Endosc. 10:56–68.
2018. View Article : Google Scholar : PubMed/NCBI
|
|
35
|
Jia WR, Tang L, Wang DB, Chai WM, Fei XC,
He JR, Chen M and Wang WP: Three-dimensional contrast-enhanced
ultrasound in response assessment for breast cancer: A comparison
with dynamic contrast-enhanced magnetic resonance imaging and
pathology. Sci Rep. 6:338322016. View Article : Google Scholar : PubMed/NCBI
|
|
36
|
Xu HD and Zhang YQ: Evaluation of the
efficacy of neoadjuvant chemotherapy for breast cancer using
diffusion-weighted imaging and dynamic contrast-enhanced magnetic
resonance imaging. Neoplasma. 64:430–436. 2017. View Article : Google Scholar : PubMed/NCBI
|
|
37
|
Dietrich CF, Averkiou M, Nielsen MB, Barr
RG, Burns PN, Calliada F, Cantisani V, Choi B, Chammas MC, Clevert
DA, et al: How to perform Contrast-Enhanced Ultrasound (CEUS).
Ultrasound Int Open. 4:E2–E15. 2018. View Article : Google Scholar : PubMed/NCBI
|
|
38
|
Ang J, Hu L, Huang PT, Wu JX, Huang LN,
Cao CH, Zheng YX and Chen L: Contrast-enhanced ultrasonography
assessment of gastric cancer response to neoadjuvant chemotherapy.
World J Gastroenterol. 18:7026–7032. 2012. View Article : Google Scholar : PubMed/NCBI
|
|
39
|
Kitamura H, Koike S, Nakazawa K, Matsumura
H, Yokoi K, Nakagawa K and Arai M: A reversal in the vascularity of
metastatic liver tumors from colorectal cancer after the cessation
of chemotherapy plus bevacizumab: Contrast-enhanced ultrasonography
and histological examination. J Surg Oncol. 107:155–159. 2013.
View Article : Google Scholar : PubMed/NCBI
|
|
40
|
Yerli H, Yilmaz T, Kaskati T and Gulay H:
Qualitative and semiquantitative evaluations of solid breast
lesions by sonoelastography. J Ultrasound Med. 30:179–186. 2011.
View Article : Google Scholar : PubMed/NCBI
|
|
41
|
Zhu Y, Deng S, Zhang Y and Jiang Q:
Comparative study of ultrasonic elastography and conventional
ultrasound in diagnosis of malignant anus neoplasm. Exp Ther Med.
15:2343–2346. 2018.PubMed/NCBI
|